Introduction
With the rapid development of China’s economy, China has built a large number of automobile highways, high-speed railways, and hydropower projects, which involve a large number of tunnel excavations [1-3]. Urban tunnels are frequently found in the delicate ecological environment of the mountainous region in southwest China. These projects are situated in diverse terrains characterized by intricate geological formations [4-7]. Consequently, it is anticipated that there will be an increase in the occurrence of deeper and longer tunnel excavations in the future. Tunnels that traverse areas with intricate geological conditions and ongoing tectonic activity are prone to encountering geological hazards, such as water inrush and tunnel collapse [8-10]. Among the various hazards encountered in tunnel construction, water inrush from fractured fault zones is one of the most significant geological challenges for tunnels [11]. The water-rich fault zone through which the tunnel passes is characterized by rich water content, a loose structure, and weak cementation. The presence of water inrush not only causes delays in construction timelines but also poses risks to the safety of tunnel construction workers and disrupts ecosystems [12-15]. Water inrush can be alleviated through the implementation of advanced drilling and drainage techniques in fractured fault zones during the construction of tunnels [16, 17]. As the process of tunnel construction progresses and water is gradually drained, the seepage field within the tunnel undergoes a series of dynamic changes. To ensure the safety of tunnel construction, it is imperative to comprehend the evolution pattern of seepage fields in fault fracture zones during the drainage process. Numerous researchers have conducted extensive and varied investigations on the seepage fields of tunnels. Recently, an analytical model that takes into account the influence of tunnel lining and grouting circles on the seepage field has been developed [18, 19]. A test system for three-dimensional modeling was developed in order to simulate the effects of water inrush on strata pressure and hydraulic pressure [20]. A novel analytical approach is presented in this study to estimate and evaluate the inflow from tunnel excavations in rocky terrain [21]. Numerical experiments, when combined with analytical solutions, offer a rational approach for the initial design of primary and secondary supports in deep tunnels situated below the water level [22]. Theoretical analyses and numerical simulations were used to calculate the seepage rates in various parts of the tunnel, and the study showed that the calculated results were in agreement with the observed values [23]. A large-scale geotechnical model test is developed to study the process of water inrush in deep tunnels with confined aquifers, and the model test provides an intuitive understanding of the water inrush in fault tunnels [24]. The mechanism of lagging water inrush in underground tunnel constructions due to the proximity of a karst cavern with confined water is investigated via large-scale physical three-dimensional model testing and numerical simulations. A new method is proposed for the preparation of modeled karst caverns filled with confined water [25]. Undoubtedly, these studies have revealed the causes and patterns of water inrush, providing methods for prediction and prevention. In spite of this, limited research has been conducted on how changes in the surrounding seepage field of tunnels are affected by changes in the drainage volume in fractured fault zones.

The objective of this study is to investigate the evolutionary characteristics of the seepage field within the fractured fault zone of a tunnel. The engineering characteristics of fault fracture zones were tested in order to determine the fundamental parameters. A model test and numerical simulation were conducted to analyze the variations in the seepage field and reduction coefficient under various drainage conditions. This outcome is anticipated to offer both theoretical and practical significance in the areas of tunnel siting, construction, and maintenance.
Geological Settings
As depicted in Fig. 1, the tunnel is situated within a region known for erosional tectonics. The topography in this region exhibits significant surface erosion. The main geological formations exposed in the tunnel area include Cambrian igneous rocks, Triassic, Devonian, Silurian, and Ordovician sedimentary rocks, as well as Quaternary deposits. The tunnel site is characterized by the development of gullies and streams with numerous ravines. The water sources for these gullies and rivers come from atmospheric precipitation and groundwater. The fractured section of the tunnel within the study area is situated at a relatively shallow depth and passes through nearby gullies. The upper stratum is predominantly comprised of granite, whereas the lower section is characterized by mudstone and a fragmented rock mass. Consequently, the mudstone and granite in close proximity to the fault exhibit a significant degree of fragmentation.
Methodology
Materials and Model Experiment Setting
(1) Determination of similarity ratio
A physical model testing apparatus was constructed using geometric scale ratios in order to accurately replicate the conditions of a fractured fault zone. In order to ensure the similarity between prototypes and models, as well as the applicability and effectiveness of model experiments, it is imperative to establish a similarity ratio for relevant physical quantities. Dimensional analysis in modeling tests is a mathematical technique used to explore and understand the relationships between various physical quantities involved in a system. It involves examining the dimensions (units) of different variables and parameters and expressing them in a dimensionless form. The goal is to reduce the number of variables and simplify the representation of physical phenomena. By employing dimensional analysis, three fundamental physical quantities, namely geometric dimensions (L), unit weight (γ), and permeability coefficient (k) are chosen. Considering the actual scope of tunnel engineering and the range of fractured fault zones and indoor conditions, the geometric similarity ratio has been determined to be 100. The similarity ratio for other mechanical parameters has been derived and is presented in Table 1.
Table 1.
Similarity ratio for various physical quantities.
Table 2.
Similarity ratio for various physical quantities.
| Name | Permeability Coefficient (cm/s) | Friction Angle (°) | Natural Density (kN·m-3) | Saturated Density (kN·m-3) |
|---|---|---|---|---|
| Fractured Zone | 6.714×10⁻³ | 31 | 15.5 | 16.3 |
(2) Experimental Materials
This model experiment utilized a mixture composed of 70-mesh and 10-mesh quartz sand in a mass ratio of 3:1 to simulate a fractured fault zone. According to the geological survey data, taking into account practical conditions and utilizing laboratory measurements of permeability coefficients, the physical-mechanical parameters of the fractured zone prototype in this model test have been compiled and presented in Table 2.
(3) Design of the Model Test System
The model test system comprises the model box, water supply box, and measurement system.
The dimensions of the model box are 1.20 meters in length, 0.70 meters in width, and 0.60 meters in height. As shown in Fig. 2, drainage holes are positioned in the middle and lower sections beneath the front slab to replicate the occurrence of water inrush in the tunnel. Two water supply boxes are positioned at the upper part of the model box, with the left and right boxes being refilled with equal water pressure through the replenishment pipes. The lower, middle, and upper layers are arranged in a parallel direction to the horizontal plane, with five sensors positioned. This study aims to simulate an ideal homogeneous aquifer with finite restrictions and a coefficient under conditions where evaporation is absent. The model is predicated on the assumption of consistent recharge boundaries and a horizontally impermeable base on both sides. Multiple scenarios are observed within the same medium, with consistent recharge but varying drainage conditions. The aim of this study is to examine the variations in hydraulic head and pressure at different locations during the ingress of water into a tunnel. In order to comprehend the patterns of variation in water levels, an analysis of hydraulic pressure and reduction coefficients is conducted. The key experimental conditions are summarized in Table 3, with the blank condition representing the initial state. Experimental conditions for WS1, WS2, WS3, and WS4 all involve bilateral water replenishment, albeit with varying numbers of drain holes. Experimental conditions in NWS2 and NWS4 are characterized by the presence of two and four drain holes, respectively, which facilitate drainage without recharge.
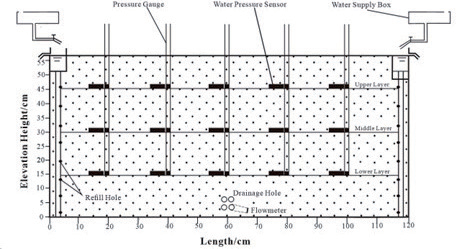
Table 3.
An overview of the experimental conditions.
Water Inrush Simulation
In experimental simulations, the manipulation of the number of drainage holes serves as a means to regulate the drainage volume, thereby allowing for the approximation of a tunnel traversing region based on the prevailing drainage conditions. The following are the steps:
(1) pre-configured layer of sand was poured into the chamber, each layer approximately 10 cm thick. The samples were filled in layers and were saturated, ventilated, and compacted to avoid delamination. The water pressure sensors were installed after the samples reached the corresponding heights.
(2) Following the filling of the sand layer, the aquifer was maintained in a continuously saturated state and subsequently consolidated for an extended duration, making it possible to consider it a fault fracture zone in practical working conditions.
(3) The drain holes were intentionally opened in order to replicate the process of tunnel drainage. The timer started when the holes were opened. tubes, along with volume, were measured and recorded at different stages.
(4) Multiple individuals collaborated to concurrently assess tubes, thereby mitigating potential errors. Measurements of surge velocity were conducted at various time intervals and recorded using measuring cylinders of varying capacities and accuracies. The aforementioned four steps encompass a comprehensive experimental procedure.
Numerical Simulation of Water Inrush of Tunnel
The experiment is repeated in accordance with the specified conditions. In drainage, with the aim of conducting a previous model experiment, numerical simulations are conducted to analyze the characteristics and variations of the seepage field during water inrush in tunnels. These simulations are employed for the purpose of validating and enhancing the outcomes derived from the model experiments. The numerical simulation process in this study is as follows:
(1) The model type in the numerical computational model was set to steady-state.
(2) According to the dimensions of the model box and the geometric similarity ratio, a numerical model with dimensions of 1.2 m × 0.7 m × 0.6 m was established.
(3) A constant total head with a certain height was imposed on both sides to simulate continuous and infinite water supply conditions. The initial hydraulic head in the numerical model was established to correspond with the initial water level within the model box.
(4) In this numerical simulation, the fractured zone was simplified as a homogeneous aquifer. To ensure computational efficiency while maintaining accuracy, the model was discretized into a grid. In the established numerical model, different hydraulic conductivity coefficients are altered to simulate changes in the seepage field after excavation under various conditions.
The Method of Obtaining the Reduction Coefficient
In order to show the law of change of water pressure reduction coefficient, the actual water pressure of each measuring point is collected by the water pressure sensor, and then the theoretical water pressure is calculated by the water level of the pressure pipe, and the water pressure reduction coefficient is calculated by combining the actual water pressure and the theoretical water pressure under the environment. The specific calculations are as follows:
Fig. 3.
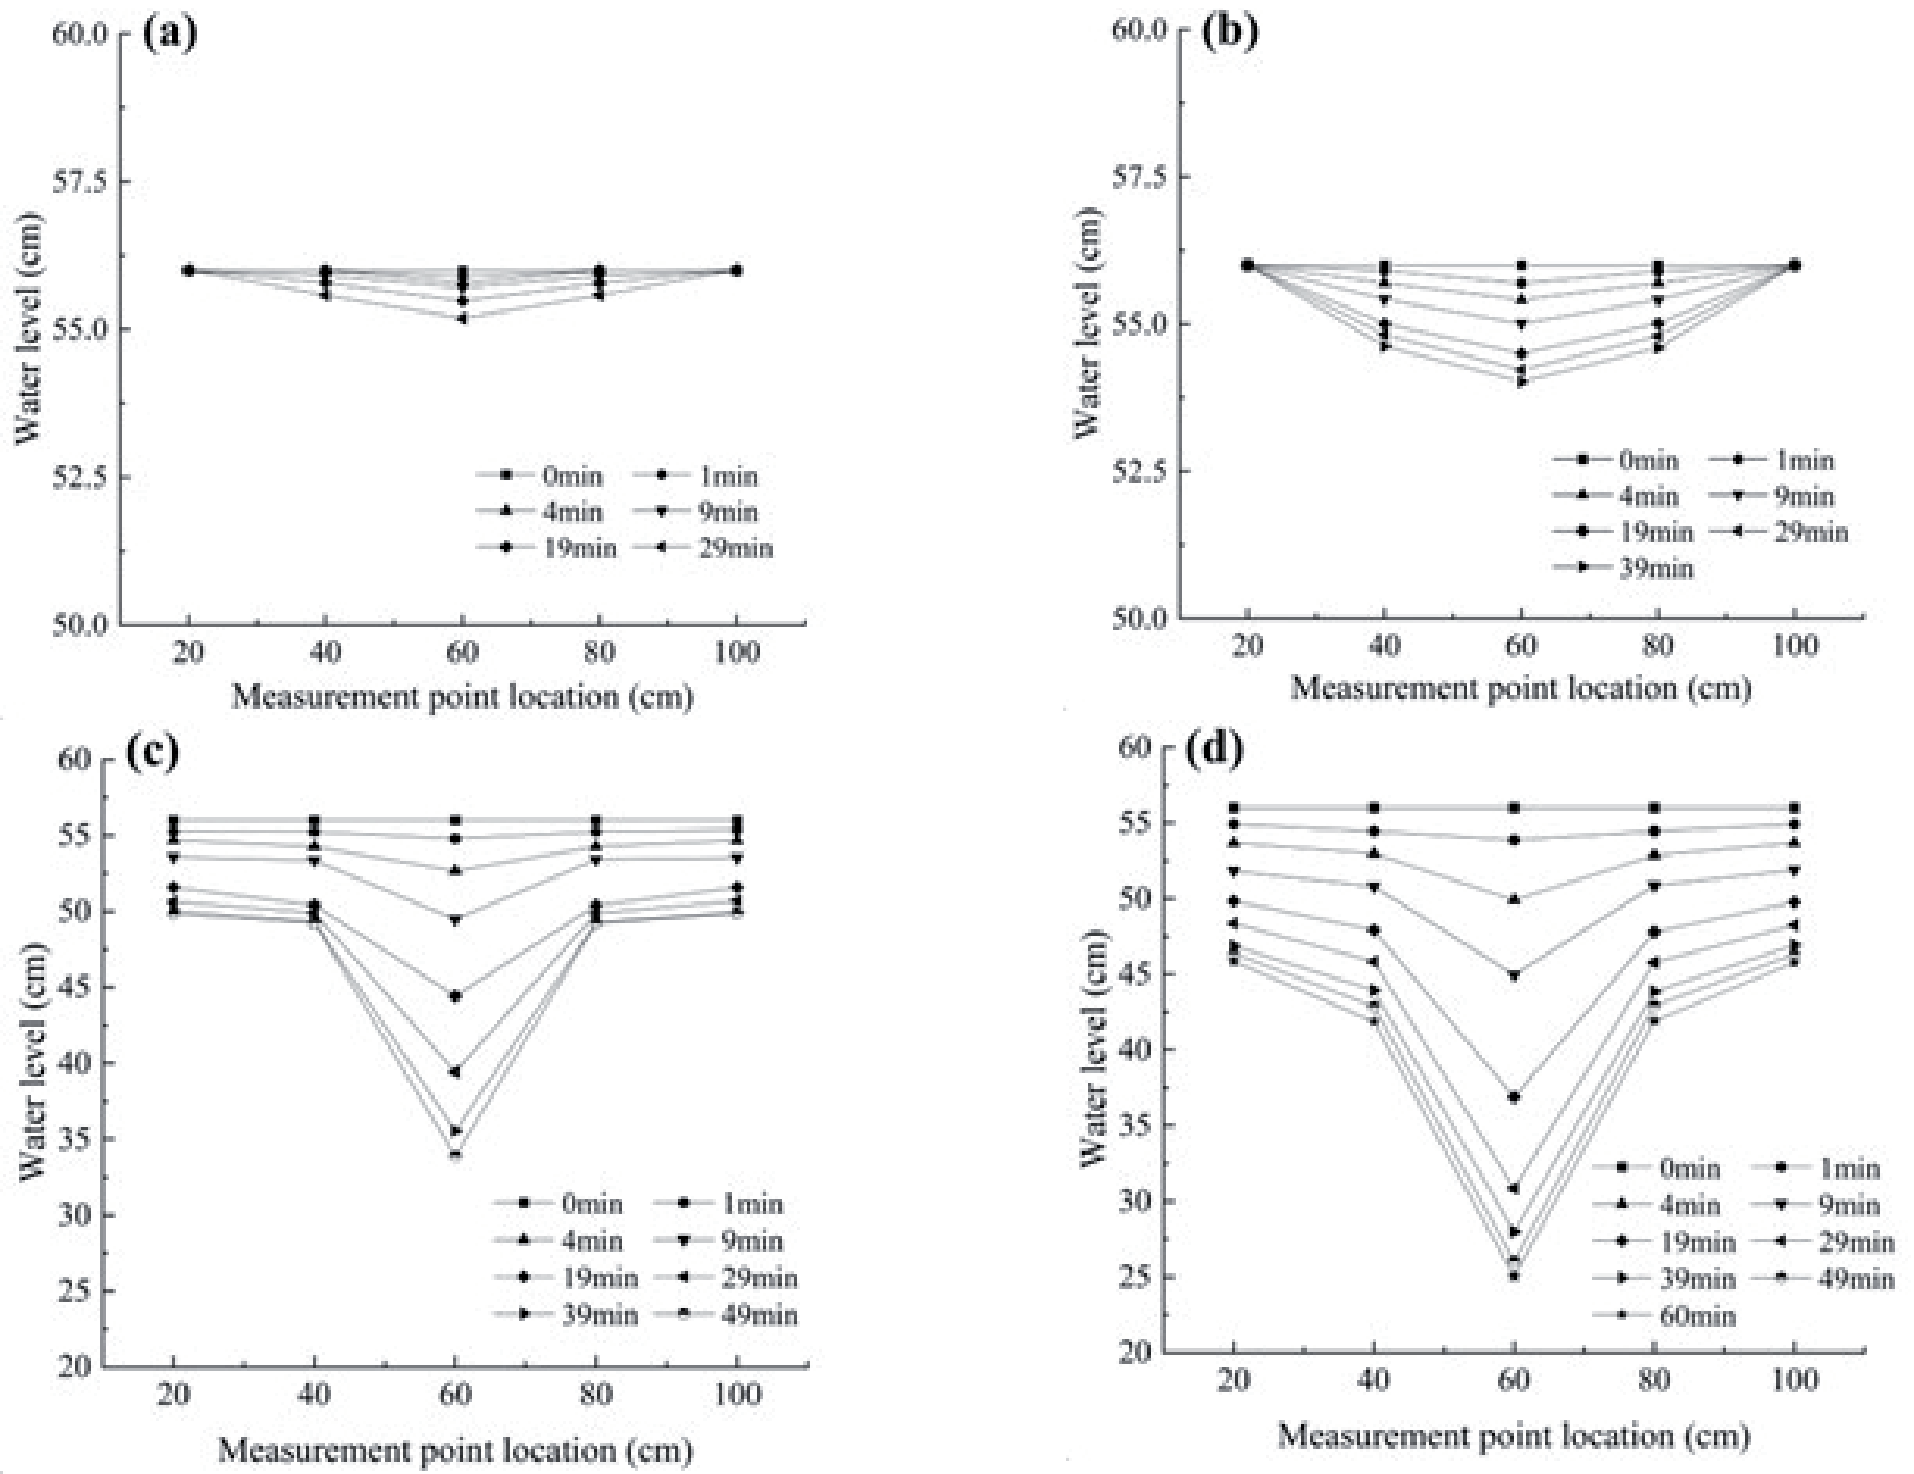
Changes in water level under different conditions with water supplementation. a) WS1; b) WS2; c) WS3; d) WS4.
where P1, γω, and H0 represent the theoretical water pressure, the unit weight of water, and the water level height in the pressure pipe, respectively.
where P2 and β represent the actual water pressure collected by water pressure sensors and the reduction coefficient, respectively.
Results and Discussion
Changes in Water Level
When the aquifer reaches its maximum saturation, the drain valve is opened, and the water level and elevation at each measurement point are simultaneously measured using curves. This method was employed to ascertain the formation process and shape of descent funnels under different drainage and replenishment conditions.
(1) Double-sided replenishment
Fig. 3 shows that the drainage process will result in a certain reduction in drainage volume. Initial changes in the water levels of WS1 appear to be minimal, and only a moderate decrease in the middle water level is observed. As the drainage process continues, water levels at various points tend to stabilize. When compared with SW1, the initial drainage volume of WS2 increases, and the water level changes noticeably in the vertical direction of the drainage holes. As drainage progresses, it gradually approaches a balance between water supply and drainage, leading to stabilized water levels at various points. When under WS3, the initial drainage volume is higher than the replenishment volume during the first 0 to 4 minutes, there is a consistent downward trend across all observation points. At the 9th minute, the difference in water levels becomes apparent, forming a distinct descent funnel. The water level tends to stabilize after 39 minutes. Due to the overall drainage volume being greater than the supply volume, the water level at the edge of the model box has dropped by about 6 cm. WS4 represents the maximum drainage volume in the experiment, shows a notable increase compared to WS. 3. Similarly, water levels begin to decrease rapidly right from the beginning. During this descent, measurement points farther away from the vertical direction of the drainage hole and experiences smaller changes in water level. It was observed that after 19 minutes, the descent volume slowed down, forming a distinct funnel-like shape with a central depression. Additionally, the water level on both sides decreases with a greater decline than on WS 3, amounting to approximately 10 cm.
Fig. 4.
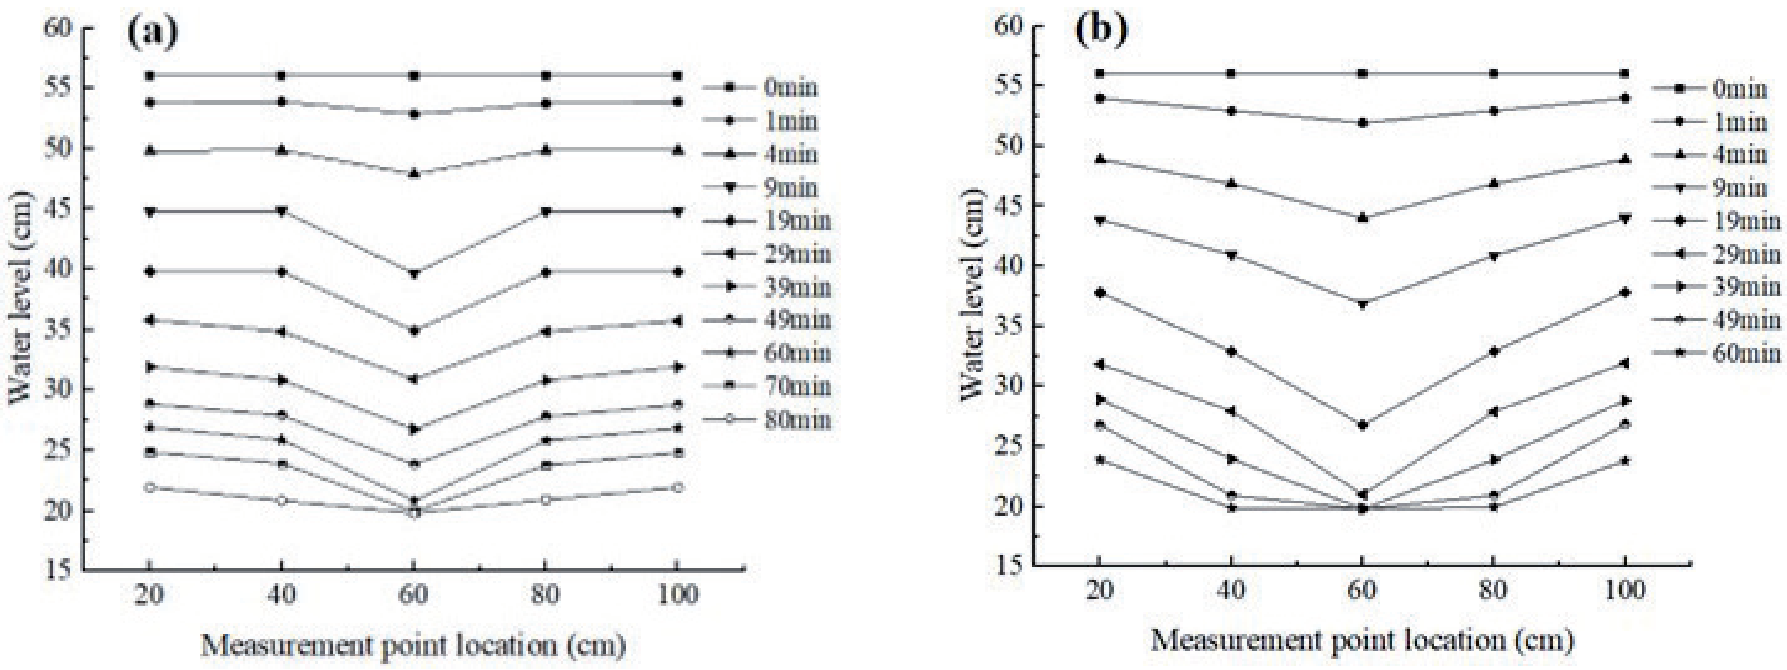
Changes in water level under different conditions without water supplementation. a) NWS2; b) NWS4.
Based on the test results, it is evident that as groundwater is discharged during tunnel excavation, a descent funnel is created in the area, and the shape of the descent funnel varies at different points. The water level at each observation point decreases correspondingly with the discharge of groundwater. Under the influences of groundwater discharge rate, medium permeability, and boundary conditions, the descent “funnel” forms with different degrees of downward curvature, and the water level at the drainage point would not decrease to zero. The comparison of the results from the four different experimental conditions reveals that as the inflow rate increases, the decline in water level in the vertical direction of the drainage hole also becomes more significant. Consequently, the descent “funnel” becomes more pronounced, and the corresponding affected area gradually expands.
(2) Without replenishment of water
Under conditions without water replenishment, different quantities of drainage holes were controlled to manage the inflow rate. Fig. 4 shows that the water level initially showed a nearly uniform decline in the case of NWS2. As drainage continued, differences in water levels became apparent, and the water levels exhibited a uniform descent after 19 minutes. The central position halted its descent near the drainage holes before gradually extending toward both sides. In the case of NWS4, apart from a reduced time required to reach the vicinity of the drainage holes, the other aspects exhibited comparable patterns of change to those observed when two drainage holes were open. When comparing the outcomes of the two distinct conditions, it becomes apparent that there is a noticeable trend: as the drainage volume increases, the water level at the top of the drainage holes decreases at a more accelerated rate. Consequently, the formation of the descent funnel occurs at an accelerated rate, leading to a gradual expansion of the affected area. The water level eventually diminishes to the level of the drainage holes in the absence of a water supply source. The formation of the most prominent descent funnel occurs during the later stages of drainage.
By conducting a comprehensive analysis of all the experimental conditions, it can be inferred that the relatively low source does not result in significant fluctuations in groundwater levels. When the discharge is substantial, it can cause a decrease in level, potentially reaching the rate at which the water supply is insufficient. The discharge can exert a substantial influence on the overall groundwater levels.
Seepage Field Analysis
The hydraulic conductivity coefficient (C) fundamentally represents the efficiency of water flow between the aquifer and the tunnel. In conjunction with the model experimental design, the increase in the number of drainage holes is indicated by increasing the hydraulic conductivity coefficient (C), which is assumed to be 0.02, 0.04, 0.06, and 0.08 in this numerical simulation.
As shown in Fig. 5, the hydraulic head of each seepage field is gradually decreasing as the hydraulic conductivity coefficient increases. At various locations in the aquifer, the hydraulic head has exhibited slight variations at C = 0.02, and the hydraulic head in the seepage field has decreased by approximately 0.02 meters (Fig. 5a). The rate of decrease in water level is higher at C = 0.04, resulting in a decline in hydraulic head from 0.56 meters to approximately 0.53 meters (Fig. 5b). The hydraulic head at different locations within the aquifer has experienced a decrease to some degree as the hydraulic conductivity coefficient has increased. At C = 0.06, the hydraulic head in the seepage field decreases to approximately 0.34 meters (Fig. 5c). The variation of the hydraulic head gradient is more pronounced in the vertical direction compared to the horizontal direction. The aquifer displays a clearly defined symmetrical descent funnel shape on both sides. At C = 0.08, which is comparable to the WS4 scenario in the model experiments, the drainage rate is observed to be high. This leads to a rapid decrease in water levels above the tunnel, as depicted in Fig. 5d). The hydraulic head above the drainage holes exhibits a rapid decrease, ultimately reaching the level of the drainage holes at equilibrium. The hydraulic head on both sides displays a symmetrical descent funnel shape. As the volume of drainage increases, the range of influence of the seepage field also expands. In situations where there is a lack of water supply or a low rate of water supply, an increase water supply results in decreased field for both models. Eventually, the hydraulic head in both seepage fields reaches its minimum level, equal to the elevation of the drainage pipe, which is 0.2 meters.
Fig. 5.
Seepage fields under different hydraulic conductivity coefficients. a) C = 0.02; b) C = 0.04; c) C= 0.06; d) C = 0.08.
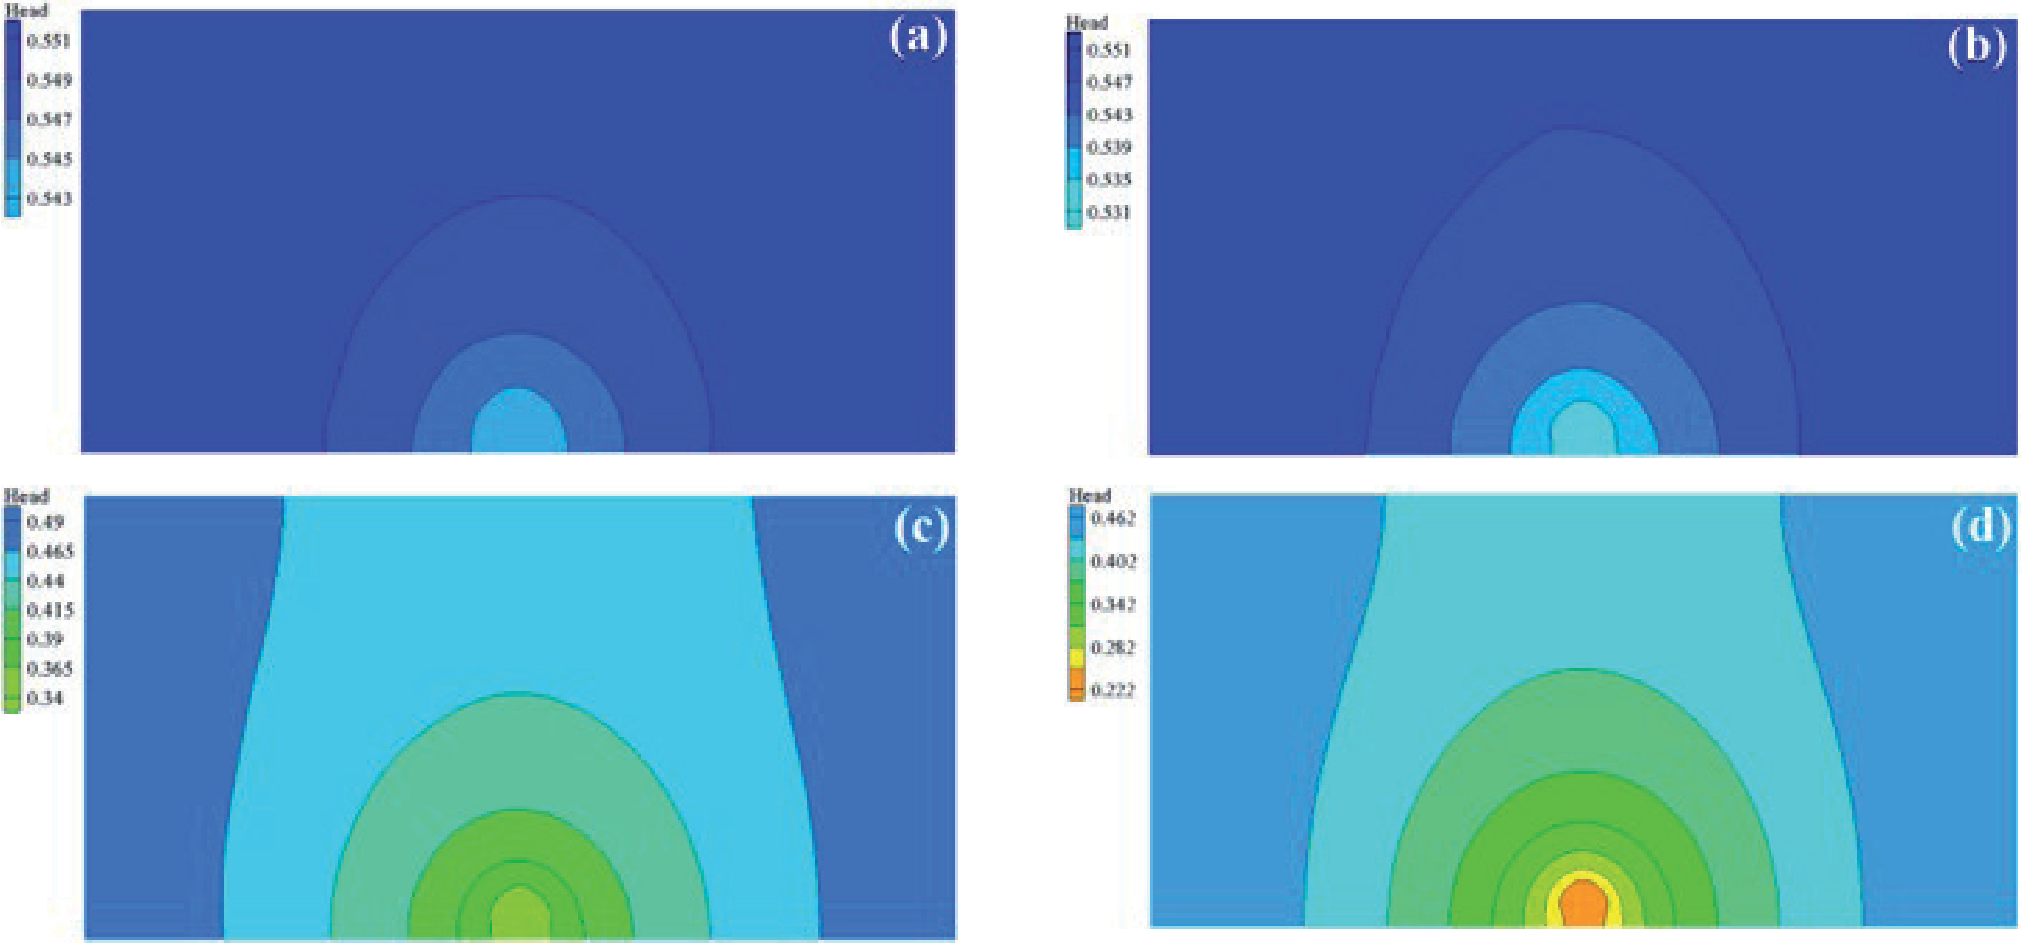
Fig. 6.
Variation curves of reduction coefficients at different locations under various conditions. a) WS1; b) WS2; c) WS3; d) WS4.
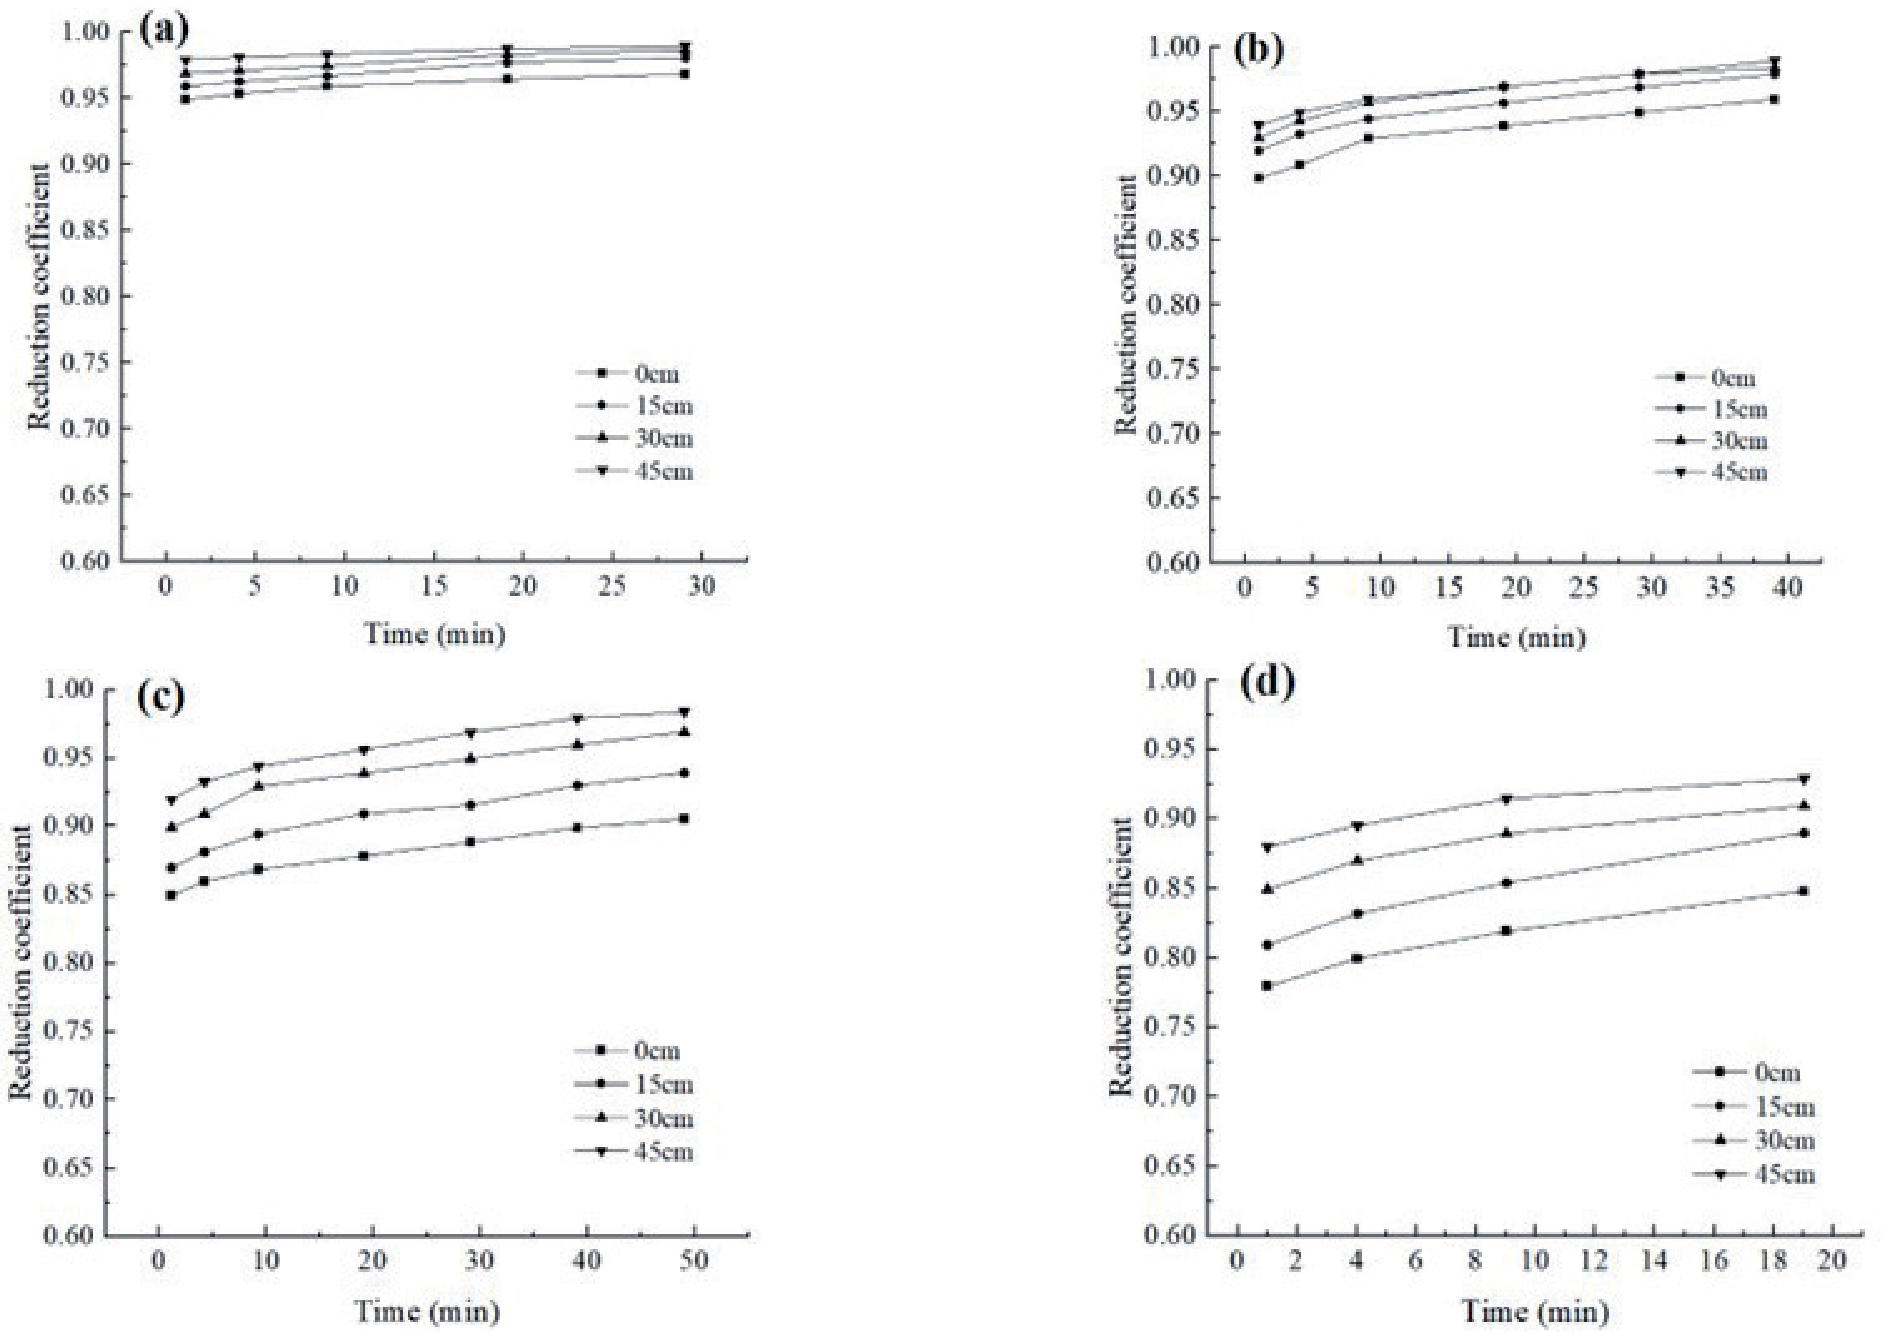
Table 4.
Drainage volumes under different experimental conditions.
| Experimental conditions | 2 | 3 | 4 | 5 |
|---|---|---|---|---|
| Drainage Volume (ml/min) | 500 | 1000 | 1700 | 2800 |
The experimental results obtained from the model exhibit a close correspondence with the numerical simulation results. Considering the variations in drainage volume under conditions of both water replenishment and no-water replenishment, it can be inferred that the alterations in the seepage field become increasingly intricate under different drainage conditions during continuous water replenishment. Analysis by numerical simulation combined with modeling experiments is both economical and safe compared to actual field tests. It can help people better understand the distribution of seepage after tunnel excavation, predict possible problems in advance, and take corresponding measures in the design and construction process, thus ensuring the stability and safety of the tunnel.
Characteristics of the Reduction Coefficient Variations
Performing a trend analysis of reduction coefficients at pPerforming a trend analysis of reduction coefficients at points located at different horizontal distances from drainage holes over time.
Fig. 6 illustrates that the reduction coefficients undergo certain changes as drainage continues. During the early drainage stages, the value of the reduction coefficient is minimal. However, the reduction coefficients gradually increase as drainage progresses, and the water levels at the respective positions continuously decrease while the drainage rates reduce.
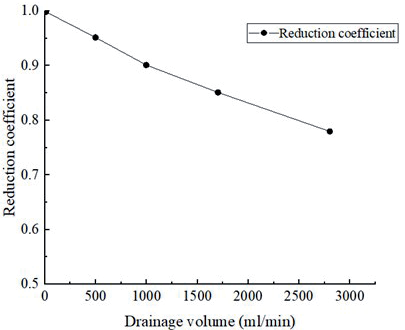
In the instances of WS1 and WS2, the reduction coefficient gradually converges towards 1, signifying a negligible decrease in water pressure. In the case of WS3 and WS4, the reduction coefficients exhibit a certain degree of increase as the drainage process progresses. With a growing number of drainage holes, the variations in reduction coefficients at different locations become more evident. Upon comprehensive analysis of the formation of funnels during drainage, it becomes apparent that the reduction coefficient is influenced by both the hydraulic head and the volume of drainage. As indicated in Table 4, the determination of the stable flow rate is based on identifying the flow rate that exhibits minimal fluctuations in drainage volume throughout the entire duration of the experiment.
As depicted in Fig. 7, there exists a linear relationship in proper drainage where the water pressure remains constant and the reduction coefficient is equal to 1. Notably, it can be observed that as the volume of drainage increases, there is a continuous decrease in the reduction coefficient. The analysis of the descent funnel reveals that when the drainage volume is infinitely large, there is a substantial decrease in the overall water level, possibly reaching near the tunnel floor. There is no presence of groundwater above the tunnel; thus, pore water pressure is absent.
Conclusions
In the present study, a series of modeling tests and numerical simulations were performed to investigate the evolutionary characteristics of the tunnel seepage field. The following results were obtained:
(1) The experimental results suggest fault-fractured zones during water inrush incidents can vary due to boundary constraints and differences in the supply rate. When the volume of replenishment is inadequate and the volume of drainage is relatively high, there is a possibility that the groundwater level may decrease significantly in the vicinity of the drainage point. Without the replenishment of a water source, the volume of drainage significantly affects the level of groundwater.
(2) Numerical simulations illustrate that tunnel excavation causes changes in the underground seepage field. The groundwater level around the tunnel decreases to form a funnel-shaped distribution. However, the extent of this influence is constrained. Both the rates of drainage and hydraulic head have a significant impact on the magnitude and spatial distribution of the seepage field. The numerical simulation results closely match the experimental results from the model.
(3) During the drainage process, the analysis of data from pressure measuring tubes and sensors indicates that there is a phenomenon of hydraulic pressure reduction during the groundwater seepage process. As the drainage volume decreases, the reduction coefficient continuously increases. Consequently, the reduction coefficient remains relatively stable when approaching the replenishment-drainage balance or at low drainage rates.