Introduction
The scientific community uniformly agrees that climate warming and increased human activities have a sustained impact on natural grassland ecosystems [1, 2]. Under the influence of warming, drought, and overgrazing, alpine meadows are degraded, and their ecosystems’ community structure and composition are rapidly transformed from being dominated by Cyperaceae and Poaceae to other forbs [3, 4]. For herbivores, the utility value of such graminoid plant species far exceeds that of forbs [5]. Thus, the economic value of grasslands is currently being reduced; meanwhile, the functions of meadow ecosystems are being greatly affected, which has been a widely reported phenomenon in recent decades [6, 7]. For this reason, many ecologists conclude that alpine meadows will remain in a state of continuous degradation for a long time henceforth, which will have an important effect on the ecosystem functioning of alpine meadows [7].
Since the 1960s, many scientific publications have emphasized the importance of ecological functions of soil biodiversity in agricultural systems [8, 9]. Additionally, a growing number of studies have focused on the impact of ecosystem multifunctionality on evaluations of the function and health status of soil ecosystems [4, 10-14]. Therefore, it is crucial to assess the supportive capacity of various ecological functions during grassland degradation to enable sustainable management of grassland ecosystems, as well as to mitigate and regulate the human impacts on these ecosystems. Grassland degradation has seriously affected grassland ecosystem multifunctionality [11, 12], but the response of grassland ecosystem multifunctionality to different disturbances is still unclear. Especially under current and expected future overgrazing, little is known about the impact of soil microbial changes on ecosystem multifunctionality in alpine meadows. Therefore, in the context of overgrazing, one key scientific issue is evaluating the influence of grassland degradation on the ecological function of alpine meadow ecosystems.
As a critical engine driving ecosystem functions [15], soil microorganisms affect almost all ecosystem processes, for example, by driving nutrient circulation [16], affecting plant growth, and controlling plant diseases [9, 17]. However, the expansion of degraded grassland across the globe persists [4], and the soil microbial community is threatened by land degradation [3, 11]. Grassland degradation is recognized to both diminish soil microbial diversity and alter community composition [5, 18], which can impact an ecosystem’s multifunctionality. However, this mechanism has not been well confirmed in alpine meadow ecosystems.
The inference of co-occurrence networks is an important tool to evaluate microbial complexity and its response to environmental changes [19, 20]. As a complex group, the microbial community and its structure are highly interlinked [18, 21], forming a complex interrelated network. Even though there is not always a simple quantitative association between microbial populations, at present, most studies use co-occurrence networks to quantitatively analyze the complexity and stability of microorganisms in the ecosystem [6, 11]. Complex networks with high link density and modularity are deemed more stable owing to their ability to inhibit interference [12, 22, 23] because strengthening the complex interactions in soil microbial communities can improve their ability to resist extreme climate conditions [24, 25]. Meanwhile, the symbiotic network of microbial communities is also known to affect ecosystem functioning [18, 26, 27]. For example, in the context of global climate change, it has been demonstrated that the variation of temperature and precipitation can change the network structure and stability of microbial communities, thus affecting ecosystem functions [5, 21, 28], such as the soil carbon cycle and soil nutrient cycle. Therefore, studying how grassland degradation affects the network structure of the soil microbial community may help to reveal the microbial mechanisms through which degradation affects the multifunctionality of ecosystems.
Here, we investigated the impact of grassland degradation on the network complexity of soil fungal communities, ecosystem multifunctionality, and the nature of their relationship. We focused on fungi owing to their sensitivity and diversity as soil microorganisms [11, 29] and their important role in regulating ecosystem functioning and resilience to grassland disturbance [10, 11]. Therefore, this study analyzed the differences in carbon cycling, plant productivity, soil nutrient cycling, and soil activity between degraded alpine meadows and non-degraded alpine meadows from three aspects: vegetation, soil, and soil microorganisms. We further evaluated the relationship between the complexity of soil fungal networks and ecosystem multifunctionality in degraded and non-degraded meadows. In this study, we hypothesized that compared with non-degraded meadow, the extremely degraded meadow (1) changed the composition of the soil fungal community and reduced the complexity of soil fungal networks and the ecosystem multifunctionality; (2) revealed that the decline of fungal network complexity reduced the ecosystem multifunctionality.
Materials and Methods
Study Area
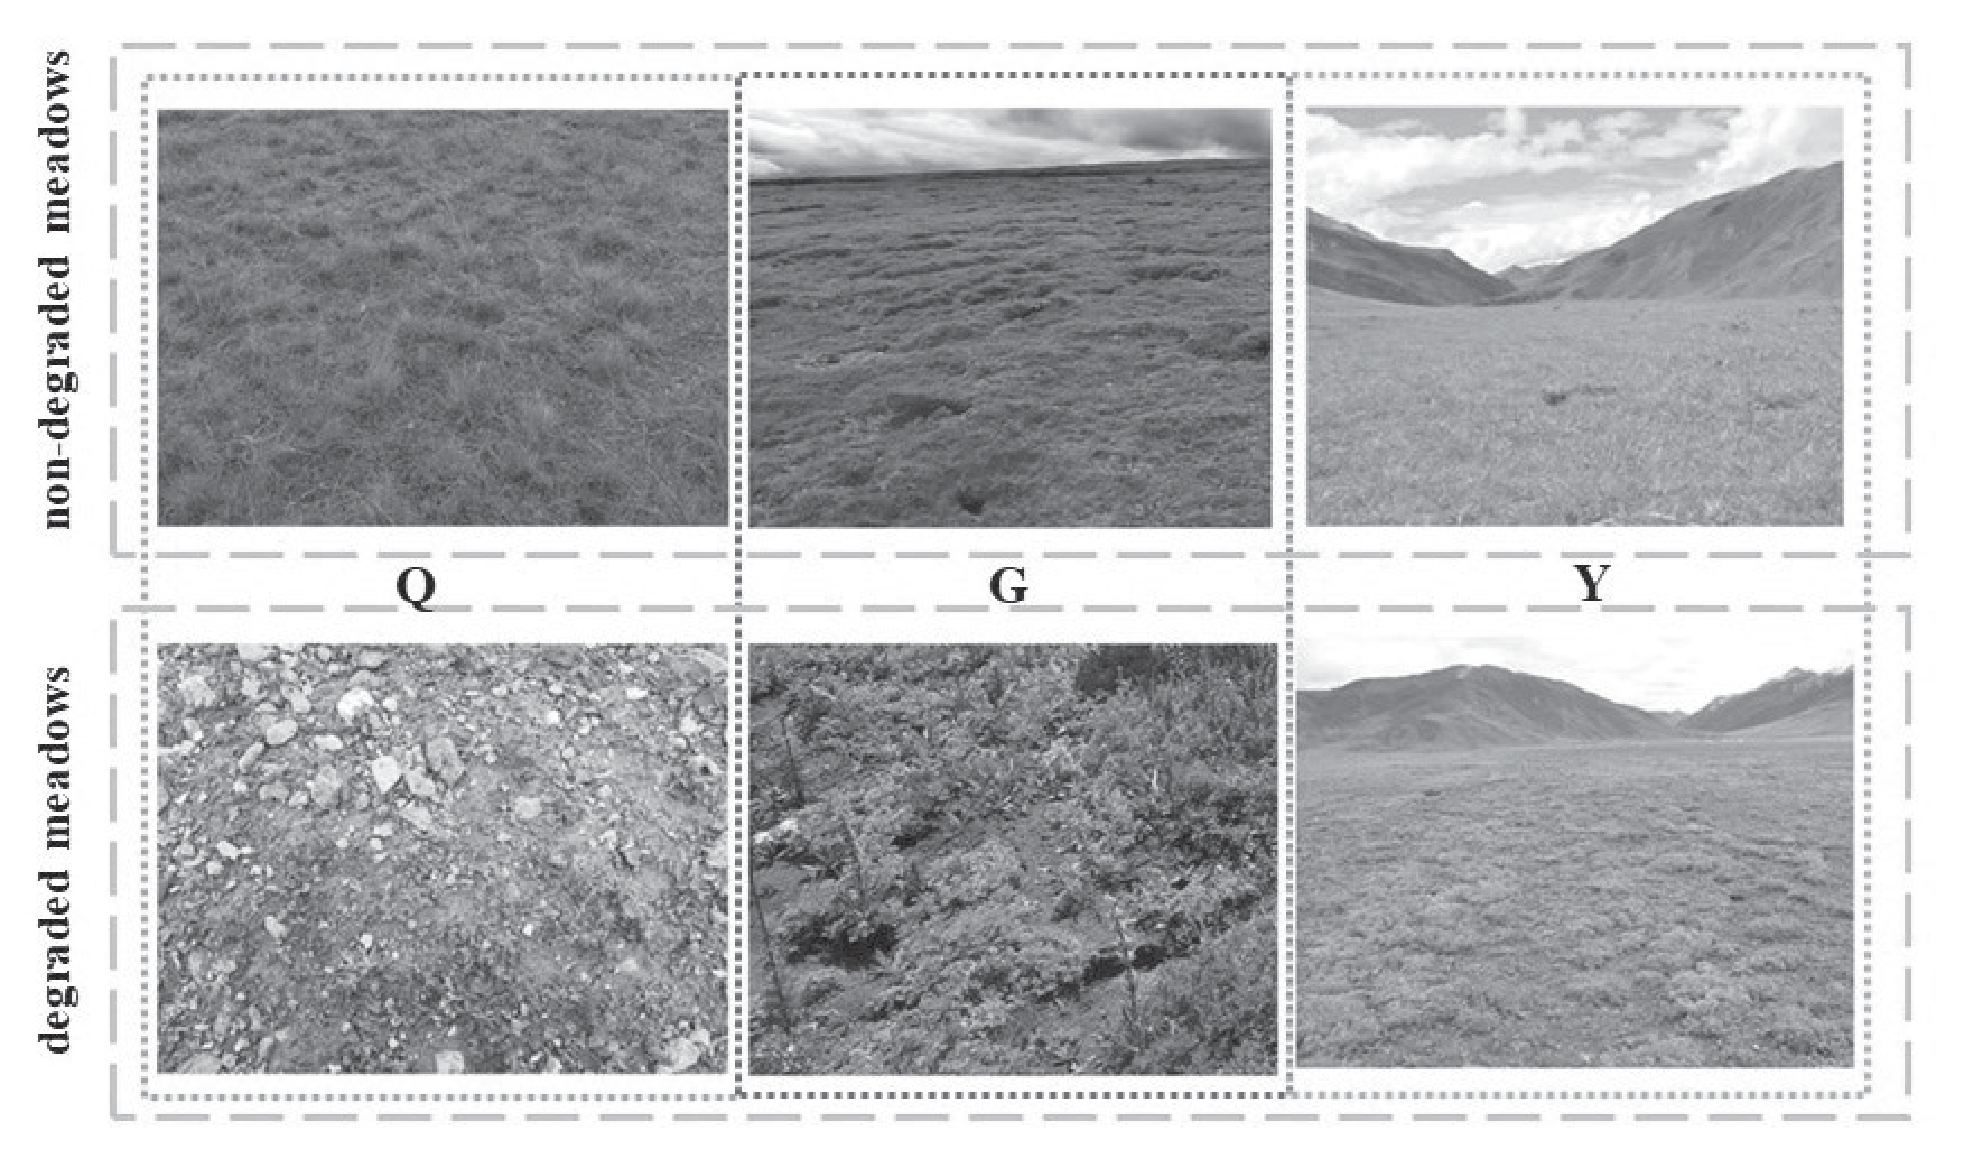
The research was conducted at three alpine meadow sites located in the Qinghai plateau: Haibei Tibetan Autonomous Prefecture, Guoluo Tibetan Autonomous Prefecture, and Yushu Tibetan Autonomous Prefecture. Following the classification system of Shang et al. [30], we identified extreme degradation and non-degradation based on plant coverage and the proportion of well-characterized palatable grasses (Fig. 1). All sites had a typical plateau continental climate. Precipitation and the forage growing period (156 days) generally occurred from May to September, as summarized in Table 1. The non-degraded meadows exhibited over 90% plant coverage and were predominantly populated by grasses and sedges. In contrast, the extremely degraded meadows had less than 30% plant coverage and were predominantly covered by forbs (Fig. 1). In this work, QND and QED refer to non-degraded meadows and extremely degraded meadows in Haibei Tibetan Autonomous Prefecture, respectively; GND and GED refer to non-degraded meadows and extremely degraded meadows in Guoluo Tibetan Autonomous Prefecture, respectively; and YND and YED refer to non-degraded meadows and extremely degraded meadows in Yushu Tibetan Autonomous Prefecture, respectively.
Fig. 1.
The photographs depict the extremely degraded and non-degraded situations of three different regions. The first tier shows the non-degraded scenes of these three places, while the second tier shows the extremely degraded scenes of the same three places. Q: Haibei Tibetan Autonomous Prefecture; G: Guoluo Tibetan Autonomous Prefecture; Y: Yushu Tibetan Autonomous Prefecture.
Experimental Design and Plant and Soil Sampling
In August 2021, we collected samples of plant communities and soil from 72 plots (10 m × 10 m) within both the extremely degraded and non-degraded meadows. In each of the three sites, four non-degraded fields and four extremely degraded fields were identified. These fields were randomly selected and separated by at least 20 km. In each field, three sampling plots were designated randomly, and the plots were separated from each other by 100 m. Overall, there were three sites, 24 fields, and 72 plots.
The vegetation community characteristics in one 50 cm × 50 cm quadrat, which was randomly selected, were investigated in each plot, and the aboveground plant biomass in the quadrats was determined. The total coverage of grassland vegetation and the coverage of each species, as well as the number and height of plants (from the surface to the top of the plant, based on measurements of ten plants of each species in each quadrat or measurements of all plants of species that numbered fewer than ten), were measured in each quadrat. Subsequently, the plants in each quadrat were cut just above the ground. The samples were transported to the laboratory, where they were promptly oven-dried at 65ºC for 48 h until they reached a constant weight for dry matter determination.
In each field, eight soil samples were randomly collected using the Snake sampling method, using a soil drill (10 cm deep) with a diameter of 3.5 cm. Subsequently, the samples were combined to obtain one composite sample. The samples were passed through a 2-mm sieve and placed in a cooler. Root biomass was collected using root augers with a diameter of 7 cm, and three root auger samples were mixed to obtain a composite sample for each field. Subsequently, the root and soil samples were transported to the laboratory within 24 h. The root samples were oven-dried at 65ºC for 48 h until they reached a constant weight for root mass determination. The soil samples measuring soil nutrient properties and enzyme activity were stored at 4ºC. Additionally, the soil samples intended for high-throughput gene sequencing in order to investigate the bacterial communities were stored at -80ºC.
Soil Physicochemical Properties
The dry combustion method measured soil organic carbon (SOC) using a C and N analyzer (vario El cube, Elementar, Langenselbold, Germany). Calibration of the results was assessed using a low organic carbon content soil-certified standard (1.55 g 100 g− 1 of C). The following procedure was used: about 100 mg of soil was weighed on a thin silver boat and pre-treated with HCl (10%) in order to remove inorganic carbon [31]. Measurements of microbial biomass carbon (MBC), nitrogen (MBN), and phosphorus (MBP) were conducted by chloroform fumigation with 0.5 M potassium sulfate as an extractant. The fumigation time was 24 hours. Total C in the extracts was measured using a TOC analyzer (vario El cube, Elementar, Langenselbold, Germany), and microbial biomass C was calculated using an extraction efficiency factor of 0.45 [32]. The soil’s total phosphorus (TP) was tested by alkali melting. The determination of available phosphorus (AP) was conducted by the sodium hydrogen carbonate solution-Mo-Sb anti-spectrophotometric method with an ultraviolet-visible spectrophotometer (SPECROD 210 PLUS, JENA, Germany). The flame photometric method was used to measure the total (TK) and available potassium (AK) after nitric acid extraction (Z-3300, Hitachi, Japan) [33]. Nitrogen content, comprising ammonium nitrogen (NH4-N) and nitrate nitrogen (NO3-N), was extracted with 1M KCl, and the filtrates were analyzed by colorimetric method analyzer (CleverChem200+, Germany) [34]. Soil total nitrogen (TN) was determined by the sulfuric acid and hydrogen peroxide digestion method. The soil water content (SWC) was determined after 48 h of oven drying at 105ºC until samples reached a constant weight. The air-dried soil sample to water ratio is 1:5 to measure soil pH. Soil urease (URE) activity was determined using the phenol-sodium hypochlorite colorimetric method [35]. The disodium phosphate colorimetric method assessed soil phosphatase (SPP) activity. The activity of soil sucrase (SSC) was analyzed utilizing the 3,5-dinitrosalicylic acid colorimetric method with an ultraviolet-visible spectrophotometer (SPECROD 210 PLUS, JENA, Germany).
Ecosystem Multifunctionality
Twenty-four variables were used to assess four ecosystem functions, including primary production (above- and below-ground biomass, coverage, and height), soil C cycling (organic carbon), soil nutrient cycling (total and available nitrogen, total and available phosphorus, and total and available potassium), and soil activity (microbial biomass carbon and sucrase, microbial biomass nitrogen and urease, microbial biomass phosphorus, and neutral phosphatase). These functions are part of the ecosystem support services associated with soil health and plant growth, which are fundamental to soil biogeochemical processes and ecosystem productivity [11, 24].
Table 1.
Main information of sampling sites.
The average approach and multi-threshold approach were used to evaluate the multifunctionality of ecosystems. The average approach comprehensively evaluates the collective impact of degradation on diverse ecosystem functions [25]. In this study, we employed three thresholds – low (25%), medium (50%), and high (75%) – to gauge the ecosystem’s capability to sustain these functions. Different thresholds can be selected for quantification depending on the purpose of the study. Thresholds of 25%, 50%, and 75% were selected to quantify different levels of ecosystem multifunctionality (Equation (1), taking 25% as an example). We normalized all variables by Z-Score Normalization. Calculating ecosystem multifunctionality using the mean method based on Z-scores (Equation (2)). The two measures, i.e., the mean and multi-threshold approaches, exhibited a strong correlation (r = 0.889, p<0.001). The consistency between the relationships of fungal network characteristics and multifunctionality, assessed using the two approaches, led us to primarily utilize the average multifunctionality index as a measure of ecosystem multifunctionality in the text to better reflect our results.
M25% is the ecosystem multifunctionality at the 25% threshold level, F is the number of ecosystem functions, fi is a parameter of ecosystem function i, ri is a mathematical function that converts fi to a positive value, and ti is the threshold of function i (i.e., the average of the five highest values of function I multiply by 25%). Mi denotes the ecosystem multifunctionality index of the ith sample site, N represents the total number of variables, xij denotes the measured value of the jth variable in the ith sample site, uj denotes the mean value of the jth variable, and ∂j denotes the standard deviation of the jth variable.
We conducted a one-way analysis of variance (ANOVA) to analyze the impact of degradation on individual functions and the ecosystem multifunctionality index. Subsequently, the LSD test was utilized to assess the differences between treatments, and p<0.05 was the threshold for statistical significance.
Bioinformatics Analysis
The soil fungal community was investigated via paired-end Illumina sequencing of ITS loci by Guangzhou Genedenovo Biological Technology Co. Ltd. (Guangzhou, China) with the Illumina 2500 MiSeq platform (Illumina, San Diego, CA, USA). Total genomic DNA was extracted from 0.5 g of soil using a HiPure Soil DNA Mini Kit (Magen, Guangzhou, China). ITS2 fragments were applied using the ITS3 (5′-GCATCGATGAAGAACGCAGC-3′) and ITS4 (5′-TCCTCCGCTTATTGATATGC-3′) primers with both primers extended with 12bp long sample-specific tags [36, 37]. FASTP was employed to filter readings from the raw data generated by the Illumina MiSeq platform [36]. PCRs were performed in a triplicate 50 μL mixture containing 5 μL of 10 × KOD buffer, 5 μL of 2 mM dNTPs, 3 μL of 25 mM MgSO4, 1.5 μL of each primer (10 μM), 1 μL of KOD polymerase, and 100 ng of template DNA. PCR was performed in a 50 μL mixture consisting of 5 μL of 10 × KOD buffer, 5 μL of 2 mM dNTPs, 3 μL of 25 mM MgSO4, 1.5 μL of each primer (10 μM), 1 μL of KOD polymerase, and 100 ng of template DNA. The PCR cycling program was 5 min at 94ºC and 30 cycles of 30 s at 94ºC, 30 s at 52ºC, 30 s at 72ºC, and 10 min at 72ºC. The quality of the PCR products was checked by 1% agarose gel electrophoresis. Aliquots of purified amplification products were mixed, added to the sequencing connector, and sequenced against the Illumina PE250 library. Reads were filtered from the raw dataset generated by the Illumina MiSeq platform using FASTP. FLASH was used to filter low-quality labels for clean labels. High-quality sequences were categorized into operational taxonomic units (OTUs) with 97% similarity, based on the UPARSE pipeline (version 9.2.64) [38], and the sequencing data were compared with the UNITE (ITS) database to obtain biological classification information. Observed OTUs (Sobs), Shannon–Wiener, Simpson, and Chao 1 indices were calculated at the OTU level. All sequencing data can be found at the National Center for Biotechnology Information (NCBI, Bethesda, MD, USA) under BioProject number PRJNA1168263 (https://www.ncbi. nlm.nih.gov/bioproject/PRJNA1168263).
Soil Fungal Network Construction
A network metamatrix was constructed using the normalized fungal OTU abundance table. We generated the metamatrix using the ‘SpiecEasi’ software package, which uses (Least Absolute Shrinkage and Selection Operator) LASSO regularization and cross-validation to detect the most plausible network structure in high-dimensional microbial data [39]. λ ratios were 0.01, with 50 λ values per 100 cross-validation permutations. Networks were evaluated to detect the least variable network links via the StARS selection criteria [40]. We categorized the networks into positive and negative co-occurrences to gain insight into inter-taxon associations caused by positive and negative interactions between species and/or similarities and differences in the ecological niches of fungal taxa [41]. For visualization, we created sub-network matrices from the network meta-matrices using the software package ‘igraph’ [42], retaining the OTUs found in all duplicate sites at each meadow level, and subsequently visualized these matrices using Gephi 0.9.2. We calculated the number of nodes, edges, positive correlations, negative correlations, and graph density and modularity for each network. The number of nodes, edges, modularity, and graph density are metrics for assessing the complexity of a network. Modularity is the strength of partitioning a network into densely connected compartments, or ‘modules’, of co-occurring species with relatively fewer associations between modules [43]. Graph density is the average number of associations per taxon [44, 45]. The higher the value of each metric, the more complex the network is [11].
Statistical Analyses
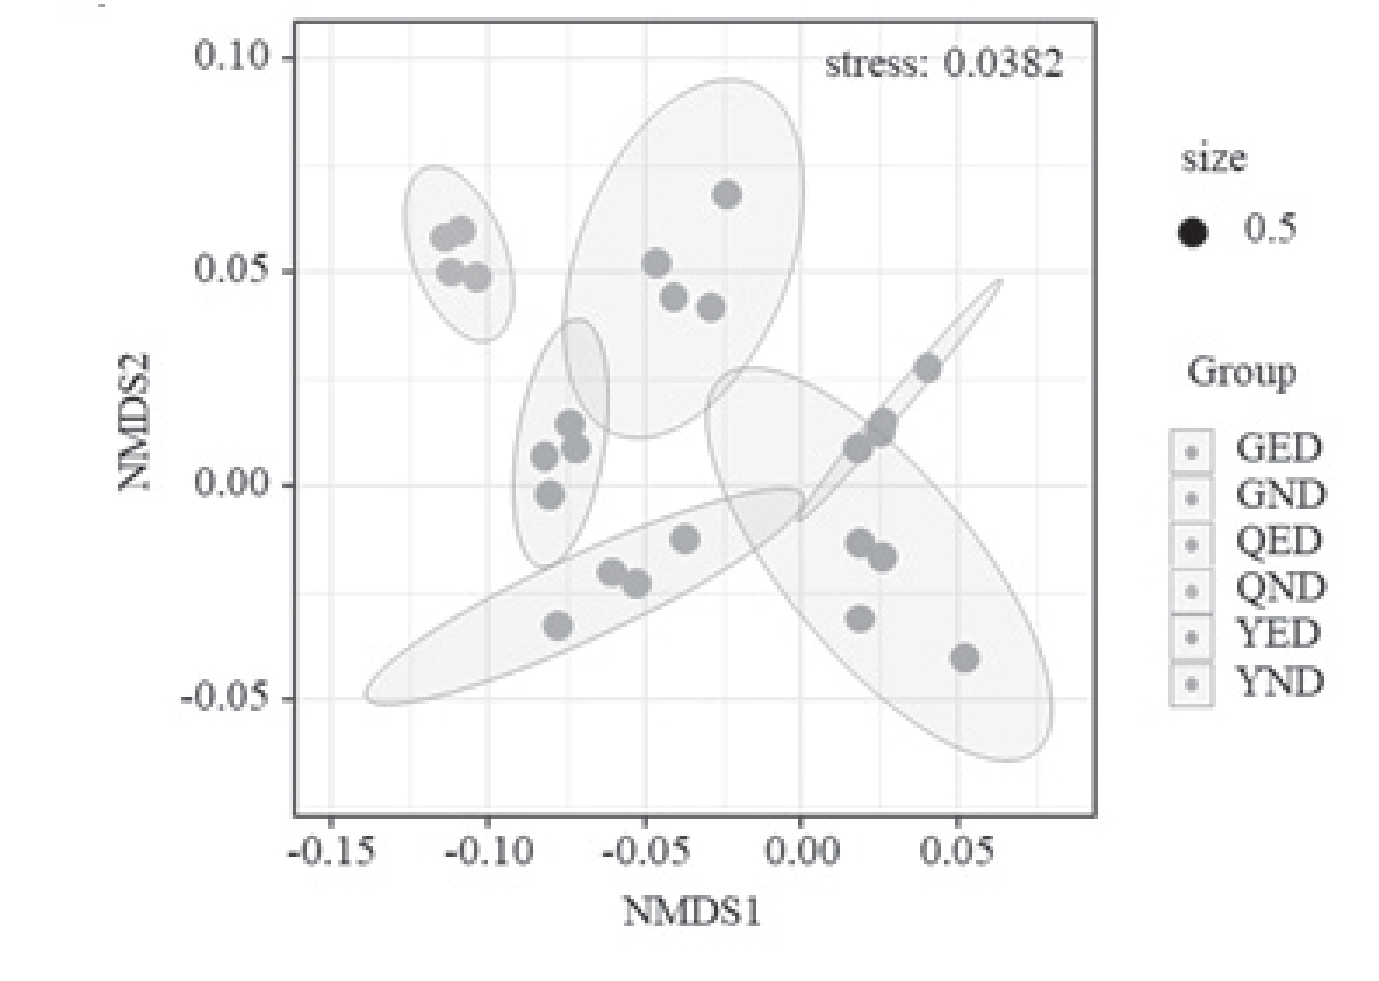
The Kolmogorov-Smirnov and Levene’s tests were used for normality and homogeneity of variance testing. Nonmetric multidimensional scaling (NMDS) was performed to visualize the fungal composition based on the Bray-Curtis distance. Through NMDS analysis (Fig. S1), we observed whether there were differences in fungal composition between extremely degraded and non-degraded grassland [11]. Then, we used ordinary least squares (OLS) regression to test whether the difference in ecosystem multifunctionality was related to differences in fungal network complexity between extremely degraded and non-degraded grasslands. First, we performed OLS regression to analyze the relationship between average multifunctionality and the characteristics of each fungal network [46]. Throughout the text, the reported results are consistently based on average multifunctionality. To analyze the influence of network characteristics on average multifunctionality while controlling for fungal richness, we regressed fungal richness on each network characteristic using linear regression and then added the residuals to the overall average of the respective network characteristics. Then, we conducted a second OLS regression between the average multifunctionality and the adjusted network characteristics. Finally, after correcting for the potential confounding factors, we tested the relationship between average multifunctionality and network characteristics. We utilized R software version 4.0.3 (http://www.r-project.org/) for all data analyses.
Results
Changes of Various Characteristics in Ecosystem Caused by Degradation
Response of Vegetation to Degradation
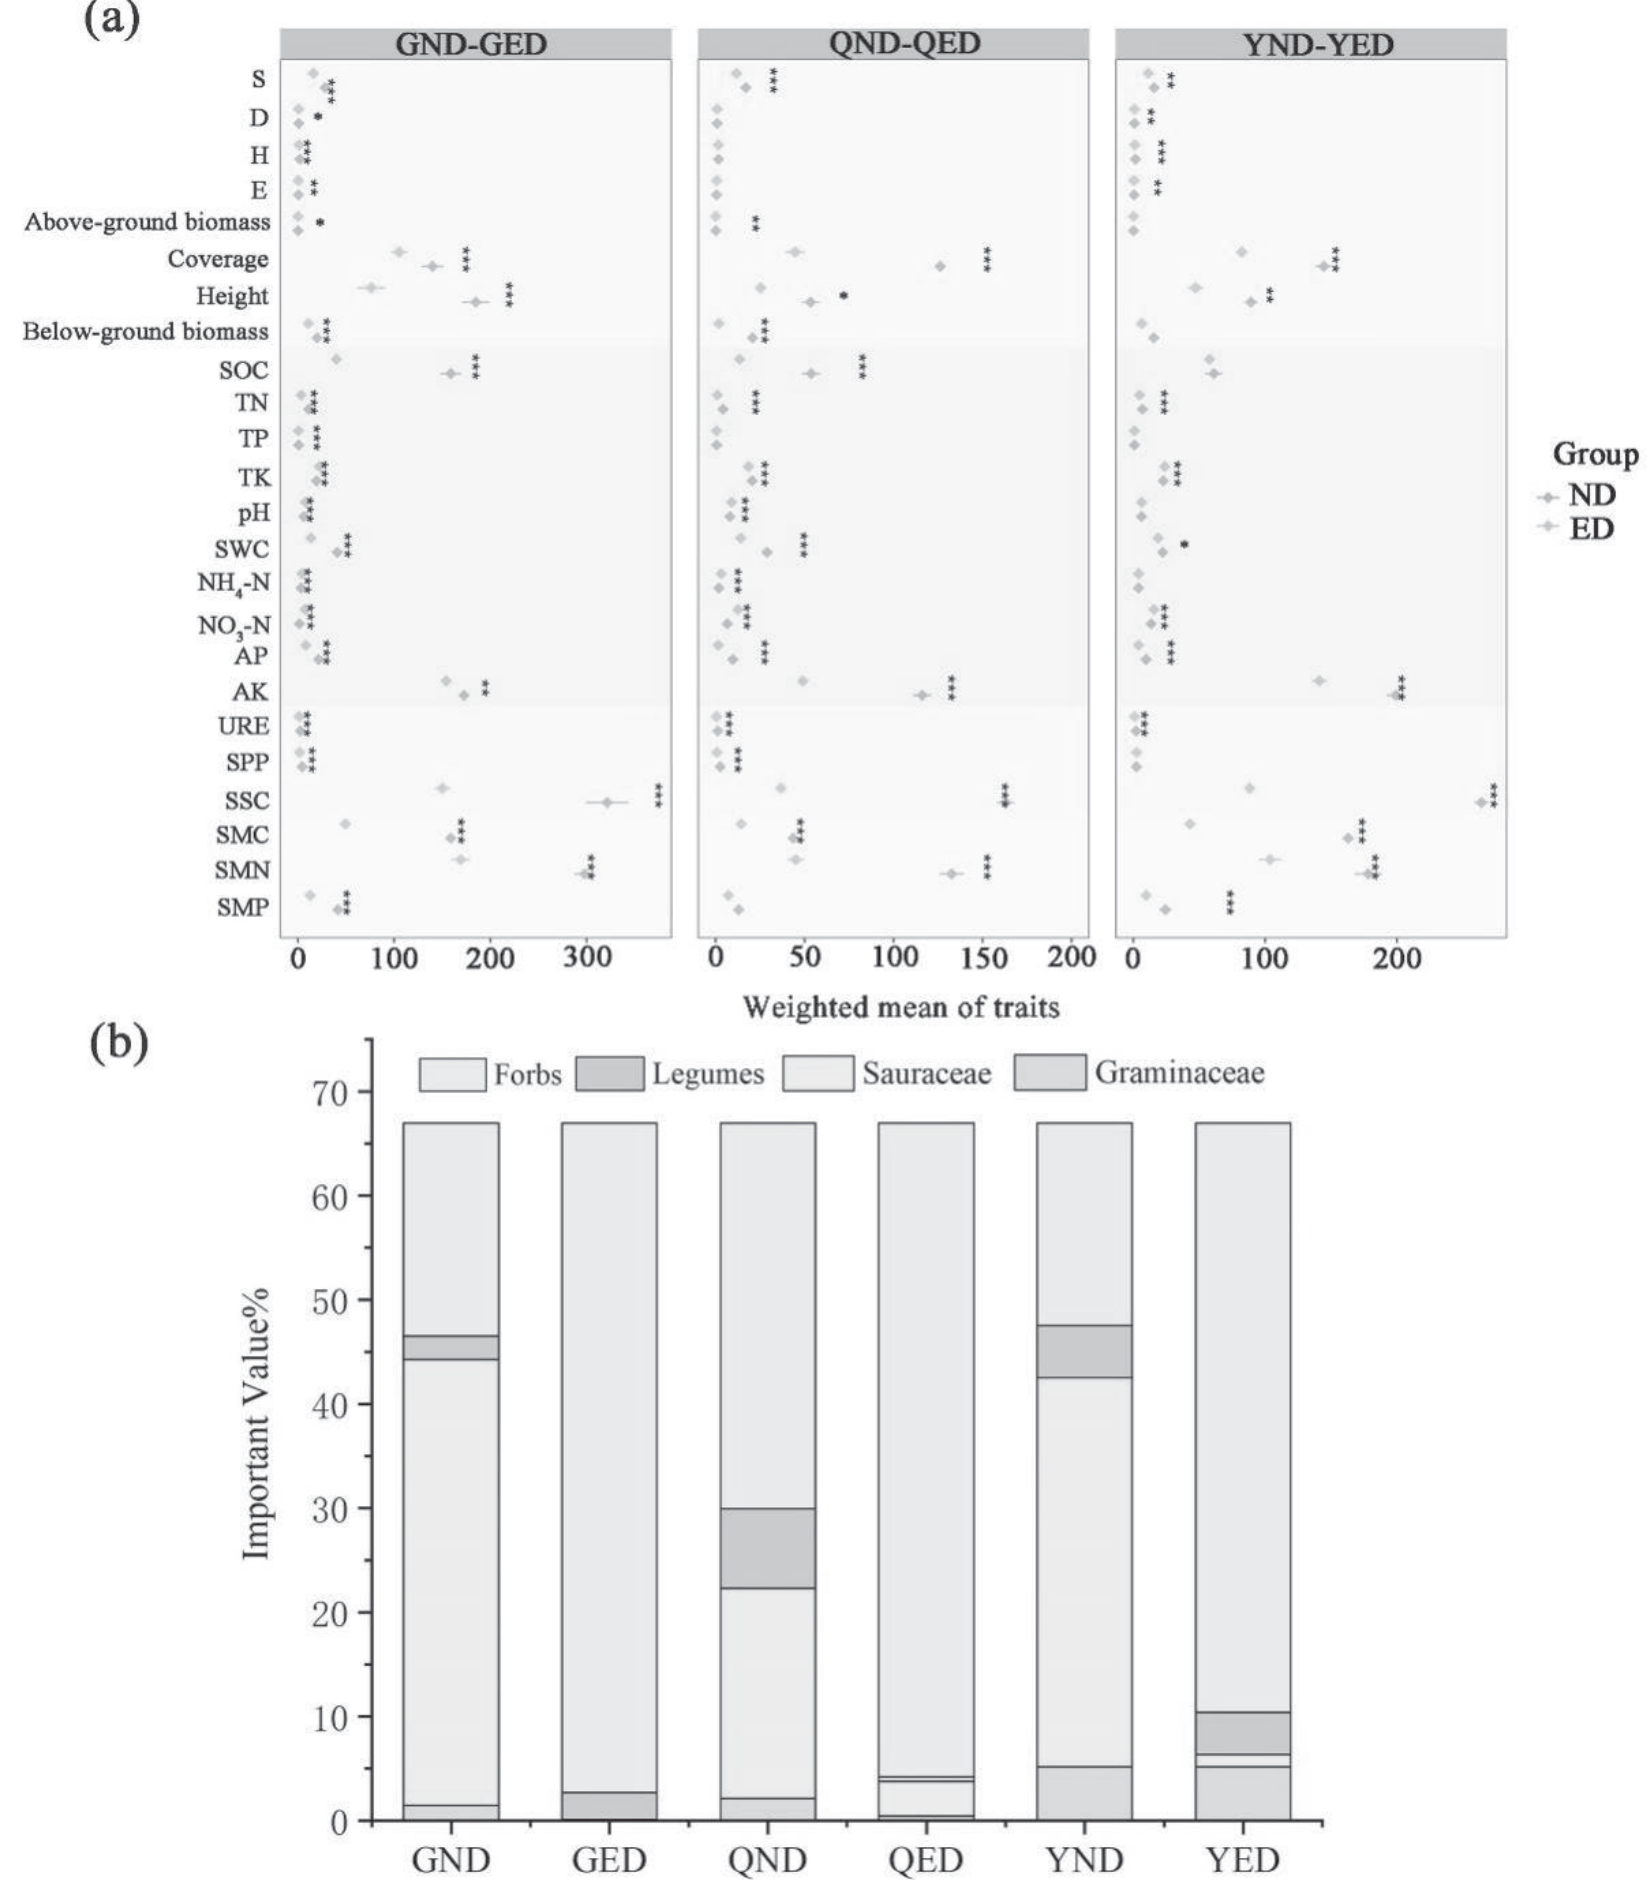
The values of variables describing most plant characteristics (e.g., biomass, height, and coverage) decreased significantly in the degradation process, while the richness and diversity of vegetation also decreased significantly accordingly (Fig. 2a). From the perspective of plant functional groups, the sharp decrease in sedge species and the significant increase in forb species were intuitively reflective of alpine meadow degradation (Fig. 2b). Specifically, vegetation richness and diversity in extreme degradation decreased by 28.6–42.5% and 19.5–35.4% compared with non-degradation. Compared with the above-ground biomass, the below-ground biomass decreased significantly, driven by grassland degradation. The vegetation coverage and height decreased by 24.8–64.6% and 27.3–40%, respectively, in extremely degraded meadows (Fig. 2). From this perspective, alpine meadow degradation changed the functional groups of plants, thereby reducing vegetation productivity.
Response of Soil Physical and Chemical Properties to Degradation
Compared with non-degraded meadow sites, the pH and contents of nitrate nitrogen, ammonium nitrogen, and TK in extremely degraded meadows increased significantly by 0.1–24%, 15.9–352%, 1–73.9%, and 5–15%, respectively. In contrast, the degradation was associated with decreased soil organic carbon, total nitrogen, total phosphorus, available phosphorus, and available potassium, among which available potassium decreased most significantly (10.7–57.8%). Overall, except for phosphorus nutrients, the total nutrients of soil nitrogen and potassium and the available nutrients of soil nitrogen and potassium exhibited trends opposite to those of non-degraded to extremely degraded alpine meadows (Fig. 2).
Response of Soil Microbial Biomass and Enzymes to Degradation
Soil microbial biomass carbon, nitrogen, and phosphorus all showed a downward trend associated with alpine meadow degradation, among which microbial biomass carbon decreased the most by 67–73.6%; microbial biomass nitrogen decreased second most by 41.8–66%. Similarly, the activities of the three enzymes decreased significantly during the degradation process, among which sucrase decreased the most by 53.2–77.5% (Fig. 2).
Ecosystem Multifunctionality
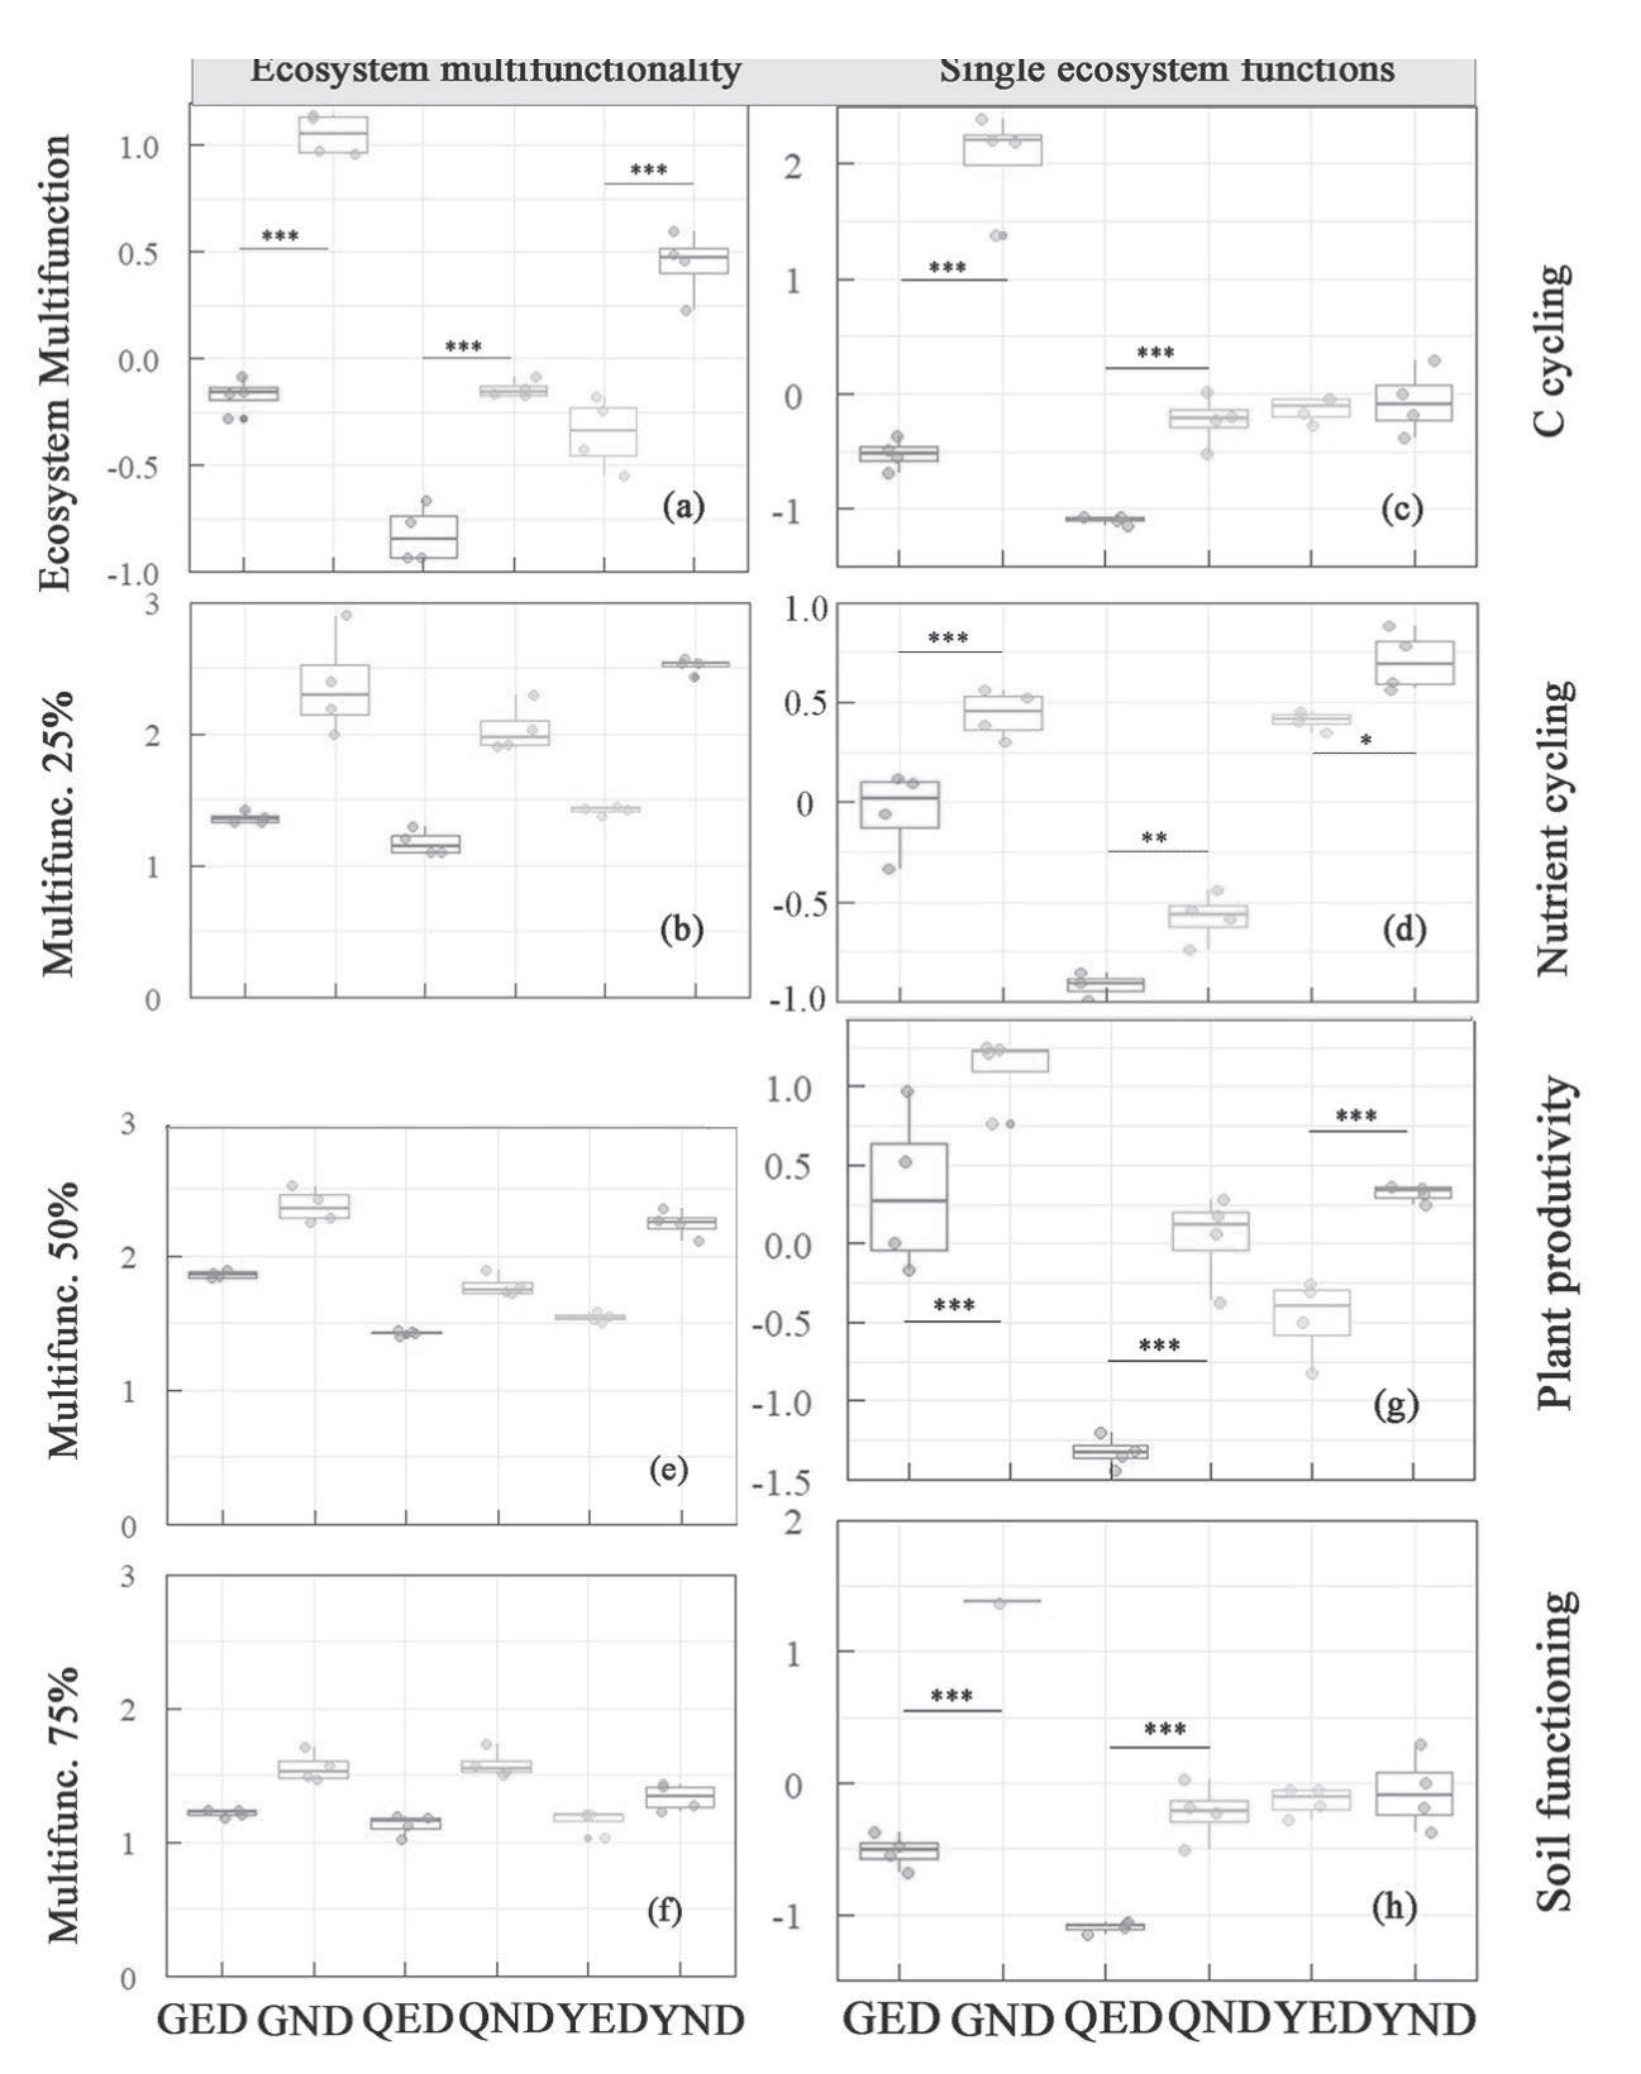
We observed a significant decrease in ecosystem multifunctionality corresponding to grassland degradation. Our results were consistent regardless of the average multifunctionality or multi-threshold multifunctionality (Fig. 3a, b, e, f). The results of the average approach (-0.45 to +0.45) and threshold approach showed that the ecosystem multifunctionality of extremely degraded alpine meadows was significantly lower than that of non-degraded alpine meadows. From a single function perspective, the plant productivity of extremely degraded vegetation (-0.49) was significantly lower than that of non-degraded alpine meadow (+0.51) (Fig. 3g), and the nutrient cycling ability was greatly reduced in extremely degraded meadow plots (Fig. 3d). Except for Yushu, other regions’ carbon cycling and soil activity were significantly lower in extremely degraded meadows (Fig. 3c, h).
Fig. 2.
a) Weighted average value of each character. One-way ANOVA was used to determine the effects of degradation in each site. b) Important values of different functional groups of vegetation. Significance: *, P<0.05; **, P<0.01; and ***, P<0.001 according to the LSD test. S, Plant species richness index; D, Simpson dominance index of plants; H, Shannon-Wiener diversity index of plants; E, Plant Pielou evenness index; Height, average height; Above-ground biomass, above-ground vegetation weight; Below-ground biomass, below-ground root weight; Cover, the sum of coverage for each species; SOC, Soil Organic Carbon; TN, Total Nitrogen; TP, Total Phosphorus; TK, Total Potassium; SWC, Soil Water Content; NH4-N, ammonium nitrogen; NO3-N, nitrate nitrogen; AP, available phosphorus; AK, available potassium; URE, urease; SPP, neutral phosphatase; SSC, sucrase; SMC, microbial biomass carbon; SMN, microbial biomass nitrogen; SMP, microbial biomass phosphorus.
Changes in Soil Fungal Composition and Diversity
In all three locations, compared with non-degradation, there was a consistent increase in the relative abundance of Ascomycota, Mucoromycota, Chytridiomycota, and Glomeromycota in extreme degradation, with the latter three phyla reaching statistically significant levels of increased abundance (Fig. 4a, Table 2). Except in Yushu, the relative abundance of Basidiomycota decreased significantly in extremely degraded meadow sites. However, the diversity of soil fungi was significantly reduced in extremely degraded meadows (16–26%) (Fig. 4b), and except for Haibei, Sobs, and Chao1, indices increased significantly in extreme degradation (Table 3). In addition, there was regional variability in the alterations resulting from grassland degradation. In the extremely degraded meadows in Guoluo, there was a significant decrease in the abundance of Mortierellomycota, while the abundance of Neocallimastigomycota increased notably. In Haibei, Basidiomycota showed significant enrichment in extremely degraded grasslands, whereas Ascomycota demonstrated a marked decrease at such sites. In contrast, Yushu did not exhibit substantial differences in the relative abundance of different taxa.
Complexity of Soil Fungal Networks
In addition to the linkage density, the network characteristics of modularity, nodes, and edges showed consistent decreases with grassland degradation. Thus, the complexity of fungal networks declined from non-degraded to extremely degraded meadow sites (Fig. 5(a-e)). Importantly, even after controlling for the influence of fungal richness, grassland degradation expounded a statistically significant part of the difference in fungal network characteristics (Table 4), indicating that grassland degradation significantly influenced fungal co-occurrence patterns. Notably, the proportion of positively correlated networks at all sites exceeded 90%. Moreover, the proportion of negatively correlated networks in extremely degraded meadows was consistently higher than in non-degraded meadows (Fig. 5a).
Table 2.
The relative abundance changes of classified fungi at the phylum level in extremely degraded and non-degraded meadows in three different locations.
Fig. 4.
Community composition of soil fungi at the class level a) as affected by degradation and Shannon diversity of soil fungi b). Significance: *, P<0.05, P<0.05; **, P<0.01; and ***, P<0.001 according to the LSD test.
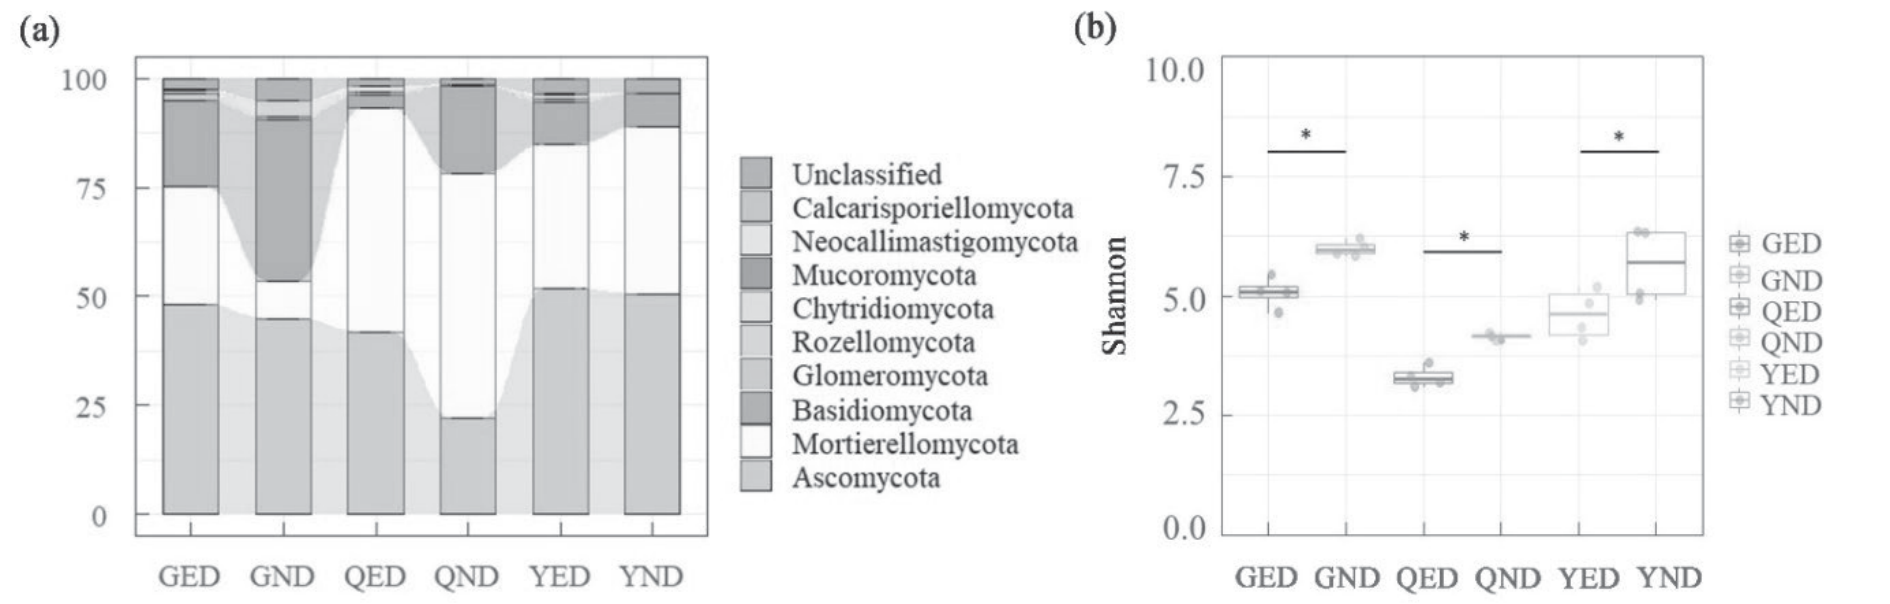
Table 3.
Microbial Diversity Index of Extremely Degraded and Non-degraded Meadows in Three Different Locations.
The Relationship Between Ecosystem Multifunctionality and the Complexity of Soil Fungal Networks
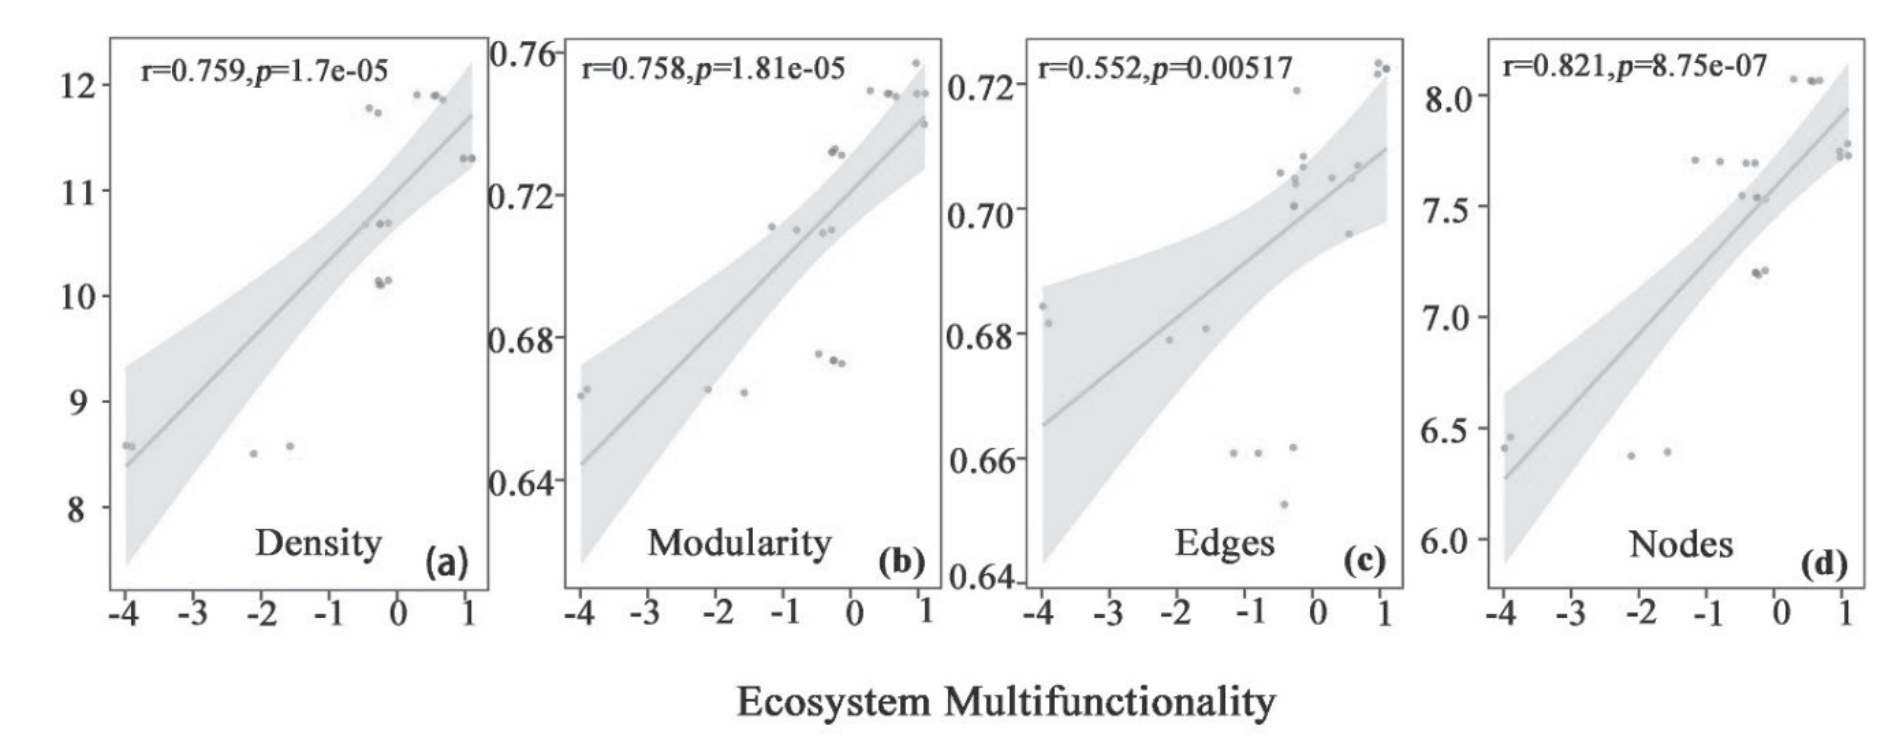
After linear fitting, we found that ecosystem multifunctionality was positively correlated with the linkage density and modularity, as well as the number of edges and nodes in the fungal networks (p<0.01) (Fig. 6). Additionally, the relationship between multi-threshold multifunctionality and fungal network characteristics was consistent with the average multifunctionality. Thus, the decline in multifunctionality was related to the simultaneous decline of fungal network complexity, which was manifested in the reduction of linkage density (r = 0.759, p<0.001), modularity (r = 0.758, p<0.001), edge number (r = 0.821, p<0.001), and node number (r = 0.552, p<0.001) in extreme degradation. Therefore, reductions in fungal network complexity associated with grassland degradation reduced the multifunctionality of ecosystems.
Discussion
Degeneration of Alpine Meadows Reduces the Complexity of Fungal Networks
Our hypothesis that alpine grassland degradation reduces the network complexity of the soil fungal community was confirmed. The degradation of grasslands and associated environmental changes acted as potent filters for the existing microbial species [4, 47]. Grasslands can be degraded by various external disturbances, leading to changes in the relative abundance of taxa comprising fungal communities and their interactions [4, 5, 18]. Microbial networks are influenced by various factors, including resource availability [48], herbivore grazing pressure [49], and abiotic environmental factors, such as soil temperature and moisture [4, 28]. Some studies have shown that limited soil moisture and nutrients can reduce the density and modularity of soil microbial networks [28]. Additionally, as grassland degradation diminishes the modularity of fungal networks, fungal taxa can become less integrated into modules [6, 11]. This is consistent with previous research conducted in alpine grasslands, which showed that habitat destruction could homogenize species interaction networks and simplify natural communities [45]. At the same time, other studies have shown that interspecific interactions can increase the network density of microorganisms [13]. This could explain why the density of fungal networks in extremely degraded grasslands with low species diversity was lower than in non-degraded grasslands. In our study, the water content and most nutrient levels in extremely degraded grasslands were lower than those in the non-degraded grasslands (Fig. 1a). Additionally, the significant reduction in below-ground biomass indicated a decrease in organic carbon input, which might directly lead to a reduction in the modularity of the soil fungal network and a subsequent decrease in the complexity of the soil fungal network [4, 12]. This can further explain the significant reduction in soil enzyme activity and microbial biomass in extremely degraded grasslands. The complexity of the microbial network in the soil was reduced in degraded grasslands, leading to a greatly weakened capability for information and energy substance exchange [8, 17]. Various enzyme activities of microorganisms were not as high as those in the non-degraded grassland, resulting in a significant decrease in the utilization of soil organic matter [48].
Table 4.
Summary of general linear model (GLM) results.
| Network characteristics | df | %SS | F | P |
|---|---|---|---|---|
| Linkage density | 5 | 32.16 | 8.68 | <0.001 |
| Edges | 5 | 12.77 | 4.89 | 0.022 |
| Modularity | 5 | 10.67 | 3.97 | 0.003 |
| Nodes | 5 | 18.46 | 5.66 | 0.035 |
Fig. 5.
Effect of degradation on the co-occurrence network of fungal communities. The size of each node is proportional to the number of connections (i.e., degree). The nodes are colored according to phyla. Nodes and edges, the number of nodes and edges, respectively; Density, graphic density; Modularity, network modularity. P and N, the percentage of the positive and negative correlations, respectively.
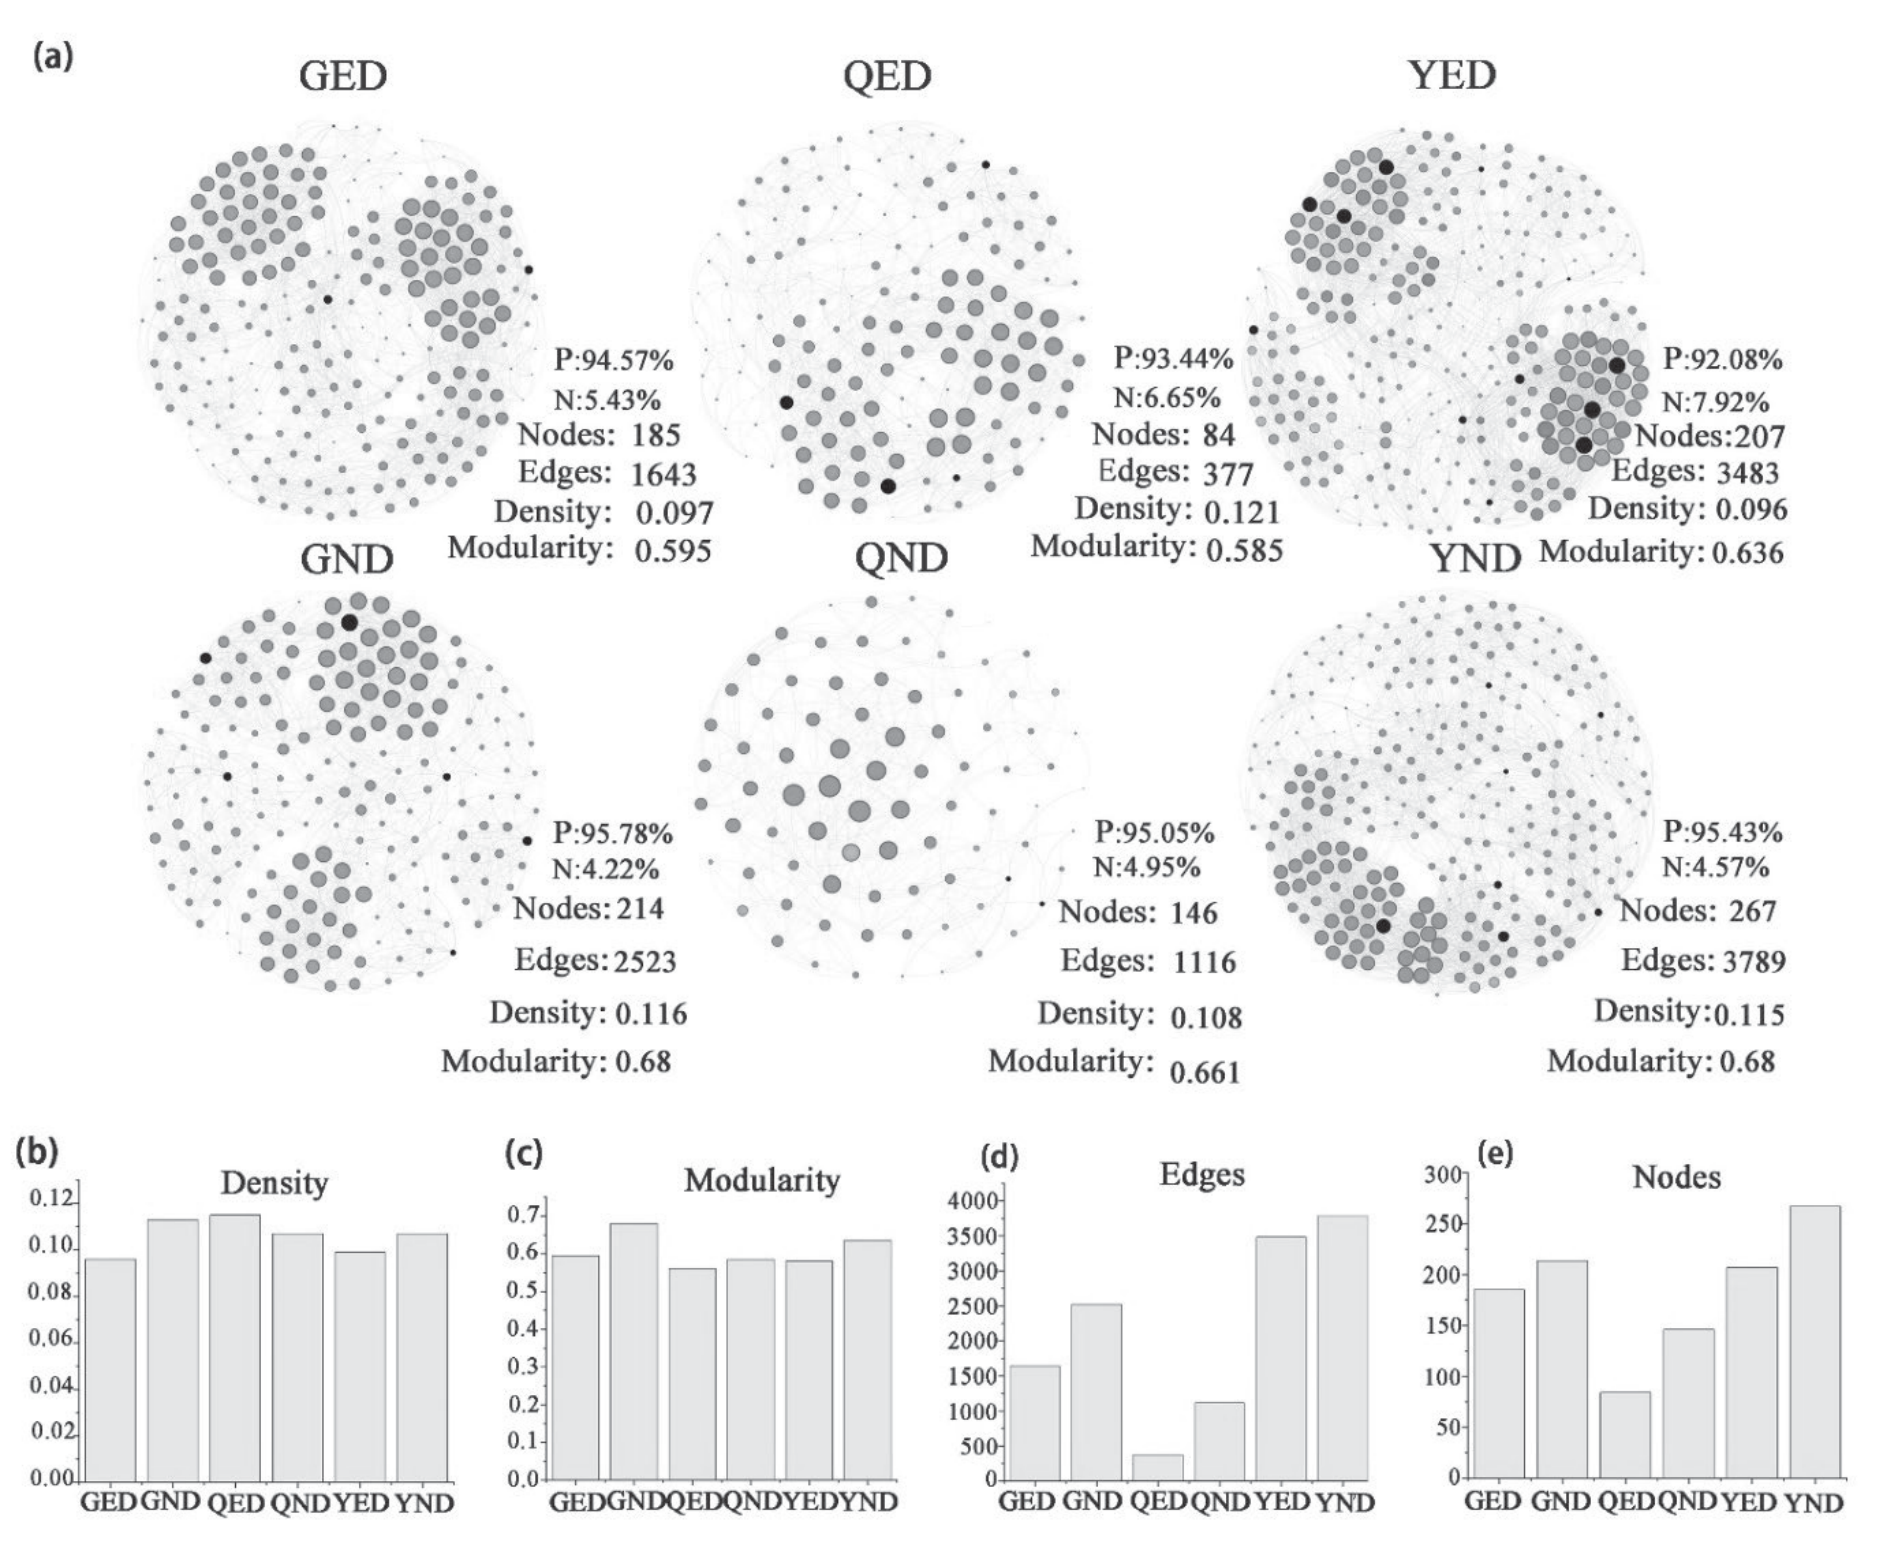
Notably, the percentage of positively associated fungal groups in the degraded and non-degraded meadows was much higher than that of negatively associated groups. That is, the positive microbial interactions in the soil microbial community tended to increase with the pressure gradient, consistent with the prediction of the pressure gradient hypothesis [8, 50]. Meanwhile, negative associations between taxa may suggest that the taxa respond asynchronously to environmental disturbances, a dynamic demonstrated to stabilize ecosystem functions [26]. Therefore, the complexity of the fungal network generated by the associations of negatively correlated taxa may buffer the impact of external disturbances (such as overgrazing) on fungal communities, resulting in lower stability of the fungal community composition in extremely degraded meadows compared to non-degraded meadows [51].
On the other hand, a reduction in the complexity of a fungal network can also occur through alterations in the composition of the fungal community [26]. There were significant differences in the composition of the fungal community between degraded and non-degraded meadows in our study (Fig. S1) (PERMANOVA, F = 4.36, p = 0.03). Grassland degradation reduced fungal diversity and increased the abundance of some pathogens (such as various Ascomycota, Mucoromycota, and Chytridiomycota species). The increased dominance of these pathogens, in turn, reduced the overall fungal diversity [5, 14] while also increasing the likelihood of disease in aboveground plants, further promoting the degradation of grassland [12]. The majority of key taxonomic groups consist of dominant microorganisms from the phyla Mortierellomycota and Basidiomycota (Fig. 2a), and these microorganisms are crucial for forming network structures in previous studies [33, 35].
Degradation of Alpine Meadows Reduces the Multifunctionality of Ecosystems
The present results suggested that the degradation of alpine grasslands significantly reduced various ecological functions. Previous studies have indicated that the multifunctionality of ecosystems averages all ecological functions, which may distort or oversimplify some key ecological functions and processes [12, 25]. However, our study found a high correlation between ecosystem multifunctionality and the multi-threshold multifunctionality index (r = 0.873, p<0.001), indicating that a more comprehensive understanding can be gained by analyzing individual ecosystem functions and multifunctionality indices. For example, the vegetation community structure has important impacts on productivity, carbon sequestration, nutrient cycling, and soil activity [48, 17-19]. In our experiment, compared to non-degraded grassland, the extreme degradation of grassland reduced both above-ground and below-ground biomass. This result may have led to an increase in the area of exposed soil surface, and the increased evaporation of soil moisture has been shown to significantly reduce the soil water content in extremely degraded meadows [4]. Moreover, the decline in below-ground root systems resulted in decreased root exudate content, potentially impacting the efficacy of soil nutrients and further influencing soil microbial composition and ecosystem multifunctionality [9, 48]. Notably, in nutrient cycling, ammonium nitrogen and nitrate nitrogen levels were significantly elevated in extremely degraded areas. This enrichment may be associated with plant preferences in nutrient uptake and utilization [52]. Additionally, the mineralization rate of soil organic nitrogen was greater in extremely degraded grasslands than in non-degraded grasslands, leading to increased ammonium nitrogen levels [15]. Under dry conditions, ammonium nitrogen is predisposed to conversion into nitrate nitrogen [14]. In short, increases in available nitrogen levels may exacerbate nitrogen leaching, leading to soil degradation.
Additionally, the composition and abundance of fungal microorganisms do have an impact on carbon cycling, soil functions, and nutrient cycling within an ecosystem [8, 20, 48]. In extremely degraded meadows, there was an increase in the abundance of specific pathogenic fungi. Their unique physiological characteristics likely enabled them to adapt to external disturbances, i.e., particularly high grazing pressure, by employing diverse ecological strategies, thus contributing to stabilizing the fungal community [11, 33]. Previous research has demonstrated that saprotrophic fungi serve as a critical functional group in decomposing organic matter [53]. Community abundance also plays a crucial role in regulating soil nutrient conditions owing to its close association with nutrient cycling [54].
Decline of Fungal Network Complexity Reduced Ecosystem Multifunctionality
The exact regulatory mechanism underlying how the complexity of microbial networks influences ecosystem functions remains unresolved [55]. Linear regression analysis showed a significant positive correlation between fungal diversity and ecosystem multifunctionality (Fig. 6). Fungal diversity and network complexity were significantly reduced in extremely degraded meadows. It has been shown that less complex fungal communities are less stable in composition [33]. A low frequency of negative associations between taxonomic groups can indicate poor stability of the microbial community composition [11], resulting in a decrease in ecosystem functionality, as the negative associations between taxonomic groups may offset each other and dampen disturbances [26]. The multifunctionality of the ecosystem decreased with declines in connectivity, number of nodes, number of edges, and modularity. Other studies have indicated that the multifunctionality of ecosystems was also linked to potential variation in soil abiotic properties and other organisms, including plants, soil, animals, and microorganisms [11]. The abiotic properties of soil and its biological components can impact ecosystem multifunctionality through interactions with soil fungi [12, 14]. Despite these potential indirect impacts, the intricate complexity of soil fungal networks remains an important influence on the variability of ecosystem multifunctionality [25]. The present findings suggest that amid the degradation of grasslands under climate warming and overgrazing, it is crucial to deliberate on appropriate grassland utilization and management measures [9, 56]. In particular, attention should be paid to the role of fluctuating dynamics of soil microbial communities’ network characteristics in decelerating or regulating the succession process of grasslands towards extreme degradation and maintaining the ecosystem multifunctionality of alpine meadows.
Conclusions
Our results indicated that in the Qinghai Plateau, the transition from non-degraded to extremely degraded alpine meadows altered the composition of soil fungi and reduced fungal diversity. Co-occurrence network analysis revealed that the higher the degradation degree of the alpine meadows, the lower the complexity of the fungal network, including an increase in the abundance of saprophytic fungi. Furthermore, in extremely degraded meadows, soil nutrient loss resulted in reduced microbial enzyme activity and biomass. Additionally, linear regression analysis demonstrated that a reduction in soil fungal network complexity resulted in decreased ecosystem multifunctionality, serving as the primary cause for the decline in ecosystem multifunctionality owing to degradation intensification. Our study, along with previous relevant research, did not offer direct evidence of the ecological causality linking grassland degradation, changes in soil fungal community network characteristics, and ecosystem functions. However, our findings indicate that grassland degradation may diminish the complexity of soil fungal communities and the ecosystem’s multifunctionality, which could inform the management of other ecosystems confronting degradation threats owing to the ubiquity of microbial networks. In the future, when managing and utilizing degraded alpine meadows, it will be important to focus on the network characteristics of soil microorganisms to maintain a higher level of ecosystem multifunctionality. We suggest restoring the complexity of soil microbial communities may be the foundation and prerequisite for restoring grassland ecosystem functions.