

Introduction
A dust storm, also known as a sandstorm, is a common meteorological hazard in arid regions worldwide. Asian dust storms (ADSs) often originate from desert and loess areas in Mongolia and China and follow westerly winds that move towards the east, affecting the east coast cities of China, Korea, Taiwan, Japan, and other neighboring areas [1]. Dust storms severely affect air quality and increase the concentration of particulate matter 2.5 (PM2.5), which refers to fine inhalable particles with aerodynamic diameters smaller than 2.5 µm [2]. Long-term exposure to the increased concentration of PM2.5 floating in the air is closely associated with increased hospital admissions, a higher mortality rate in the susceptible population, and the risk of a variety of diseases, such as respiratory, cardiovascular, and ischemic heart diseases [3-5]. PM could be from outdoor dust, industrial, and vehicle exhausts associated with lung cancer; PM has even been identified as a Group 1 carcinogen to humans by the International Agency for Research on Cancer (IARC) [6]. Mineral dust is a major PM component and accounts for a large component of PM2.5 [7, 8]. Analysis of the Asian dust storms showed that their inhalable mineral dust has a diameter between 10 nm and 40 µm [2, 8]. Due to a greater surface-area-to-volume ratio and high toxin-absorption ability, the mineral dust may absorb transitional metallic compounds and polycyclic aromatic hydrocarbons [9], penetrate through the mucous membranes of the skin barrier, respiratory system, and digestive system, and deliver its contents to the biological fluid and blood via macrophage-mediated endocytosis and internalization [10, 11]. Studies also showed that PM2.5 exposure caused remarkably lower phagocytosis rates and phagocytic index, as well as massive DNA damage in rats [12]. Hu et al. treated male rats with dust storm PM2.5, either dissolved in polar (saline) or non-polar (dimethyl sulfoxide) solvents, and showed dose-dependent increases in mitochondrial reactive oxygen species (ROS) formation, mitochondrial swelling, and mitochondrial membrane potential collapse [13]. After being treated with PM2.5 suspension once a week for three months in rats, metabolome alterations were observed with a significant increase in oxidative stress; nineteen metabolites decreased and 31 metabolites increased, all of which are involved in lipid and nucleotide metabolism [14]. In essence, the associations between increased incidence of respiratory diseases, lung cancer, or other lesions and exposure to PM have been confirmed by much evidence. Physical and chemical characteristics of particles, such as transition metal content, size, stable free radicals, speciation, etc.), are involved in various mechanisms leading to oxidative stress and inflammation with high DNA damage. However, current research on dust storm PM2.5 is mainly focused on either the organic component or the metal ion component of PM2.5, and research on the toxic effects of individual components constituting the mineral dust has been scarce [14]. In this study, we collected a sand sample from Wuwei City’s Dajing Town, which is located on the border of the Tengger Desert and has a high incidence of dust storms, and prepared mineral dust PM2.5 particles via ball milling. The size, morphology, and dispersion of the prepared mineral dust particles were characterized. To investigate the toxicity of mineral dust on health effects and its underlying molecular mechanisms, mineral dust PM2.5 was administered to rats via inhalation. The transaminase levels, T-cell subtypes, inflammatory response, oxidative stress, and histopathological changes were analyzed.
Materials and Methods
Reagents and Instruments
The instruments used in this study included the following: 402AI Medical Atomizer (Yuyue Medical Instruments, Jiangsu, China), Plexiglass container (Jumei Plexiglass Factory, Guangzhou, China), FACScan Flow Cytometer (Becton–Dickinson, Bedford, MA, USA), QM-ISPZ-CL Planetary Ball Mill (Nanjing Nanda Instrument Plant, Nanjing, China), TX2000 Total Reflection X-Ray Fluorescence (TRXRF) Spectrometer (Leeman, Beijing, China), S-4800 Scanning Electron Microscope (Hitachi, Japan), Heraeus Biofuge Stratos High-Speed Benchtop Centrifuge (Thermo Scientific, USA), HF-800A Biomedical Analyzer (Hailifu Brand Management Group, Shandong), Synergy H1 Multi-Mode Microplate Reader (BioTek, VT, USA), BSA- 224S-CW Electronic Balance (Sartorius, German), ST5020 Multistainer (Leica, German), and CX22 Binocular LED-Sample Microscope (Olympus, Japan). The reagents used in this study included the following: Rat T-cell Isolation Kit (MultiSciences (Lianke) Biotech, Hangzhou), ROS Detection Kit, and cytokine detection ELISA kits for interleukin (IL)-6 and tumor necrosis factor (TNF)-α (BIOSAMITE, Shanghai, China).
Experimental Animals
Sixty specific pathogen-free male Wistar rats with body weights ranging from 180-200 g were purchased from Gansu Chinese Medical University Laboratory Animal Research Center [license: SCXK (Gan) 2011- 0001, Affidavit of Approval of Animal; XBMU-YX-2019007]. The animals were maintained at the Clean Animal Facility, Northwest University for Nationalities College of Medicine, with a controlled temperature (20- 22°C), humidity (45-55%), and a 12 h dark/light cycle.
Preparation of Mineral Dust
The sampling site was located in Dajing Town, Wuwei City (103°43’78’’E, 37°49’44’’N), Gansu Province, China. To prepare the PM2.5 mineral dust, the starting mineral sample was dispersed in N, N-dimethylformamide (DMF) solvent, added into a QM-ISPZ-CL planetary ball mill at a 20:1 ball-to-material ratio, and then milled continuously for 18 h at a rotating speed of 500 rpm [15].
Scanning Electron Microscope Analysis of the Morphology and Size of Mineral Dust
The prepared mineral dust was evenly dispersed in saline to a final concentration of 500 μg/mL. The suspension was added onto the copper mesh grid, dried at 50°C, and then observed under the scanning electron microscope to characterize the size, shape, and dispersion of the mineral dust.
XRD Analysis of Mineral Particulate Matter
The chemical composition of the mineral dust was analyzed using X-ray diffraction spectra (XRD). The chemical composition of the mineral dust was retrieved and decoded semi-quantitatively from the X-ray diffraction patterns using MDI Jade 5.0 software.
Animal Groups and Exposure Protocol
The rats were randomly divided into 5 groups (n = 12): blank control, saline control, and treated with mineral dust at 2 mg/kg b.w. (body weight), 5 mg/ kg b.w., or 10 mg/kg b.w. The air quality guideline for PM2.5 from the World Health Organization (WHO) stipulates that PM2.5 should not exceed a 25 µg/m3 24- hour mean [16]. The mass concentrations of the mineral dust used in this study were approximately 100-, 200-, and 500-fold of this 24 h mean [17]. The mineral dust aerosol was administered using nebulizer inhalation. The dose of mineral dust was calculated using the following equation [18]:
Dosage = C × V × DI × T
where D was the dose of mineral dust, C was the saturated density of mineral dust aerosol in the nebulization device, V was the breathing volume per minute (0.3655 L·min−1 kg−1 for Wistar rat), DI was the distribution coefficient of gas in the animal’s lung (0.3 for Wistar rat), and T was the inhalation time.
Each experimental group rat was exposed to a mineral dust aerosol for 30 min every other day for a total of 10 weeks [19]. The body weight was measured every week. After the last exposure, the rat was fasted for 24 h, anesthetized using pentobarbital, and euthanized. The blood was collected from the abdominal aorta, and the major organs (i.e., the lung, heart, liver, spleen, and thymus) were collected.
Biochemical Analysis of Blood Samples
The blood sample was collected from each group and centrifuged at 1500 rpm for 10 min to obtain serum. The serum levels of aspartate aminotransferase (AST) and alanine aminotransferase (ALT) were measured using an automatic biomedical analyzer.
Immunophenotyping of Peripheral T Lymphocytes
Lymphocytes in the peripheral blood samples were immunophenotyped using a FACS can flow cytometer to determine the proportions of CD3+ T lymphocytes and their subsets, CD4+ and CD8+ T lymphocytes. For each sample, a minimum of 10,000 events were analyzed using the CellQuest program (BD Bioscience). The lymphocyte proportions were presented as percentages of the total cells analyzed.
Measurement of Inflammatory Cytokines and Reactive Oxygen Species (ROS)
In accordance with the individual ELISA kit manual, the OD 450nm of each well was measured using a microplate reader, and the serum level of IL-6, TNF-α, or ROS was determined using a corresponding standard curve.
The Organ Somatic Index Calculation and Pathological Examinations
The lung, heart, liver, spleen, and thymus were harvested, rinsed with saline to remove blood, pat-dried with filter paper, and then weighed. The organ somatic index (SI: organ weight corrected for body weight) was calculated as organ weight (g) / body weight (g). Part of each organ was excised, fixed in a 10% formalin solution, dehydrated, paraffin-embedded, sectioned, stained with hematoxylin and eosin (HE), and then observed under the light microscope.
Results and Discussion
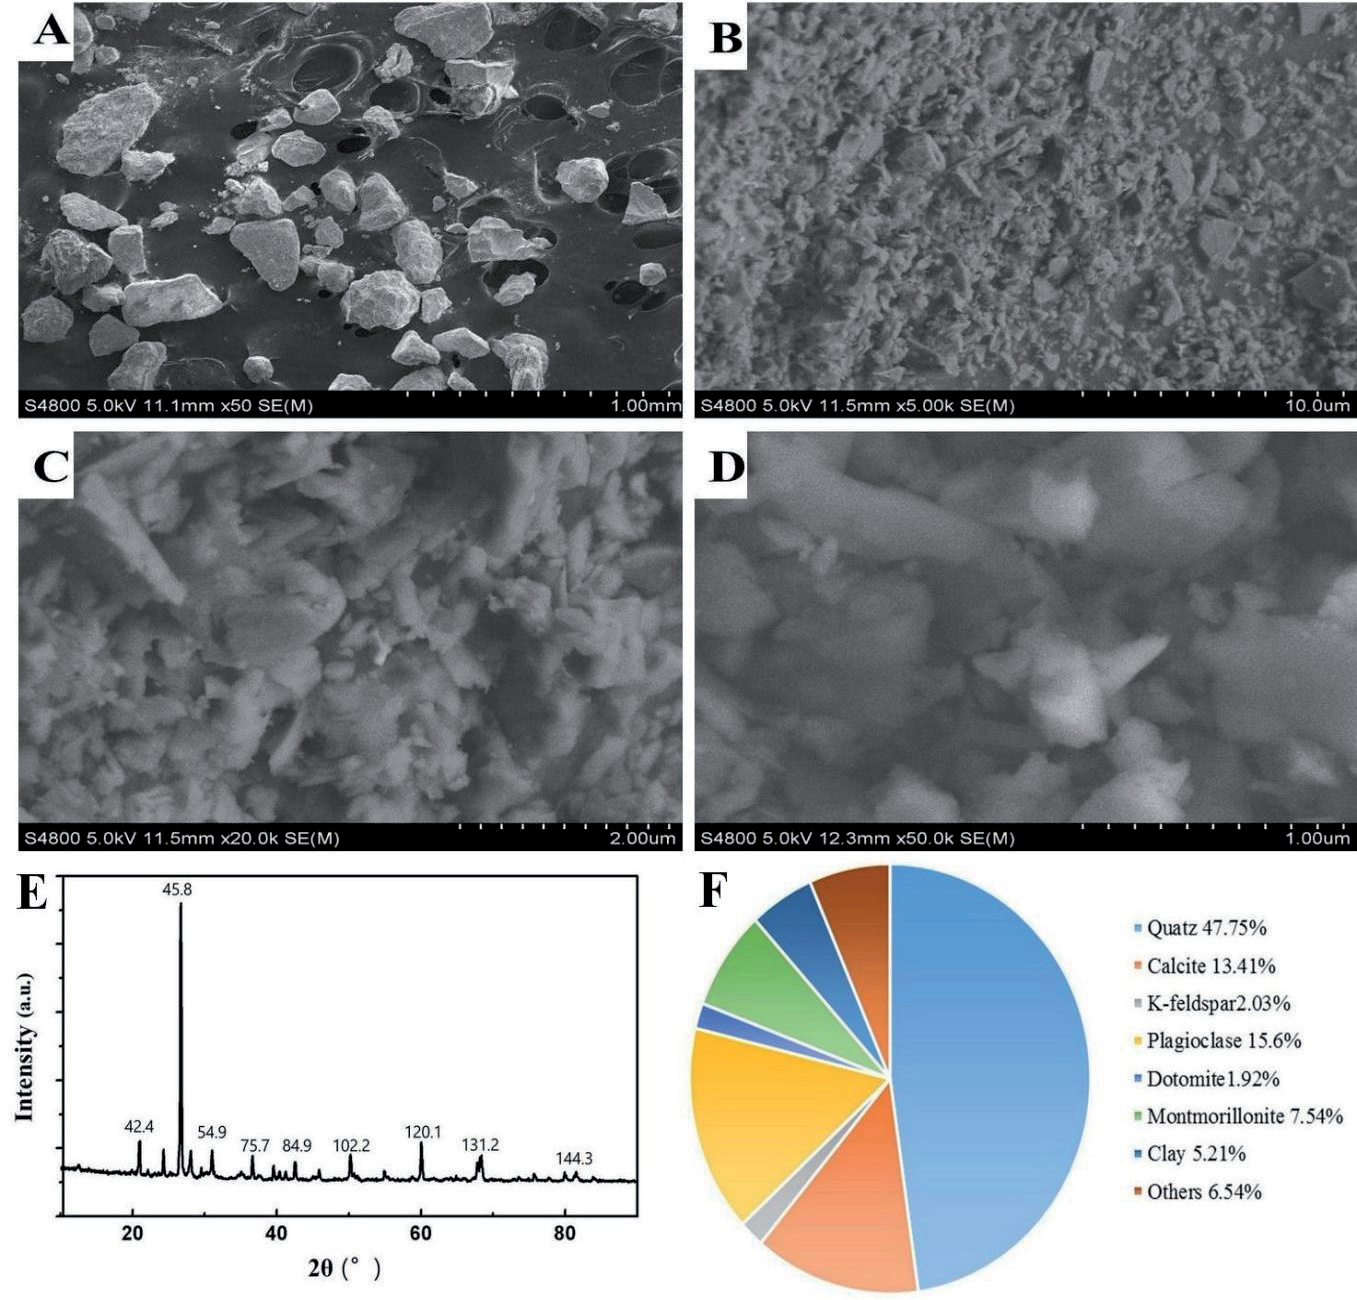
The mineral dust was obtained by ball-milling the collected sand sample for 18 h. The SEM analysis showed that the mineral dust had irregular shapes and diameters smaller than 1 µm. The particles were well dispersed, and no aggregation was observed (Figures 1A–B). XRD analysis showed that the mineral dust was primarily made up of quartz, calcite, K-feldspar, plagioclase, dolomite, montmorillonite, and clay (Figure 1C). Semi-quantitative analysis of the intensity of X-ray diffraction peaks showed that quartz contents dominated in the mineral dust (47.75%), followed by feldspar (K-feldspar and plagioclase; 17.63%), carbonate (calcite and dolomite; 15.33%), montmorillonite (7.54%), and clay (5.21%) (Figure 1D).
The dust storm particles are composed of insoluble mineral dust, water-soluble ions, and biogenic pollutants (such as spores, bacteria, and fungi) that were absorbed into the mineral dust [20]. Mineral dust is mainly comprised of the SiO2 and Al2O3 that constitute the Earth's crust, contribute to over 50% of the total particulate matter in the troposphere, and are a major component of airborne particulate pollutants [21]. Dajing Town in Wuwei City suffers from frequent dust storms, and the resulting inhalable mineral dust can travel long distances, driven by the wind, to affect other areas [1]. The biological effects of the mineral dust are closely associated with the size and concentration of the dust particles. Smaller mineral aerosols have a more reactive surface due to the greater number of atoms containing unsaturated bonds. These atoms are highly reactive, especially when surface energy increases dramatically [22]. In this study, we ball-milled local sand samples to obtain mineral dust particles. The resulting mineral dust particles had a diameter ≤ 2.5 µm, were well-dispersed, and no aggregates formed during preparation, attributes that were consistent with previous reports [20, 23].
Fig. 1.
Characterization of mineral dust particles. (A) SEM image of the sand sample; (B) SEM image of the mineral dust particles; (C) XRD spectra of the mineral dust particles; (D) Pie chart showing the composition of mineral dust.
The serum AST and ALT levels of the rats that received saline inhalation (34.8 ± 6.2 U/L and 92.9 ± 4.6 U/L, respectively) were comparable to those of healthy controls (35.6 ± 6.3 U/L and 99.2 ± 7.1 U/L, respectively). However, in the rats exposed to mineral dust inhalation, a dose-dependent elevation of the serum ALT and AST levels was observed (P < 0.05) (Table 1). The rats exposed to 10 mg/kg b.w. mineral dust had the most significant increase in ALT and AST, which were 102.5 ± 11.2 U/L (P < 0.01) and 227.8 ± 25.2 U/L (P < 0.01), respectively.
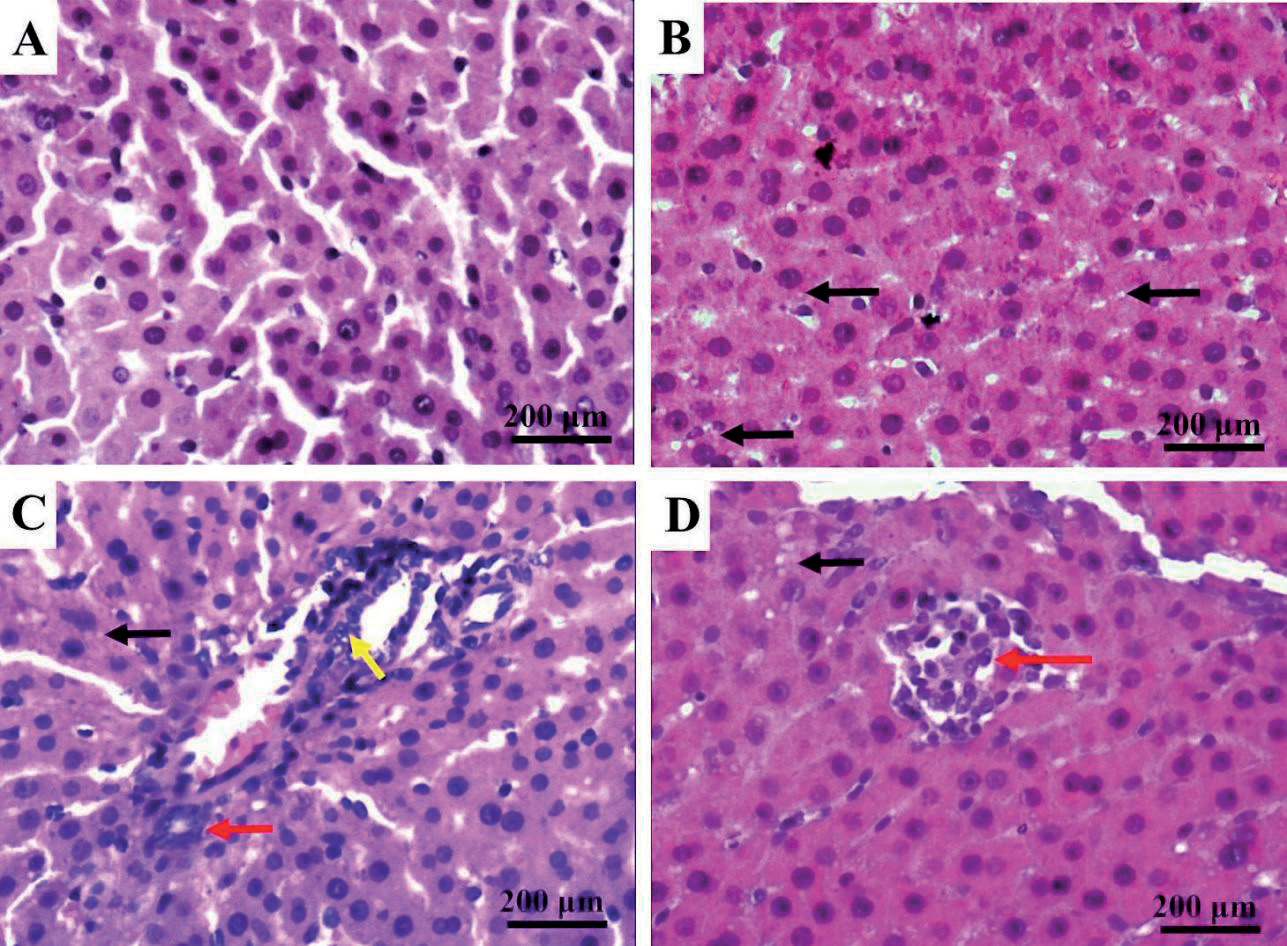
Depending on weather conditions and particle size, dust can stay in the atmosphere for anywhere from a few hours up to ten days. Coarse particles ranging in size from 2.5 to 10 µm can be breathed deep into the lungs. Smaller particles that are less than or equal to 2.5 µm in diameter may even be able to enter the bloodstream [24]. The mineral dust used in this study is mainly comprised of quartz (47.75%), feldspar (K-feldspar and plagioclase; 17.63%), and carbonate (calcite and dolomite; 15.33%), and has an average diameter ≤ 1 µm. Inhalation of such mineral dust caused both respiratory damage and extrapulmonary effects in rats. For example, the rats exposed to mineral dust inhalation at 10 mg dust/kg body weight had significantly increased lung SI as compared to those exposed to saline. In addition, HE staining of lung tissue showed dilation of the alveoli, thickening of the interstitial septum, formation of cysts due to fusion of neighboring alveoli, reduction in the number of pre-acinar pulmonary vessels, fibrotic thickening of the intima in pulmonary interstitial arteries, and infiltration of inflammatory cells in the lung. These pathological changes suggested inflammation in the lungs. Among the extrapulmonary organs, the spleen showed a dose-dependent increase in somatic index, accompanied by various degrees of congestion of the spleen under the microscope. Although liver SI didn’t increase significantly in all dose groups, the liver damage was evidenced by elevated AST and ALT levels as well as histopathological changes, which was consistent with a previous report on mineral dust-induced liver damage in mice [25, 26]. Lung damage associated with mineral dust has been reported frequently [27]. However, we observed more significant damage in extrapulmonary organs. This damage could be explained by the highly variable chemical compositions and sizes of the airborne dust particles derived from natural desert environments. For example, our mineral dust was less than 1 µm, which is more likely to enter blood circulation and cause damage to other organs. In addition, it is not clear whether other components (feldspar carbonate, etc.) in our mineral dust would exert toxic effects on the liver or spleen. Further investigation is needed to elucidate which chemical substances are responsible for the toxic tissue damage.
Table 1.
The effect of inhalable mineral dust particles on the serum ALT and AST levels in rats (n = 12, mean ± SD)
Fig. 2.
The effect of mineral dust aerosol inhalation on the serum ROS level in rats. Note: as compared with saline control group, *: P < 0.05, **: P < 0.01.
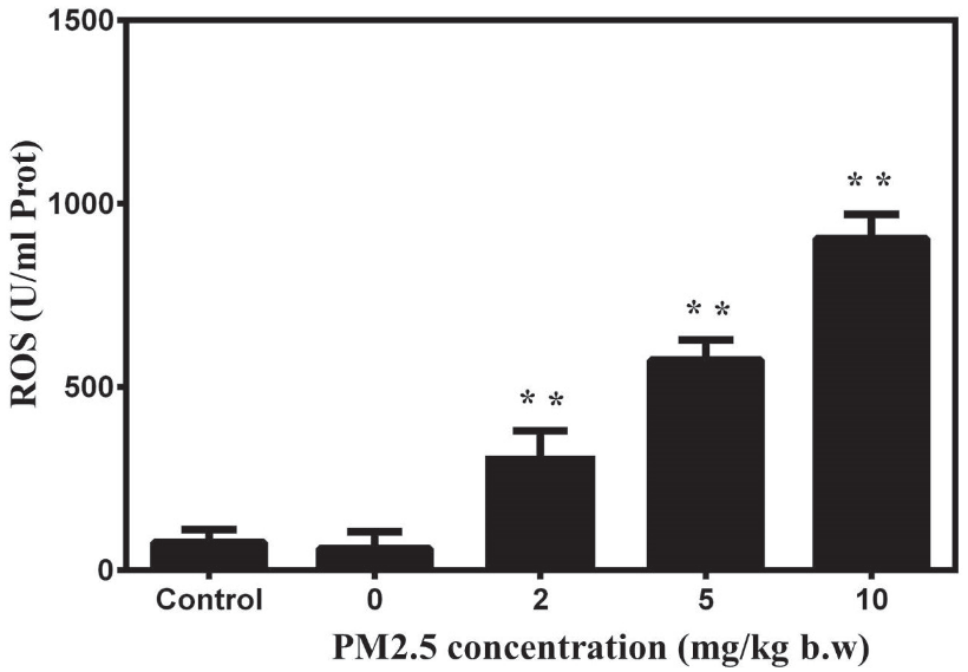
Fig. 4.
The effect of inhaled mineral dust on the organ somatic index (The ratio of body weight and organ weight) in rats. Note: as compared with saline control group, *: P < 0.05, **: P < 0.01. Only spleen has significant change compare with control group.
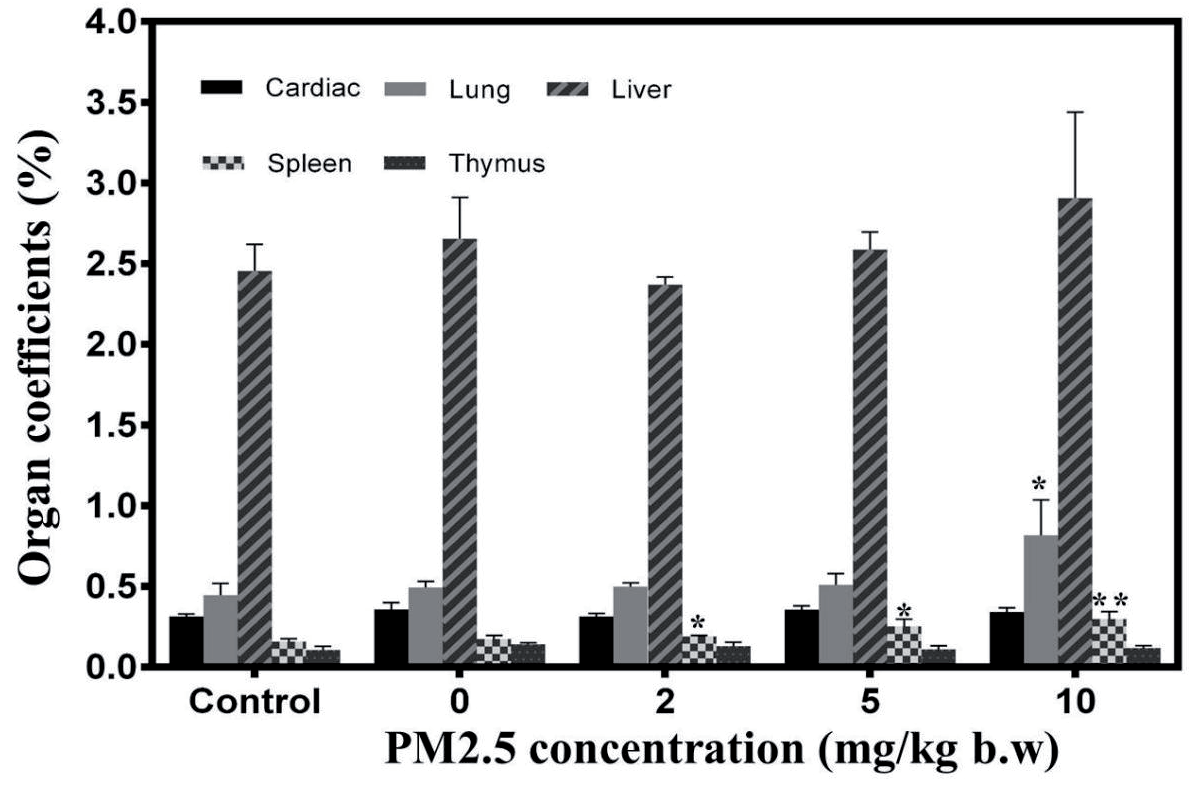
Fig. 3.
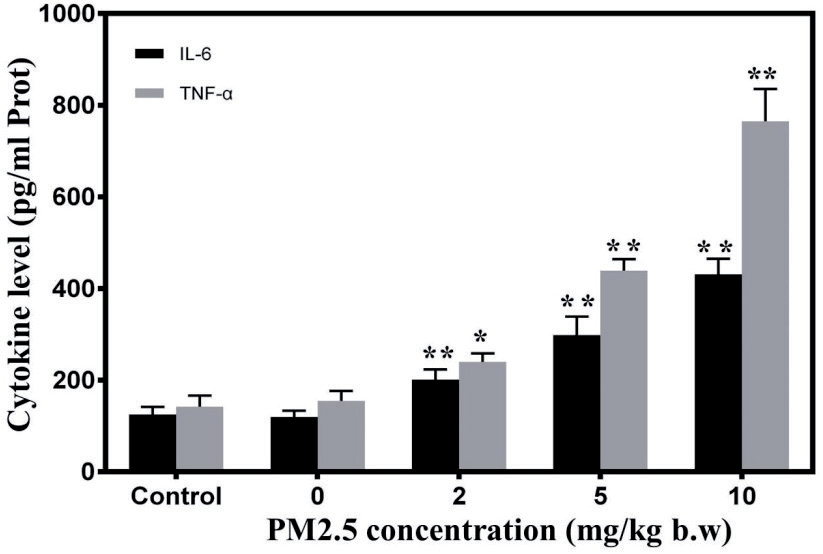
The effect of mineral dust aerosol inhalation on the serum levels of IL-6 and TNF-α in rats. Note: as compared with saline control group, *: P < 0.05, **: P < 0.01.
As shown in Figure 2, all the rats exposed to mineral dust had significantly higher ROS levels than those exposed to saline. In particular, the rats that received 10 mg/kg b.w. mineral dust inhalation had ROS levels as high as 976 ± 16 (U/mL; P < 0.01). The increase in ROS level was dependent on the dose of inhaled mineral dust.
Fig. 5.
HE staining of rat lung tissues. The black arrows indicated infiltration of inflammatory cells. The red arrows indicated hyperemia. The yellow arrows indicated the changes of tissue density. The green arrows indicated the bronchial epithelial hyperplasia. (A) Control group, (B) 2 mg/kg b.w. group, (C) 5 mg/kg b.w. group, and (D) 10 mg/kg b.w. group.
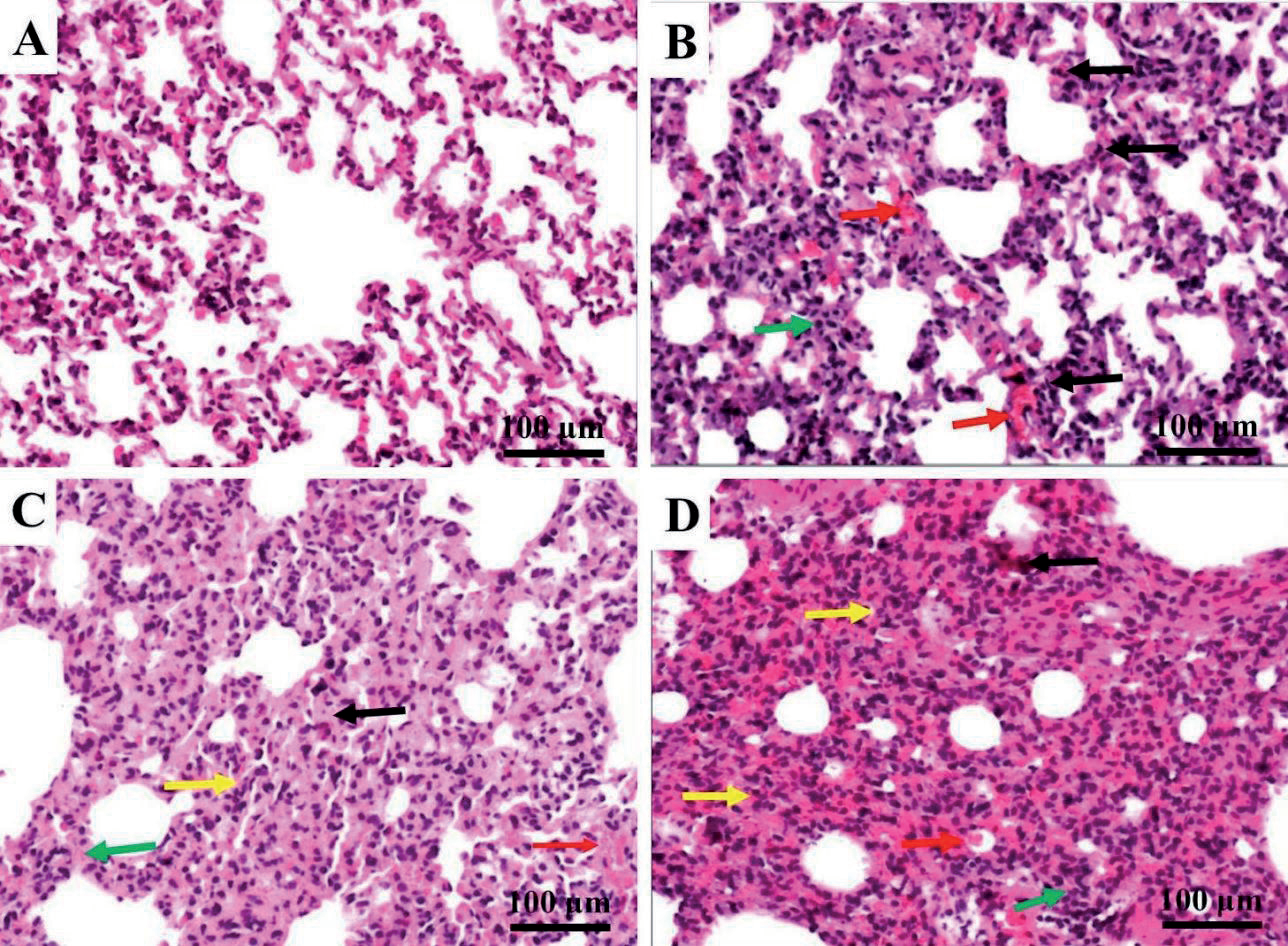
Fig. 6.
HE staining of rat liver tissues. The black arrows indicated steatosis. The yellow arrows indicated the infiltration of inflammatory cells. The red arrows indicated scattered cell death. (A) Control group, (B) 2 mg/kg b.w. group, (C) 5 mg/kg b.w. group, and (D) 10 mg/ kg b.w. group.
The ROS level is a representative indicator of the organism’s free radical level. Under pathological conditions, high levels of ROS can result in increased peroxisome activity, persistent nuclear and mitochondrial DNA damage, and lead to cell death and inflammatory reactions [28]. Previous studies reported that certain components of PM2.5, i.e., trace metal elements, organic pollutants, and mineral dust, cause damage in the target organs via increasing ROS production, activating antioxidant signal pathways, and upregulating the expression levels of inflammatory cytokines [29]. PM2.5 exposure induces autophagy of pulmonary macrophages via the oxidative stress-mediated PI3K/AKT/mTOR pathway, which may contribute to the immunotoxicity caused by PM2.5 [30]. Our study showed that mineral dust inhalation led to elevated serum ROS levels and triggered an oxidative stress response.
Fig. 7.
HE staining of rat spleen tissues. The red arrows indicated hyperemia and tissue edema. (A) Control group, (B) 2 mg/kg b.w. group, (C) 5 mg/kg b.w. group, and (D) 10 mg/kg b.w. group.
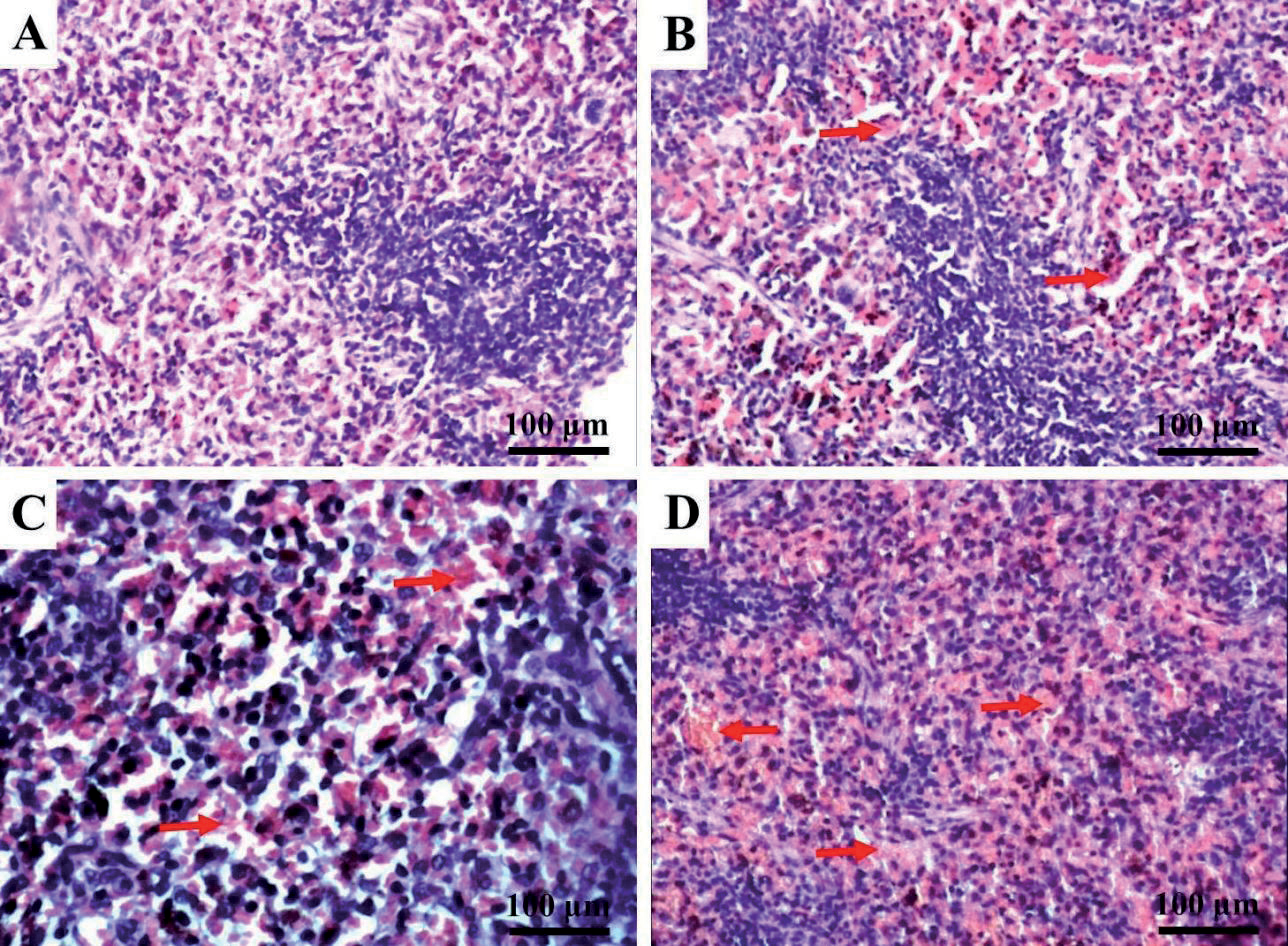
Fig. 8.
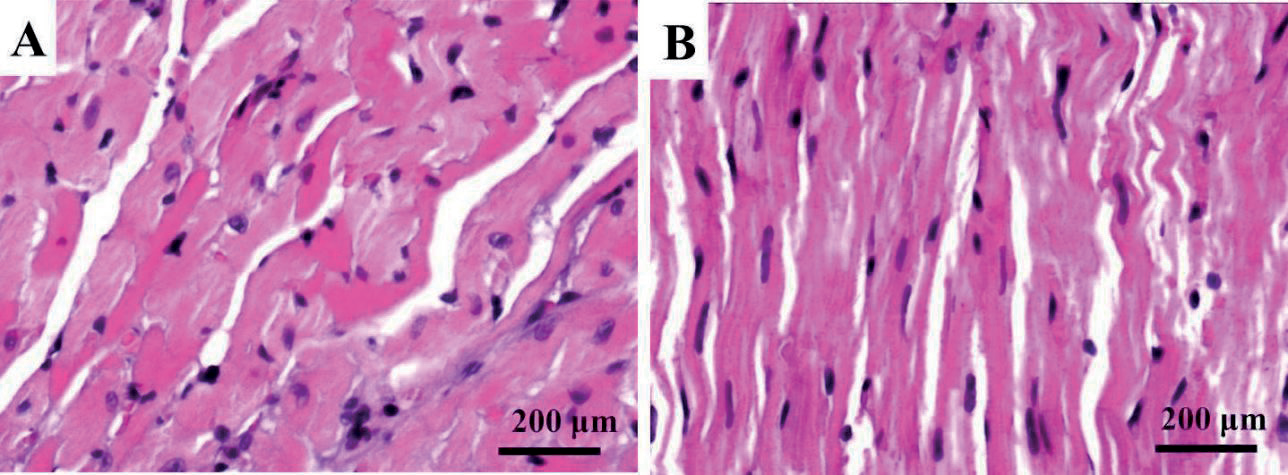
HE staining of rat heart tissues. No morphological changes were observed. (A) Control group and (B) 2 mg/kg b.w. group.
After mineral dust inhalation, the serum IL-6 and TNF-α levels were measured and presented in Figure 3. Compared with the saline group, the mineral dust inhalation group’s serum IL-6 and TNF-α levels showed a significant dose-dependent increase (P < 0.01).
Inhaled PM particles may come into contact with airway epithelial cells or immune cells in the lungs and trigger an innate immune response, leading to the release of pro-inflammatory cytokines into the circulation. IL-6 and TNF-α are pro-inflammatory cytokines that are released in response to particulate matter exposure [31]. TNF-α activates the lung epithelial cells and endothelial cells to secrete chemokines and other inflammatory cytokines, such as IL-6. IL-6 induces the proliferation and differentiation of the B and T lymphocytes, regulates immune responses, and triggers a downstream inflammatory response cascade [32]. Mice that were instilled intratracheally with Asian sand dust PM2.5 developed severe acute pulmonary inflammation, as evidenced by increased inflammatory cell infiltration within the bronchiolar and alveolar compartments, as well as enhanced expression of cytokines (IL-1β, IL-6, IL-12, IFN-γ, and TNF-α) and chemokines (KC, MCP-1, and MIP-1α) [33]. We found that mineral dust inhalation increased serum IL-6 and TNF-α levels dose-dependently, which was consistent with previous studies.
Fig. 9.
The effect of mineral dust on the T-cell subtypes in rats. (A) Control group, (B) 2 mg/kg b.w. group, (C) 5 mg/kg b.w. group, and (D) 10 mg/kg b.w. group.
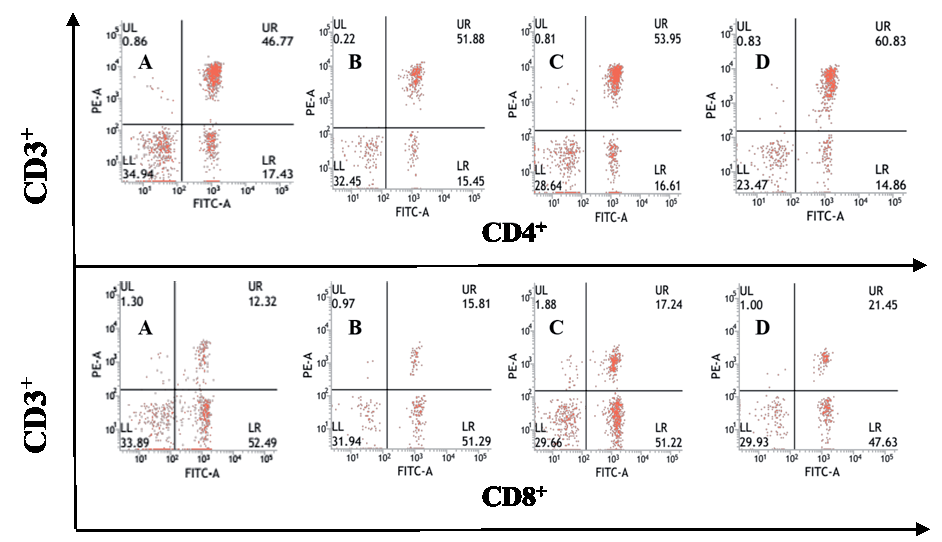
Table 2.
The effect of inhaled mineral dust on the T-cell subtypes in rats (n = 12, mean ± SD,%)
The lung SI of the rats that were exposed to high dose mineral dust (10 mg/kg b.w.) was significantly greater than that of the rats exposed to saline (P < 0.05) (Figure 4). The spleen SI of the rats exposed to mineral dust showed a significant dose-dependent increase (P < 0.05). However, the SI of the heart, liver, and thymus did not differ among the groups.
The morphological structures of major organs were assessed by H&E staining in each group. All the tissues were normal in the saline control group. In the mineral dust inhalation groups, the histopathological changes in the lung tissue included dilated alveolar ducts, a thickened interalveolar septum, fusion of neighboring alveoli resulting in enlarged cysts, a reduction in the number of pre-acinar pulmonary vessels, fibrotic thickening of the intima in pulmonary interstitial arteries, and inflammatory cell infiltration (Figure 5). In the liver tissue, slight steatosis, swollen hepatocytes, scattered individual or clustered necrotic hepatocytes, and inflammatory cell infiltration in the portal area were manifested (Figure 6). The spleen displayed moderate and severe hyperemia (Figure 7). However, the heart tissue of the mineral dust inhalation groups had no pathological changes (Figure 8).
In the rats exposed to various doses of mineral dust, the percentages of CD3+, CD4+, and CD8+ all showed an increasing trend. The percentages of CD3+ and CD4+ cells were significantly increased in all the rats exposed to mineral dust (P < 0.05), except in those in the 2 mg/kg b.w. group. The percentages of CD8+ T cells increased significantly in all the rats exposed to mineral dust (P < 0.05). In particular, the rats exposed to the highest concentration of mineral dust (10 mg/kg b.w.) had CD8+ T cell percentages as high as 19.31 ± 3.06% (P < 0.01) (Fig. 9 and Table 2).
T lymphocytes are key effector cells that defend the body in cell-mediated immune responses. Homeostatic imbalance of T-cell subtypes plays a critical role in inflammatory diseases [34]. The peripheral blood T-cell pool is tightly regulated by homeostatic mechanisms to control the numbers of T lymphocytes in circulation as well as the subtypes (i.e., CD4+ vs. CD8+) to ensure the organism can respond to random antigenic challenges while preserving immunological memories [35]. In this study, exposure to mineral dust aerosol led to an increased number of CD3+ T cells, CD4+ T cells, and CD8+ T cells. In particular, the increase of CD8+ T cells was the most significant, and the CD4+/CD8+ ratio showed a dose-dependent decrease. It has been reported that PM2.5 could promote the cytotoxicity of T cells in a macrophage-dependent manner and potently induce the death of human bronchial epithelial cells [36]. The increase in CD8+ cells and the imbalance between CD4+ and CD8+ T lymphocytes may explain the pathological changes observed in the lungs. Based on these results, we postulated a collective contribution of the elevated ROS, homeostatic imbalance of T-cell subtypes, and release of inflammatory cytokines to the mineral dust-induced tissue damage observed in the lungs, liver, and spleen.
Conclusions
Fine mineral dust was prepared from the ball-milling of the sand sample collected in Dajing Town, Wuwei City. Quartz contents dominated the resulting mineral dust (47.75%), followed by feldspar (K-feldspar and plagioclase; 17.63%), carbonate (calcite and dolomite; 15.33%), montmorillonite (7.54%), and clay (5.21%). Rats exposed to the mineral dust every other day for 20 weeks exhibited histological lung, liver, and spleen damage, accompanied by the dose-dependent increases of CD3+, CD4+, and CD8+ T cell numbers, as well as an imbalanced CD4+/CD8+ ratio. Furthermore, exposure to mineral dust, but not saline, triggered an oxidative stress response and an inflammatory response, which were evidenced by dose-dependent elevation of ROS, IL-6, and TNF-1α levels. These findings show that mineral dust in this area can penetrate deep into the lungs and even enter the bloodstream, where it can activate an oxidative stress response, induce proinflammatory cytokine production, and eventually lead to a homeostatic imbalance of T-lymphocyte subsets and tissue damage. Due to the fact that airborne dust derived from natural desert environments is often a complex mixture of mineral and organic components with highly variable chemical compositions and sizes, further studies are necessary to elucidate the harmful effects of individual components in the mineral dust.

