

Introduction
In the process of engineering construction, a large number of exposed slopes will be formed, resulting in regional geological disasters and soil erosion. Traditional slurry masonry, ordinary concrete, and other protective engineering can improve the stability of the slope, but their compatibility with the ecological environment is poor, so some people put forward vegetation-compatible concrete, which can perfectly combine the safety and ecology of the slope. Grass-Planting Concrete (GPC), also referred to as Ecological Pervious Concrete or Vegetation Concrete [1, 2], is a concrete material characterized by a continuous, random, porous structure. GPC binds coarse aggregates together through cementitious materials, endowing them with excellent mechanical properties [3, 4]. Simultaneously, it serves as a substrate suitable for plant growth. The interconnected porous structure of GPC provides space for the development of animals, microorganisms, and plants. The vegetation medium filling the pores offers essential conditions for material exchange in root systems [5], contributing to ecosystem regulation, increased biodiversity, and vast potential applications. However, limitations such as restricted space for root growth, poor water retention, and low nutrient content in GPC often pose challenges to plant growth, leading to stress [6]. These challenges hinder GPC from fully realizing its ecological potential. As plant roots directly interface with GPC, their growth conditions significantly impact overall plant development. Thus, studying the changes in the growth characteristics of plants in GPC media is particularly important for understanding the strategies plants employ to adapt to stress.
The factors influencing the vegetative performance of GPC include the connected porosity and pore solution pH [7]. A higher porosity in GPC provides more space for plant growth, facilitating nutrient absorption by plant roots. However, excessively large porosity can lead to a reduction in the strength of GPC, compromising engineering safety requirements. Additionally, excessive permeability is not conducive to water retention. Studies suggest that a 20% to 30% porosity range is optimal for balancing vegetative and mechanical performance in GPC [8]. The hydration products of cement, such as calcium silicate hydrate gel (C-S-H; C=CaO, S=SiO2, H=H2O) and calcium hydroxide (CH), result in a pore solution pH exceeding 13.5 in cured GPC [9], creating a solid alkaline stress unfavorable for plant growth. Researchers have explored methods to reduce alkalinity in GPC. Li et al. used low-alkali cement, such as sulfate-resistant cement, to prepare GPC, effectively reducing pH to 11.4 [10]. Gong et al. further reduced alkalinity by adding urea to GPC prepared with sulfate-resistant cement. Urea hydrolysis generated carbonate ions, which reacted with calcium ions from cement hydration, forming calcium carbonate that adhered to the surface of cement particles. This method effectively lowered the alkalinity of planting concrete but had some adverse effects on its strength [11]. Incorporating mineral admixtures such as fly ash, silica fume, and phosphorous slag can also reduce the alkalinity of GPC after formation, but the content should not exceed 40% [12]. Additionally, spraying latex or acidic liquids on completed GPC can reduce alkalinity [13]. The former effectively isolates alkaline substances, while the latter, in addition to lowering alkalinity, positively impacts the strength of GPC. Despite these measures, GPC subjected to alkali reduction treatments may still exhibit relatively high alkalinity [14]. Moreover, due to the influence of manufacturing processes, the effectively connected porosity of GPC may not be adequately guaranteed, resulting in continued stress on plant survival. Therefore, it is essential to study plants’ growth conditions in GPC.
In evaluating plant growth within GPC, primary indicators include plant height, coverage, etc. [15, 16]. Grass species adapted to GPC primarily include tall fescue, dogtooth grass, purple clover, and broadleaf foxtail [17]. Li et al. conducted a study on the vegetation performance of GPC from the perspective of plant physiological activity. They identified Soluble Protein, Relative Electrical Conductivity, and Malondialdehyde as key physiological indicators influencing plant growth [18]. Previous research on the vegetation performance of concrete has focused on evaluation criteria such as plant height, growth rate, vegetation coverage, and survival rate. Analysis of GPC has included considerations of porosity selection, alkali reduction techniques, and durability performance. This research has led to identifying several grass species suitable for growth on GPC. However, studies on plants’ morphology, physiology, and mechanics in GPC media are not sufficiently in-depth. Reports on the impact of GPC media on plant root system configuration are scarce. Plant root systems can enhance soil shear strength and erosion resistance, with the reinforcement effect of roots being widely acknowledged. Roots interlace in the soil and exert tensile forces to improve the soil’s shear strength [19-21].Plants root in GPC to absorb nutrients for their growth. GPC strengthens the connection between concrete blocks and base soil through plant root systems, enhancing overall stability. Therefore, studying the morphology and structure of plant root systems is crucial for analyzing the vegetation performance of GPC.
In this study, wollastonite powder was used as a mineral admixture to make GPC and spray oxalic acid for GPC alkali reduction treatment. This study selected ryegrass (Lolium multiflorum) as the experimental grass species. The geometric morphology, fractal characteristics, and topological structure parameters of ryegrass roots were determined in both GPC and soil media. The study analyzed the variation patterns of root system configuration throughout different growth stages. The objective was to comprehend ryegrass’s response strategies to the stress environment of GPC, providing theoretical and technical support for the structural optimization and vegetation performance assessment of GPC.
Materials and Methods
Raw Materials
Coarse Aggregate
The coarse aggregate used in this experiment is the crushed stone purchased at the Chenyang Building Materials Supply Station in Qingshan Lake District, Nanchang City, with a particle size range of 20~25 mm. Its fundamental performance test indicators are shown in Table 1.
Fine Aggregate
The fine aggregate used in this experiment is Nanchang local river sand, and its basic properties are shown in Table 2.
Cement
The cement used in this test is P.O 42.5 ordinary Portland cement produced by Jiangxi Conch Cement Co., Ltd. The leading performance indicators are shown in Table 3.
Wollastonite Powder
In this experiment, Wollastonite powder was added to replace part of the cement, and the replacement proportion was 25%. Wollastonite powder was produced by Jiangxi Hengshengtai New Material Co., Ltd. Its basic properties are shown in Table 4.
Admixture
In this experiment, polycarboxylate superplasticizer was selected, and the dosage was 0.2% of cement. The basic properties of the superplasticizer are shown in Table 5.
In this experiment, the reinforcing agent is the permeable concrete reinforcing agent produced by Jiangsu Jiuherun Engineering Technology Co., Ltd. The basic parameters are shown in Table 6.
Method
Method for Calculating GPC Mix Proportions
In this test, single-particle size coarse aggregate was used to create grass-planting concrete, and the proportions were calculated using the volume method. To strike the right balance, the porosity of grass-planting concrete should neither be too small, hindering plant roots from reaching the protected soil, nor too large, which could compromise structural strength and usability. Generally, vegetative porous concrete should fall within the porosity range of 18% to 35%. For this test, the target porosity was set at 23%, with a water-cement ratio of 0.3 and a cement-sand ratio of 3 : 1. Additionally, 25% wollastonite powder, 0.2% water-reducing agent, and 25% water-reducing effect were incorporated using the internal mixing method. The specific mix proportion for GPC is detailed in Table 7.
Table 1.
Basic performance index of coarse aggregate.
| Aggregate Diameter (mm) | Apparent Density (kg/m3) | Bulk Density (kg/m3) | Water Absorption (%) | Mud Content (%) | Needle Flake Content (%) |
|---|---|---|---|---|---|
| 20-25 | 2699 | 1428 | 10.6 | 0.9 | 2.5 |
Table 2.
Basic performance indexes of fine aggregate.
| Fineness Modulus | Apparent Density (kg/m3) | Bulk Density (kg/m3) | Mud Content (%) |
|---|---|---|---|
| 2.5 | 2610 | 1495 | 1.8 |
Table 3.
Main performance indexes of cement.
| Specific Surface Area | Loss on Ignition (%) | Initial Setting Time (min) | Final Setting Time (min) | 3d Compressive Strength (MPa) | 3d Flexural Strength (MPa) |
|---|---|---|---|---|---|
| 337 | 2.88 | 187 | 227 | 27.8 | 6.0 |
Table 4.
Basic properties of Wollastonite powder.
| Fineness (%) | Loss on Ignition (%) | Density (g/cm3) | Bulk Density (g/cm3) | Al2O3 Content (%) | SiO2 Content (%) | CaO Content (%) |
|---|---|---|---|---|---|---|
| 10 | 3 | / | / | 0.1~0.3 | 49~52 | 43~44 |
Table 5.
Basic properties of a water reducer.
| Solid Content (%) | pH (5% aqueous solution) | Sodium Sulfate Content (%) | Cement Paste Fluidity (mm) | Water Reduction Rate (%) |
|---|---|---|---|---|
| ≥92 | 7~9 | 16%~19% | ≥2000 | 25 |
Table 6.
Basic parameters of a reinforcing agent.
| Chloride Ion Content (%) | Total Alkali Amount (%) | Silica Content (%) | pH | Density (%) | Density (g/cm3) | Moisture Content (%) |
|---|---|---|---|---|---|---|
| 0.16 | 5.4 | 66.26 | 9.32 | 9.39 | 1.08 |
Test Block Fabrication
Firstly, the raw materials are weighed according to the mix ratio, and cement, fine aggregate, and powder admixture are evenly mixed to form the cementitious materials. GPC is made according to the process shown in Fig. 1. The specific steps are as follows: 1) Put the coarse aggregate into the mixer, add 20% water to moisten, and stir for 1 min. 2) Add 50% cementitious materials and 40% water and continue stirring for 1 min. 3) Add the remaining ingredients and continue stirring for 2 min. 4) Load the stirred GPC into the mold three times and vibrate and compact. The test block size was 15 cm×15 cm×8 cm. 5.24 h later, remove the mold and move it into the standard curing box for constant temperature and humidity. 5) After 28d curing, spray the GPC test block three times with 1% oxalic acid solution to reduce the alkalinity of GPC. The oxalic acid reagent selected was LEX-826, a composite oxalic cleaning agent produced by Shenze County Nuoweiri Chemical Co., Ltd., and its fundamental performance indicators are shown in Table 8.
The basic performance indexes of GPC made by the above method are shown in Table 9.
Planting and Root Sample Collection
The pot experiment used soil collected from the surface layer (0-30 cm) of a slope on the campus of Nanchang Institute of Technology. The physical and chemical property parameters of the soil used in this experiment are shown in Table 10. The soil was prepared for the next experiment after natural air-drying and passing through a 2 mm sieve to remove stones and roots. The particle size of the soil is mainly concentrated between 0.25 mm and 1 mm. The soil is well graded (non-uniformity coefficient Cu = 5.91, curvature coefficient Cc = 1.4), and its particle size composition is shown in Table 11. Planting pots with a depth of 25 cm were used as containers for plant growth. A 10 cm thick basal layer of soil was placed at the bottom for use. Ryegrass was selected as the research subject due to its rapid growth characteristics and well-developed root systems. The research team verified in preliminary experiments that ryegrass could adapt well to the stress environment of GPC.
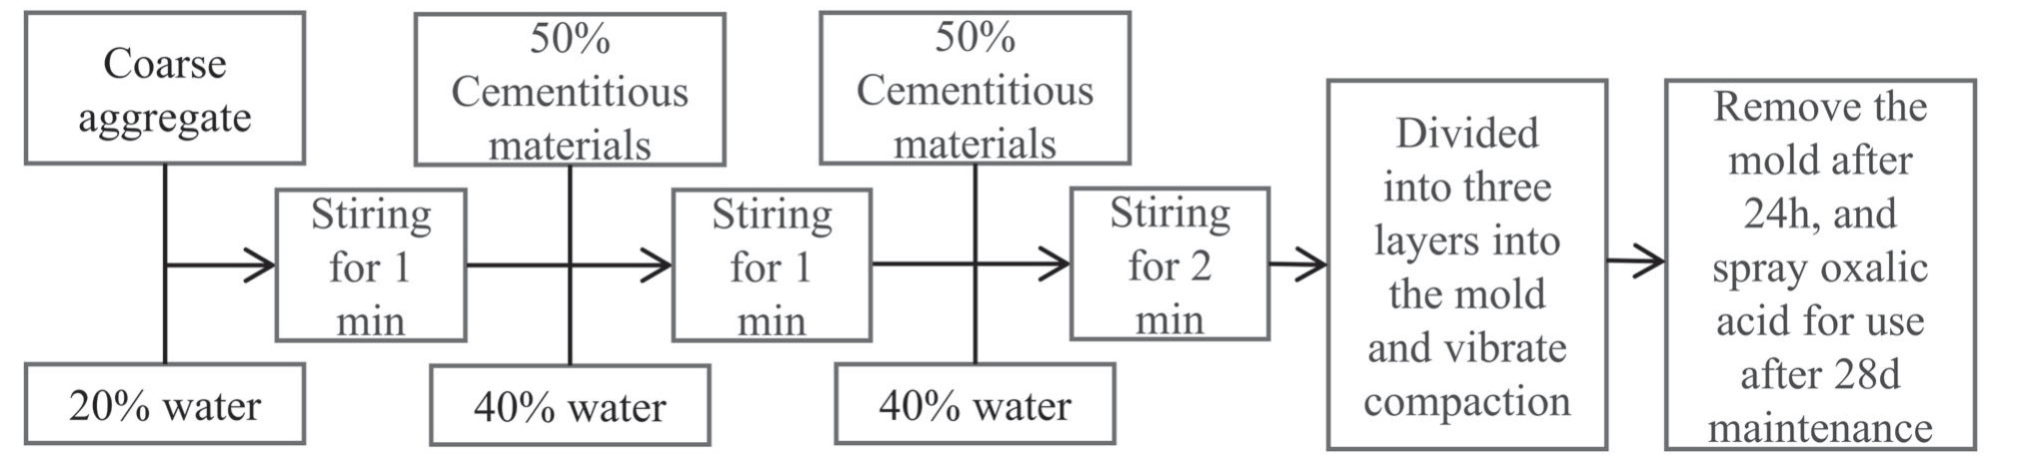
Table 9.
Basic performance index of GPC.
| Porosity (%) | Density (g/cm3) | Compressive Strength (MPa) | Breaking Strength (MPa) | pH |
|---|---|---|---|---|
| 21.5~25.5 | 2390~2460 | >10 | >3 | <10.5 |
Table 10.
Soil physicochemical parameters.
| Soil natural density (g/cm3) | Dry density (g/cm3) | Moisture content (%) | Specific gravity of soil particles | Porosity (%) | pH |
|---|---|---|---|---|---|
| 1.90 | 1.59 | 19.35 | 2.64 | 39.75 | 6.8 |
Table 11.
Mass fraction of different particle sizes.
| Grain diameter (mm) | Less than a certain particle size soil particle mass percentage (%) |
|---|---|
| 2.00 | 100.00 |
| 1.00 | 83.24 |
| 0.50 | 43.11 |
| 0.25 | 21.64 |
| 0.10 | 8.01 |
| 0.075 | 4.72 |
Two experimental treatments were set up: one using GPC medium (EG) and the other using pure soil medium (CG). In the EG group, the GPC was first treated with soil filling, mixing soil and water into a flowing state and pouring it into the GPC. In the CG group, soil was directly layered into the planting pots and compacted. Finally, seeds were broadcast at 30 g/m2 density on the surface of both treatments, and a thin layer of soil was covered for watering and maintenance.
The experiment was conducted with planting on November 8, 2021. According to the 2021 climate report from the Jiangxi Meteorological Bureau, the average winter temperature in Nanchang was 9.2ºC. Plants relied on rainfall to supplement water, simulating growth conditions close to their natural state. Root systems were obtained by disturbing the grass-concrete test blocks at three growth stages: the elongation stage (March 16, 2022), the heading stage (May 7, 2022), and the fruiting stage (June 9, 2022). For each sampling, plants with an equivalent area in the control group were excavated from the soil, and the substrate was gently shaken off. The roots were then rinsed clean with water, and 15 complete ryegrass roots were selected from each test block for subsequent root scanning analysis.
Calculation Method of Root Basic Characteristic Parameters
The spatial distribution attributes of root systems in the soil are typically expressed through root system configuration, including geometric features, fractal characteristics, and topological structure parameters [22]. Geometric parameters such as total root length, total root surface area, root diameter, and root volume can reflect the importance of the root system. Fractal characteristics can quantitatively describe root systems’ spatial distribution, branching, and expansion range in different environments and growth stages. Topological indices reflect the branching and spatial expansion patterns of plant root systems in the soil. All these indicators can provide insights into the growth of plants in GPC media.
The characteristic parameters of the whole root system are: The collected root samples were placed in a high-penetration scanning disk with an Epson Expression 10000XL scanner for 8-bit grayscale scanning (resolution of 300 dpi), and the scanned images were measured and analyzed by the WinRHIZO root analysis system. The total root length, root surface area, average root diameter, root volume, root tip number, branch number, cross number, average branch angle, average connection length, and other related parameter data were obtained. The following formula calculates the root tip density and branch density.
Apical density (unit · cm-1); the root branching density (number · cm-1); the number of root tips; the number of root branches; the total root length (cm).
Calculation of Root Fractal Characteristic Parameters
The box dimension method is used to calculate the fractal dimension of roots. The calculation method obtains the number N of small squares with a side length of r on the root distribution map and the number N of small squares cut by the roots. As the side length r of the small square gradually decreases, the N cut by the roots gradually increases. After obtaining the corresponding N values at different side length levels r, the linear regression equations are obtained by plotting lg r and lg N as abscissa and ordinate, respectively.
In the formula, the negative number of the slope of the regression line is the fractal dimension (FD), and the intercept lg K of the regression line is the fractal abundance (FK), which is a certain value; generally, the fractal dimension of plant roots is 1<FD<2. The more root branches, the larger the fractal dimension of the roots, indicating that the roots are more developed. The better the branching ability and development degree, the more the fractal abundance reflects the roots’ expansion range, density, and resource competitiveness in the growth medium. The larger the value, the larger the expansion volume of roots in the soil.
Calculation of the Root Topological Index
The root scan images were analyzed by WinRHIZO (Pro. 2008) to obtain the number of external root links (magnitude, μ) and the number of longest root links (altitude, α). The topological index (TI) was calculated according to Fitter’s classical root topological structure and calculation method.
In the formula, α is the number of links in the longest link path of the root system, and μ is the number of external links of the root system. The closer the topological index TI is to 1, indicating that α and μ are approximately equal, that is, there are fewer root branches, and the closer the root system is to the herringbone branching pattern, the closer the TI was to 0.5, indicating that the more the number of external connections of the root system, the more complex the root branch structure, the more secondary branches, and the closer the root system was to the fork branch mode.
Data Analysis
Microsoft Excel 2016 was used to sort out the original data, and the geometric morphological parameters of ryegrass roots at different growth stages under different growth media were statistically analyzed. One-way analysis of variance and Tukey’s post-hoc multiple comparisons test were used to determine the effects of different growth periods on root parameters of ryegrass. To explore the differences in the correlation between root system configuration features and morphological parameters in two different media, Pearson correlation analysis was conducted on the configuration features and mean values of various morphological parameters during three growth stages. Calculations were performed in SPSS 26.0, using a significance level of p = 0.05. Graphing with Origin 2021 software.
Results
Root Characteristic Parameters of Different Media
Root Basic Characteristic Parameters
By one-way ANOVA on the collected root data, we found that different growth periods had significant effects on root basic characteristic parameters (Table 12). The characteristic parameters of ryegrass root systems at different growth stages in the soil medium are presented in Table 13. Among the morphological parameters representing the overall root volume, both total root length and total root surface area gradually increased with growth stages, reaching their maximum at the fruiting stage, with significant differences compared to the elongation stage (p<0.05). The average root diameter decreased, with the highest at the elongation stage and the lowest at the fruiting stage. The average root diameter at the elongation stage differed significantly from the other two growth stages, a pattern attributed to the continuous branching and development of fine roots in the ryegrass root system. There were no significant differences in root volume among the three growth stages. However, parameters characterizing the branching status of the root system, such as root tip number, branch number, and crossing number, increased significantly with growth stages. This suggests that ryegrass root systems were essentially developed during the elongation stage in the soil medium. Subsequently, the main focus was on the growth and branching of fine roots. As the volume proportion of fine roots was relatively small, the differences in root volume among the three growth stages were insignificant, with experimental data showing only a slight increase.
The characteristic parameters of ryegrass root systems at different growth stages in the GPC medium are presented in Table 14. Among the morphological parameters representing the overall root volume, total root length, total root surface area, average root diameter, and root volume showed a gradual decrease with growth stages. Although there was a slight increase in these parameters at the fruiting stage compared to the heading stage, the differences were not statistically significant. This contrasts with the pattern observed in the soil medium, indicating that in the GPC medium, ryegrass root systems adopted specific strategies to adapt to this stressful environment. The main strategy involved increasing the root volume in the early stages of development: at the elongation stage, the total root length was 1.82 times that in the soil medium, the total root surface area was 1.91 times, and the root volume was 2.5 times. Furthermore, the GPC stress environment-induced changes in the branching status of ryegrass root systems in the early stages of growth. Specifically, at the elongation stage, the root tip number and branch number were significantly higher compared to the soil medium, indicating that in the GPC environment, plant root systems exhibited faster growth and more branching during this period, with a development trend towards fine roots. Combining the data from the three periods of growth, it can be observed that with the changing growth stages, the differences in morphological parameters of ryegrass root systems between GPC and soil media tended to decrease (Fig. 2), suggesting a gradual reduction in the impact of stress on the growth and development of ryegrass.
Table 12.
Effects of different growth stages on root basic characteristic parameters of ryegrass.
Table 13.
Root characteristic parameters of ryegrass at different growth stages under the soil medium.
[i] Notes: The values in the table are mean±standard deviation. A one-way ANOVA was carried out for the data set, and post hoc comparisons were conducted using the SPSS Tukey HSD test at P<0.05 level. Different letters indicated that different growth stages had significant differences at the p<0.05 level. n = 15.
Root Architecture Characteristics
The subtle differences in fractal dimension (FD) can effectively characterize significant variations in root branching patterns, with larger FD values indicating higher root system complexity. In the GPC medium, the FD values for the three growth stages were 1.472, 1.454, and 1.450, respectively. In the soil medium, the corresponding FD values were 1.450, 1.432, and 1.420. This suggests distinct fractal characteristics of the ryegrass root system at the elongation stage compared to the subsequent two stages. The FD values in the GPC medium were consistently larger than those in the soil medium (Fig. 3), indicating a relationship between root system complexity and medium type: FD (EG)>FD (CG).
Fractal abundance (FK) can characterize the extent of root system expansion in soil or other media. In the soil medium, the FK values of the GPC root system were minimal at the elongation stage and maximal at the fruiting stage, exhibiting a gradual increase with growth stages. The trend of FK values in the GPC medium was opposite to that in the soil medium, indicating that in the soil medium, plant root system growth expanded continuously with the growth stages. In contrast, in the GPC medium, the expansion peaked at the elongation stage, showing a larger extent of development.
Table 14.
Root characteristic parameters of ryegrass at different growth stages under GPC medium.
[i] Notes: The values in the table are mean±standard deviation. A one-way ANOVA was carried out for the data set, and post hoc comparisons were conducted using the SPSS Tukey HSD test at P<0.05 level. Different letters indicated that different growth stages had significant differences at the p<0.05 level. n = 15.
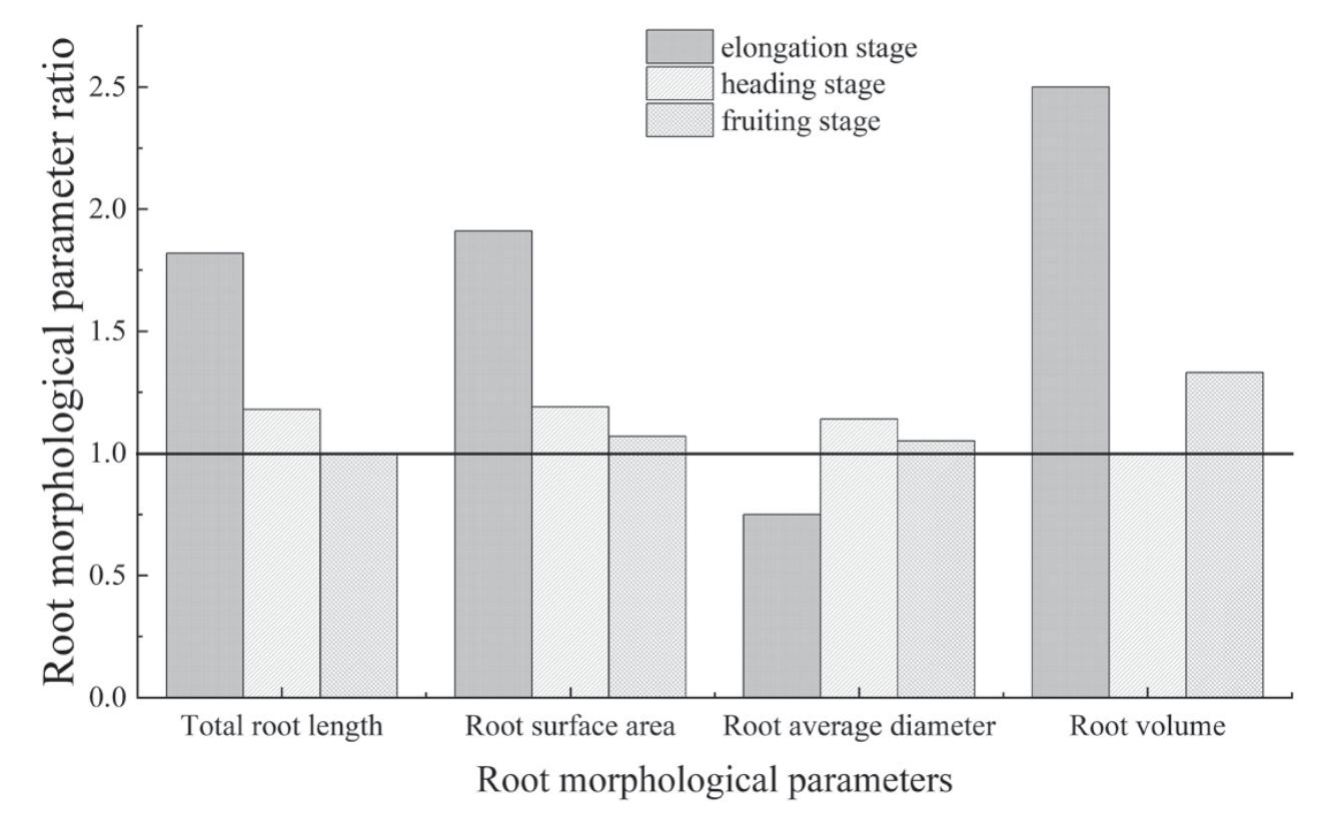
Fig. 3.
Fractal characteristics and topological structure changes of ryegrass roots at different growth stages under different media. A oneway ANOVA was carried out for the whole data set, and post hoc comparisons were conducted using the SPSS TukeyHSD test at P<0.05 level. Significant differences were indicated by different letters on the bars.
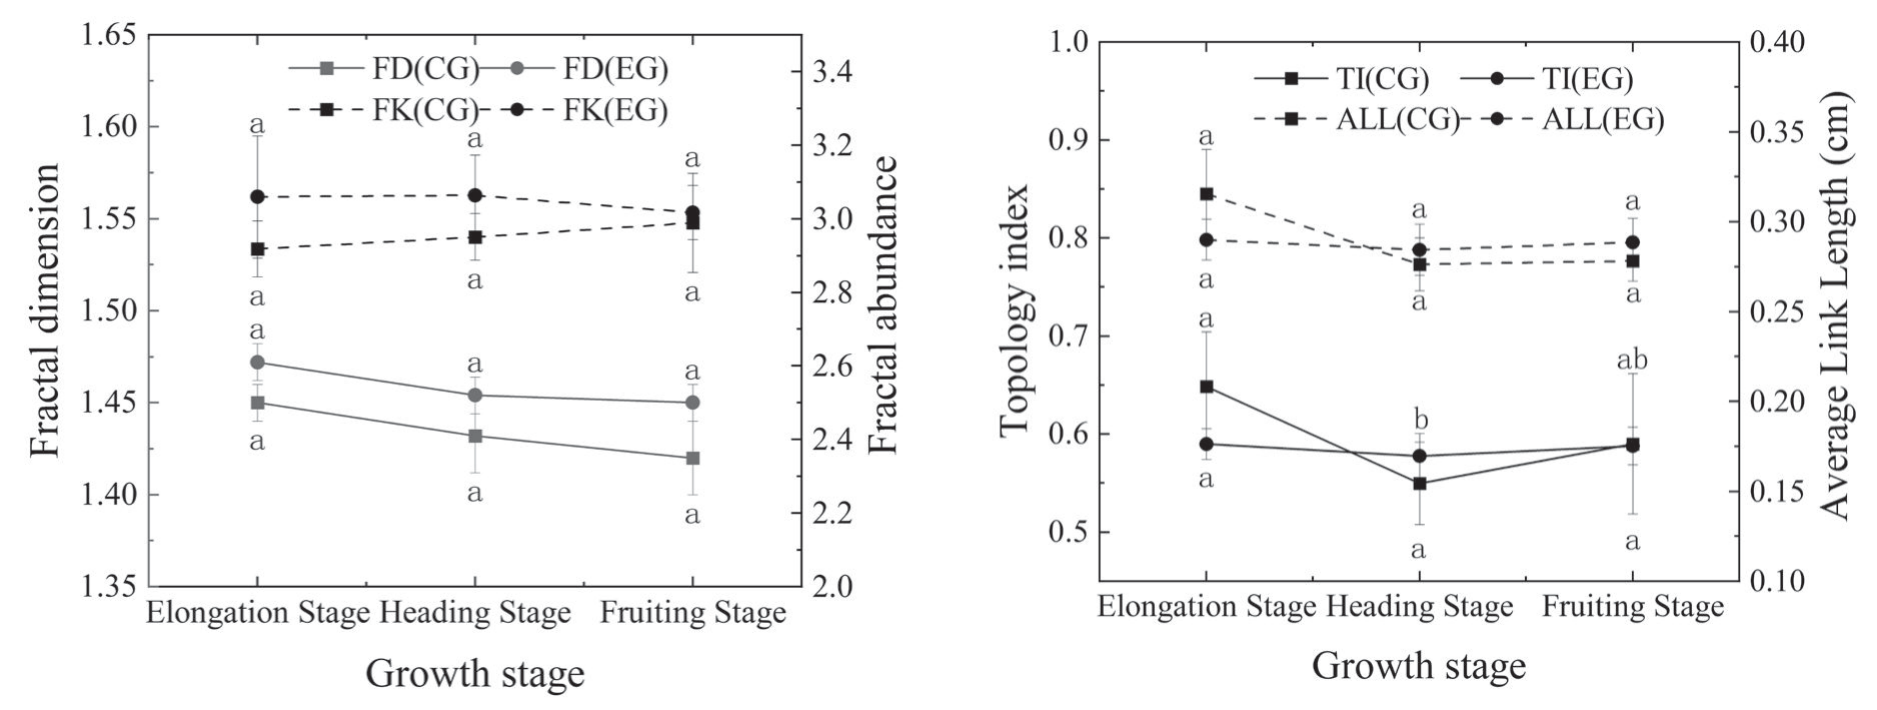
The topological index (TI) values closer to 0.5 indicate more external connections in the root system, suggesting a more complex branching structure with more secondary branches and a root system closer to a dichotomous branching pattern. The average link length (ALL) represents the average length between various nodes in the root system and characterizes the branching growth capability of the root system. A smaller ALL value corresponds to more branches on the lateral roots. The trends in TI and ALL of the ryegrass root systems in the two media were consistent, decreasing first and then increasing with growth stages, reaching their maximum at the elongation stage and minimum at the heading stage.
In the soil medium, the TI value at the heading stage significantly differed from the elongation stage (p<0.05). In contrast, in the GPC medium, there was no significant difference in TI values across growth stages. The TI value of the ryegrass root system in the GPC medium was closer to 0.5, indicating a branching pattern closer to a dichotomous branching model in this medium. There were no significant differences in ALL among the three growth stages in the GPC medium, suggesting a similar branching growth capability of the root system across these stages. At the elongation stage in the GPC medium, the root system exhibited a smaller ALL, indicating a more complex branching pattern and a richer presence of root hairs, consistent with the characteristics revealed by fractal analysis.
Correlation Analysis
To explore the differences in the correlation between root system configuration features and morphological parameters in two different media, Pearson correlation analysis was conducted on the configuration features and mean values of various morphological parameters during three growth stages. The results are as follows:
In the soil medium, the fractal dimension showed a significant positive correlation with root length, root volume, branch number, and branch density (p<0.05) (Table 15). It also exhibited a highly significant positive correlation with root surface area (p<0.01), with the highest correlation coefficient. Fractal abundance was significantly positively correlated with root length (p<0.05) and showed a highly significant positive correlation with root surface area (p<0.01). However, it demonstrated a highly significant negative correlation with root tip density (p < 0.01). In the GPC medium, the fractal dimension showed a significant positive correlation with root surface area and branch number (p<0.05) (Table 16). It exhibited a highly significant positive correlation with average diameter, root volume, average branching angle, and branch density (p<0.01). Fractal abundance showed a highly significant positive correlation with root length, root surface area, root volume, branch number, and crossing number (p<0.01), with a particularly high correlation coefficient of 0.84 with root surface area. Compared to the soil medium, the fractal dimension and fractal abundance of ryegrass roots in the GPC medium showed a stronger correlation with parameters such as branch density and branch number.
Table 15.
The correlation coefficients between root architecture parameters and morphological characteristics of ryegrass under soil conditions.
In the soil medium, the topological index showed a highly significant negative correlation with root tip number, root tip density, and branch density (p<0.01). The average connection length showed a highly significant negative correlation with root length, branch number, crossing number, and branch density (p<0.01) and a highly significant positive correlation with average diameter (p<0.01). In the GPC medium, the topological index showed no significant correlation with various root system characteristics. The average connection length showed a highly significant positive correlation with branch number, average branching angle, and branch density. The correlation analysis of root system configuration indicates that in the GPC medium, the main reason for plant root system configuration features changing is the increase in parameters such as branch number, branch density, and average branching angle.
Vertical Distribution of Root Morphology under Different Media
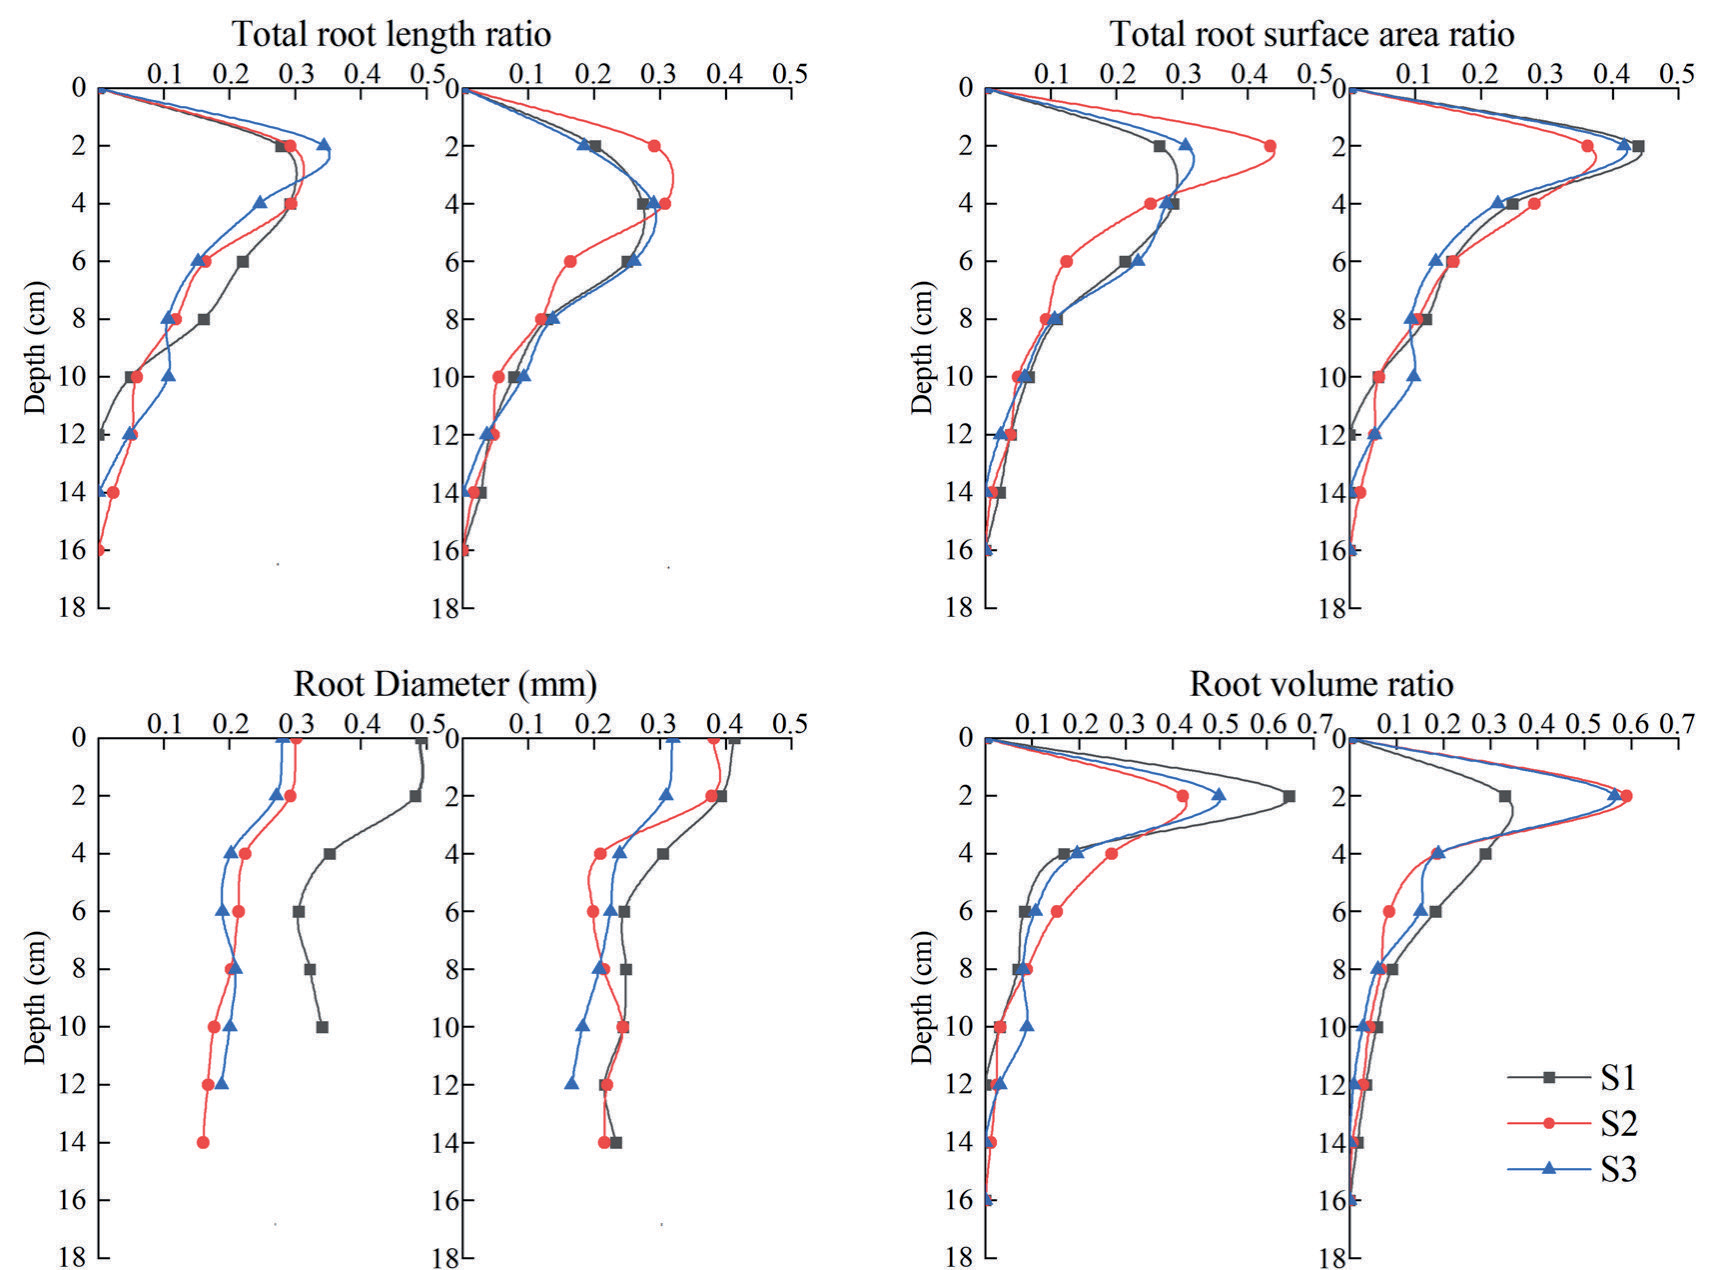
Based on the scanned images, the root system of ryegrass was segmented into intervals of 2 cm in length, and the frequency distribution of various morphological parameters along the vertical depth was illustrated in Fig. 4. The overall trends of total root length, root surface area, and root volume in both media were similar, with a significant proportion observed within the 0~6 cm depth range and sharply decreasing with increasing depth. Compared to the soil medium, the root system in the GPC medium exhibited deeper penetration, reaching up to 16 cm during the elongation stage. The peak value of root length in the soil medium occurred within the 0~4 cm range, and the proportion of total root length increased initially and then decreased with development over time. Root diameter ranged from 0.18 to 0.49 mm, showing a slight decrease with depth. In the soil medium, the average root diameter decreased with increasing development time, while this trend was not as evident in the GPC medium.
Discussion
Growth of Ryegrass at Different Growth Stages
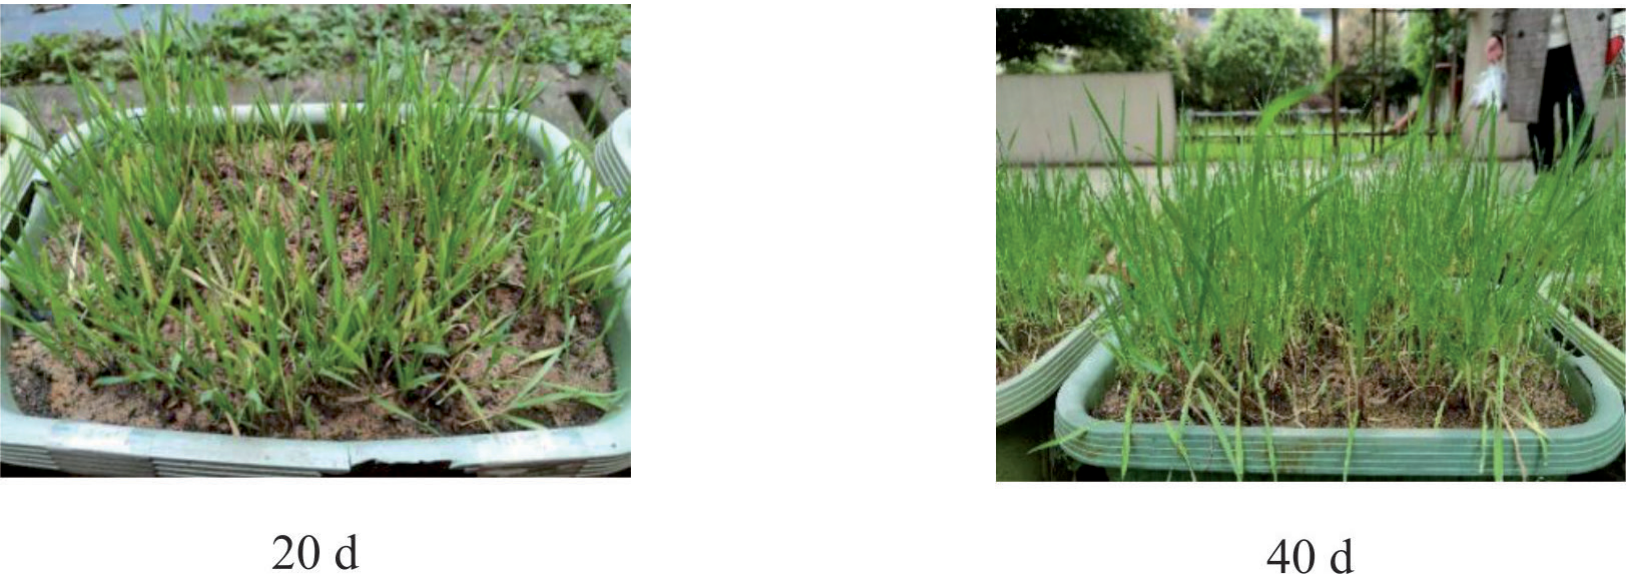
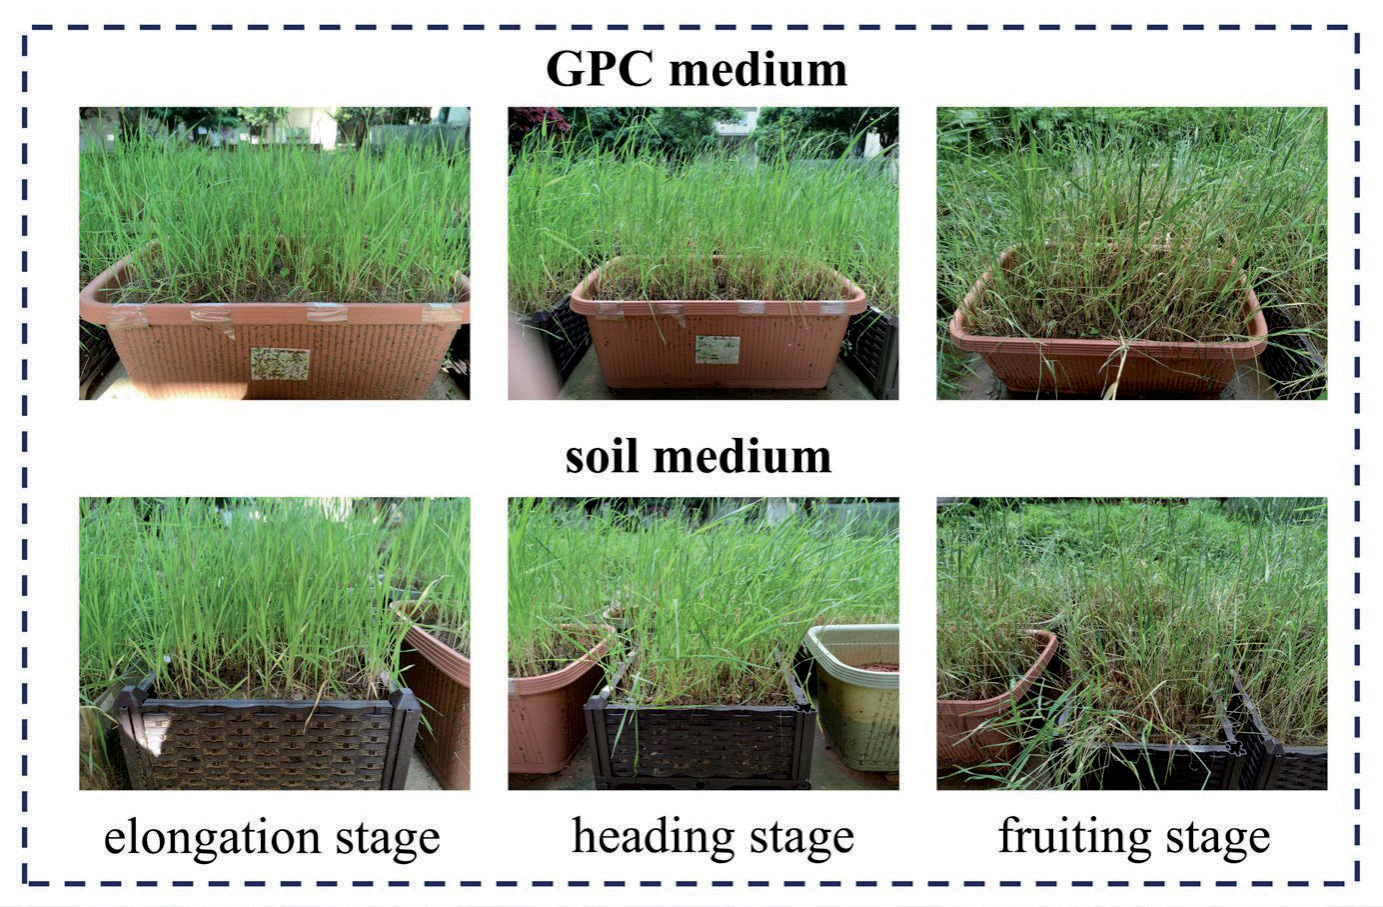
Photosynthesis is a crucial process for plant growth and biomass accumulation. It is well known that leaf yellowing is one of the early symptoms of plant heavy metal toxicity [23]. Additionally, chlorophyll content can indicate the extent of salt-alkali stress on plants [24]. When subjected to alkaline stress, the chlorophyll content of plants tends to decrease. In this experiment, the partial yellowing of plant leaves was observed in the experimental group of ryegrass from the second month after sowing (Fig. 5). As the plants continued to grow, they gradually recovered their green color. This suggests that the early growth of ryegrass in GPC media was subject to certain stress, as evidenced by leaf yellowing. However, this stress diminished over time, and the ryegrass adapted to the challenging environment of the GPC medium, as indicated by the regreening of the plants (Fig. 6).
Table 16.
The correlation coefficients between root architecture parameters and morphological characteristics of ryegrass in the grassplanting concrete medium.
Fig. 4.
Variation of characteristic root parameters of ryegrass with depth under different media. (a ~ d: soil medium; e ~ f: GPC medium; S1, S2, and S3 are ryegrass’s elongation, heading, and fruiting stages, respectively).
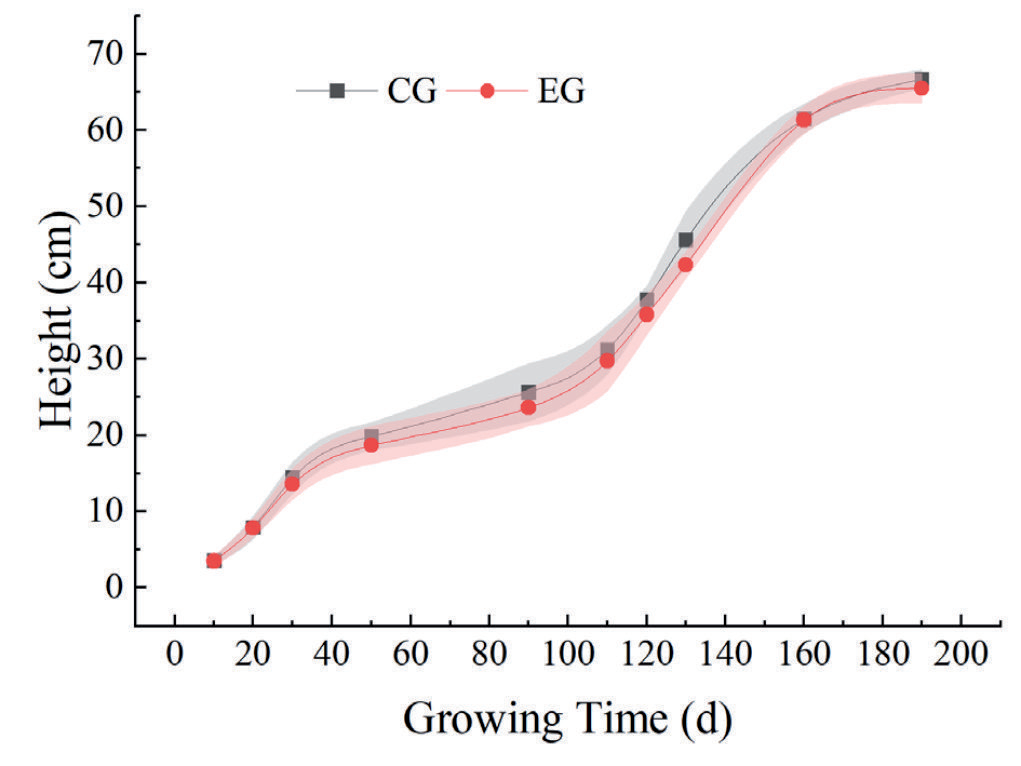
The growth difference between ryegrass stems and leaves under two growth media is insignificant. In this experiment, under conditions without additional fertilization in both the experimental and control groups, the average plant height at 190 days exceeded 60 cm. Specifically, in the GPC medium, the average plant height at 100 days was 32.8 cm, a result closely resembling the findings of Liu et al. [17]. Liu et al. observed a trend of rapid early growth followed by a gradual slowdown in the growth of five grass species within the first 100 days, consistent with the present experiment. The growth rate and height of ryegrass in the GPC medium were almost identical to those in the soil medium, as depicted in Fig. 7. This indicates that the compound alkali-reducing method effectively reduces the alkalinity of GPC to accommodate plant growth. \
Analysis of the Causes of Plant Growth Stress
Plant root systems exhibit plasticity, allowing them to adjust their structural morphology in response to external environmental changes and stressors [25]. Factors such as drought stress, saline-alkali stress, nutrient stress, and changes in soil particle composition can all lead to alterations in root system architecture. Adequate drought stress promotes the development of plant root systems, manifested by an increase in total root length, a decrease in root diameter, and a tendency for root growth toward a dichotomous branching pattern [26, 27]. Appropriate mixing of salt concentrations can enhance root elongation and increase root surface area, while high concentrations of saline-alkali exhibit a significant inhibitory effect on both root elongation and increased root surface area [28]. To some extent, nutrient stress promotes a shift in root system branching structure towards a dichotomous branching pattern characterized by more branches and a higher overlap of secondary roots [29]. Introducing objects with fixed shapes in the direction of root growth alters the trajectory of the root system, achieving a root control effect and promoting lateral root growth [30, 31].
The findings of this study indicate that, in the medium of GPC, most morphological indicators of ryegrass roots are greater than those in the soil medium, suggesting that GPC influences the growth of ryegrass to some extent. The large internal pore structure of GPC is prone to water loss, and the alkaline substances escaping from the concrete surface also exert certain stress on the growth of ryegrass. Low soil content in GPC creates an environment with low nutrients. The large particles in GPC, to some extent, play a role in physically controlling root growth. Therefore, the changes in the morphology of ryegrass roots under the GPC medium may be the result of the combined effects of factors such as drought stress, saline-alkali stress, nutrient limitation, and concrete skeleton restriction. It is necessary to further study the causes of plant growth stress in grass concrete medium.
Plant Adaptation Strategies under GPC Medium
Small differences in fractal dimension can lead to significant variations in root branching patterns [32]. A higher fractal dimension value indicates a more complex root system. Root architecture not only determines the position and expansion capacity of roots in the soil space but also influences how resources are acquired. The branching pattern and spatial occupancy of roots play a crucial role in nutrient absorption. The adaptability of plant root systems to their environment allows them to enhance their competitiveness for resources by altering fractal characteristics and topological structures.
Generally, under conditions of water or nutrient scarcity, root systems exhibit simpler branching patterns with smaller fractal dimensions. Conversely, under conditions of complexity, root systems display more intricate branching patterns with larger fractal dimensions. Fractal abundance is closely related to the spatial expansion capacity of root systems and their efficiency in absorbing water and nutrients. In this study, the average fractal dimension of ryegrass roots in the GPC medium was 1.46, higher than the fractal dimension in the soil medium (1.44). The average fractal abundance for the CG and EG groups in the three growth stages was 2.95 and 3.04, respectively, indicating a stronger spatial expansion capacity of root systems in the GPC medium. The large pore structure of GPC provides space for plant root growth. Ryegrass roots in the GPC medium, by increasing fractal dimension and fractal abundance, construct a more complex root system to ensure efficient nutrient absorption.
The topological index quantifies the branching pattern of the root system, and differences in the branching pattern reflect variations in the way and capacity of plants to absorb soil nutrients. This study revealed that the topological index of ryegrass roots was highest during the elongation stage in two different media, decreasing during the heading stage. The average connection length shortened, indicating that within root channels of the same length, there were more branching nodes. Specifically, there were a greater number of root hairs on lateral roots, suggesting a branching pattern approaching a dichotomous structure. Ryegrass roots adopt a strategy of increasing secondary branches and expanding the number of branches within a limited space to increase the absorption area.
Plant Adaptation Strategies under GPC Medium
The physicochemical properties of soil, such as moisture content, soil aeration, and soil fertility, directly impact the growth and distribution of crop roots. Plants enhance water use efficiency by increasing the input of root biomass [33]. Even when the pore water content in the soil filled with GPC is still lower than that in pure soil layers, GPC alters the spatial structure and nutrient composition of the soil, thereby influencing the vertical distribution of roots in the soil profile. During the early development of ryegrass, the soil medium provides ample nutrition, causing the roots to preferentially occupy the shallow soil layer. Under the stress of GPC, the maximum penetration depth of roots is 16 cm, exceeding the 12 cm in the soil alone. As the roots grow and develop during the heading and fruiting stages, the distribution of root length is essentially the same in both media because many roots have penetrated the GPC to access nutrients in the underlying soil. Experimental data indicate that the peak value of root length in the soil medium occurs in the depth range of 0-2 cm, while in the GPC medium, the peak value of root length occurs in the depth range of 2-4 cm. Considering the 2 cm thickness of the surface cover soil in the GPC in this experiment, it is evident that the total length proportion of ryegrass roots increases when in contact with GPC blocks. In the GPC medium, ryegrass branches more, consistent with the discussion above.
Conclusions
This study investigates the root system under the medium of Grass-Planting concrete (GPC) and compares the growth of ryegrass in GPC and soil media during different growth stages. The research findings indicate:
(1) GPC imposes a certain level of stress on plant growth, and this stress tends to diminish as the plants develop.
(2) The factors contributing to stress in the GPC medium may result from the combined effects of factors such as drought stress, saline-alkali stress, nutrient limitation, and the restriction imposed by the concrete skeleton.
(3) The findings of this study indicate that to adapt to the stressful environment of GPC, ryegrass employs strategies such as increasing root length, growing downward, and enhancing nutrient absorption capacity by increasing secondary branches and expanding the number of branches. This responsive strategy is particularly pronounced during the elongation stage.
Based on the research results, several recommendations for the study of vegetative performance in GPC are proposed: 1) Early stress in GPC is apparent, and attention should be focused on the early growth and development of plants.
2) The combination of plant physiological indicators and root morphology parameters can provide a more comprehensive understanding of plant growth in GPC, serving as a basis for further exploration of the growth characteristics of plants in the GPC medium.

