

Introduction
The tripartite cooperation among government, residents, and enterprises in waste separation is essential in promoting waste separation and is an essential part of cooperative governance in Chinese society [1]. However, there are issues, including poor government guidance, opposing cognitive goals of residents and businesses, the tendency of businesses to speculate, a lack of incentive on the part of everyone to engage in cooperative cooperation, and decreased effectiveness. The above problems have prompted the government to shift its function from the guidance and coordination of “coordinator” to the supervision and management of “key players” in collaborative cooperation. Therefore, the new cooperative model of “government supervision + enterprise leadership + national participation” is essential and urgent to promote the development of waste separation in China.
Whether international or inter-organizational, waste separation cooperation must cross the original framework’s boundaries and involve multiple stakeholders in the cooperative system [2, 3]. The government, residents, and enterprises are its sequential parameters in the cooperative waste separation system. Furthermore, the three are interconnected and mutually constrained, showing a synergistic movement, expressed as the self-organized movement of the cooperative waste separation system at the macro level. When disturbances occur in the cooperative system (new technology, policy changes, etc.), the game is played among the sequential parameters (government, residents, and enterprises), and finally, only one sequential parameter dominates the whole system and reaches a macroscopic situation of synergy [4]. Therefore, by establishing the cooperative mechanism of waste separation, the government, residents, and enterprises can realize the evolution of the cooperative waste separation system in an orderly goal, structure, organization, and function.
The evolutionary game approach is used to study the cooperative mechanism of the government, residents, and enterprises in waste separation, mainly due to the properties of public goods, pollution generated by waste, and the non-competitive and non-exclusive nature of waste, as well as the “Pareto improvement” and “Prisoner’s dilemma” arising from the cooperative process of waste separation. At the same time, the finite rationality hypothesis in evolutionary game theory is relatively consistent with the requirement of cooperation and synergy among the sequential parameters (government, residents, and enterprises) in waste separation cooperation. In the process of collaborative cooperation, the game of stakeholders in the waste separation system is a stochastic and repetitive game process of joint learning so that the replicator dynamics mechanism can model the adjustment process of stakeholders’ strategies. Therefore, the use of evolutionary game analysis can reflect the evolutionary paths and stable strategies of stakeholder behavior, which is essential for unleashing the power of cooperation and synergy to meet the challenges of the new era while effectively achieving waste separation.
In summary, this study aims to establish an effective government-resident-enterprise cooperative mechanism for waste separation based on the cooperation between the government-resident-enterprise of waste separation, the synergistic system theory, and the assumption of a finite rational man. In addition, this study attempts to construct a collaborative governance mechanism for waste separation in the whole society through an evolutionary game model, explore the conditions for forming this mechanism, and provide a theoretical basis for the efficient operation of waste separation.
Literature Review
Waste Separation Cooperation
(1) Inter-international cooperation. The international-level cooperation is mainly focused on the field of hazardous waste. In treating highly concentrated, radioactive nuclear reactor wastes, the effect of a single country treating such hazardous wastes is often limited due to the limitations of technology, natural resources, and human resources. The United States and Russia are engaged in a cooperative program to separate highly concentrated, radioactive nuclear waste. Meanwhile, the U.S., E.U., Russia, Japan, Korea, and Norway fund the Moscow International Science and Technology Center, whose primary function is to study high-level nuclear reactor waste disposal. In recent years, the need for ODA policy optimization has grown in the context of growing development inequalities between the Northern and Southern hemispheres. In order to promote efficient ODA planning, the Mongolian official and the Korean institution KOICA started an international cooperation program on waste separation [5].
(2) Inter-organizational cooperation. Cooperation in waste separation first appeared in Europe and the U.S. In 1982, the U.S. EPA introduced the Resource Conservation and Recovery Act (RCRA) and explored state authorization programs for RCRA. However, the EPA lacked the administrative capacity and knowledge of local conditions to implement RCRA independently; the states lacked the research capacity to develop complex regulations. Thus, environmental protection from hazardous waste requires federal and state cooperation in hazardous waste disposal. Sweden, Denmark, and Australia have established several joint municipal partnerships in which municipalities are responsible for waste planning and disposal. In Ukraine, cooperation between housing organizations and housekeepers for waste separation has been promoted based on the experience of European and American countries. In Southeast Asian countries, India, Thailand [6, 7], Malaysia [8], Indonesia [9], and Vietnam [10, 11] have suggested the establishment of public, private, and community sector cooperation in economic, social, cultural, and environmental aspects to obtain appropriate forms of waste management practices. Also under the spotlight are a collaboration between waste recycling startups and their peers [12] and collaboration between product manufacturers and users [13]. Latin American countries such as Guatemala, Brazil [14], and Bolivia [15] have developed government, community (council), NGO, citizen, and private sector waste separation partnerships. China has implemented a public-private partnership where the government purchases public services from enterprises [16].
(3) Special types of waste. Particular types of waste differ from ordinary household waste; their treatment practices have unique requirements and different cooperation paradigms.
a) Organic waste. The food waste generated in Japan can be used to compost community gardens, and a cooperative mechanism between gardeners and kitchen waste providers should be established [17]. We have established stakeholder collaboration mechanisms based on partnerships in the food supply chain to improve food loss and waste [18, 19].
b) Plastic waste. Plastic waste is characterized by its inability to degrade naturally, its high volume, and its high hazard.” Greening Africa Together, an interdisciplinary, international collaboration on plastic waste, is actively seeking solutions in collaboration with community stakeholders. [20, 21]. Japan and Malaysia collaborate to address plastic waste by strengthening extended producer responsibility and collaborating to establish joint eco-towns through regional policy platforms [22].
c) Medical waste. They improved medical waste performance through patient collaboration with relatives, non-relatives, community health volunteers, and community leaders [23].
Synergy Mechanism
(1) Cultural origins. Due to North America’s multi-ethnic and multicultural nature, Ruth Benedict [24] introduced the concept of “synergy” in her lectures to solve the problem of cultural conflicts. Abraham [25] further developed a dynamic model of social synergy to solve the synergy problem in emerging countries’ international relations.
(2) Theory development. Problem-solving often requires crossing boundaries, for example, between disciplines. However, when policymakers call for “interdisciplinarity”, they often mean “synergy”. “Synergy” occurs when the whole offers more possibilities than the sum of its parts [26]. The concept of “synergy” has semantic features: interdisciplinary orientation of scientific research, synergistic effects, and joint actions [27], and the boundaries between them are not always clear. Moreover, it seems that synergy should be more deeply penetrated into economics research [28]. However, synergies across disciplinary boundaries necessarily involve more stakeholders [29]. The “stakeholder synergy” perspective can identify new value creation opportunities that are particularly effective in strategic terms. The “stakeholder synergy” perspective extends stakeholder theory further into the strategic arena and provides insights to achieve broader value creation that is more likely to generate sustainable competitive advantage [30].
(3) Natural disciplines. The idea of synergistic action of multiple drugs has long been an essential issue in the biological and medical community. Especially for complex diseases, combining multiple drugs can be incredibly beneficial compared to treating a single drug alone. Combinations that achieve “more than the sum of their parts” are synergistic [31]. However, synergy is not limited to biology [32] and medicine. These ideas have also been developed in many different disciplines. Roell [33] discuss the various terms surrounding the concept of synergy, providing a comprehensive list of terms that span many disciplines.
(4) Social governance. The idea of “synergy” is also fully reflected in social governance. Climate change policies such as renewable energy, energy efficiency management, afforestation, and coal and forest biomass power generation must align with national development goals and focus on synergies [34]. The exact “synergy” is needed in livelihoods. U.S. child welfare policies are conducive to preventing child abuse but also focus on systemic synergies promoting safe and equitable care [35]. In addition, “corruption control + political stability” in concert with industrial development can contribute to income equity in Africa [36].
(5) Economic management. The value of inter-firm mergers and acquisitions in business activities comes from the synergistic combination of acquirer and target [37]. Acquisitions can significantly reshape inter-organizational networks by combining previously independent nodes and allowing the acquirer to inherit relationships from the target company, potentially creating network synergies. Network synergies refer to the combination of the networks of the acquirer and the target through nodal collapse, allowing the acquirer to gain control over the existing relationships of the target, thus placing the merged firm in a more favorable structural position [38]. Similarly, innovation and exporting are potent drivers of firm competitiveness in business activities. Therefore, models have been constructed to assess the synergistic effects of firms’ innovation and export capabilities, which can be a beneficial tool for firms to enhance their innovation and export capabilities [39]. However, there is also a need for “synergy” in the firm’s internal activities. For example, a synergistic approach to production management can ensure sustainable and efficient operations. Production management criteria and indicators have been proposed to determine the level of synergistic efficiency of management. Individual elements of synergy may also have an impact on the financial results of the enterprise. The synergistic approach to production management can be used by management to make business management decisions and development plans [40].
The above research has significant theoretical value and practical significance for cooperative waste separation, but there are still some problems. (1) Most researchers only consider residents and enterprises as two game subjects. The government is only introduced into the study as an external variable. It does not regard the government as the same game subject as residents and enterprises. (2) The benefits brought to residents and enterprises by the government as a game subject are not considered comprehensively. Only the role of government subsidies is often considered, ignoring the cost of cooperation reduced by policy support brought by the government as a game subject. (3) The effect of the willingness to participate on the strategy choice is not considered among the cooperative game subjects.
Therefore, this paper adds the government as the cooperative body of waste separation into the game model, considers the influence of policy support on the cooperative cooperation of waste separation, and analyzes the new cooperative mechanism of “government supervision + enterprise leadership + universal participation” by constructing a tripartite game payment matrix of government, residents, and enterprises. The new mechanism of waste separation cooperation can accelerate the sustainable and high-quality development of China’s population, resources, and environment by analyzing the influence of relevant parameters on the cooperative strategy of the three parties through numerical analysis.
Materials and Methods
Assumptions of the Model
(1) Participating subjects. In the evolutionary game of government-civil-enterprise cooperation in waste separation, there are three types of actors involved: government (G), residents (R), and enterprises (E). The government mainly provides different incentives and supervision mechanisms for residents and enterprises to promote cooperation in waste separation; in the cooperation of waste separation, residents mainly carry out source separation of waste; enterprises mainly provide waste separation services and technical support for waste separation. The three parties are finite rational in waste separation cooperation. The optimal and stable strategy is achieved through multiple games.
(2) Cooperation strategy. In collaborative cooperation in waste separation, residents can have two strategies, i.e., cooperate with enterprises and not cooperate with enterprises. Their strategy set is cooperation and non-cooperation. Enterprises also have two strategies, i.e., cooperating with residents and not with residents. Their strategy set is cooperation and non-cooperation. The government also has two strategies, i.e., participate in the collaborative cooperation between the two sides and not participate in the collaborative cooperation between the two sides. Their strategy set is participation and non-participation. Therefore, let y and z be the probabilities of residents and firms cooperating, respectively, and 1-y and 1-z the probabilities of residents and firms not cooperating. Let x be the probability of the government participating in the two-party cooperation, and 1-x be the probability of the government not participating in the two-party cooperation. x, y, and z [0,1].
(3) Cost of cooperation. Although the government will not directly participate in the cooperative cooperation of waste separation, it can formulate preferential policies for the cooperative cooperation of residents and enterprises and supervise the whole cooperative process of waste separation, which generates supervision cost CG; residents and enterprises, as the main participants of the cooperative cooperation, must invest human and material costs, which jointly generate total cost C. When the government chooses to participate in the cooperative cooperation, the supportive policies formulated will make the total cost of cooperation lower. The decrease factor is d (0≤d≤1). When the government chooses to participate in collaborative cooperation, the support policy will reduce the total cost of collaborative cooperation by d (0≤d≤1). The total cost of collaborative cooperation between residents and enterprises is dC. The total cost-sharing factor between residents and enterprises is b, and the cost shared by residents is bdC or bC; the cost shared by enterprises is (1-b)dC or (1-b)C. The government will give some funds directly subsidized by the residents and enterprises of collaborative cooperation. The government needs to bear the incentive cost S. The incentive cost allocation coefficient is e (0≤e≤1), and the subsidy portion shared by the residents is eS. The subsidy portion shared by the enterprises is (1-e)S.
(4) Benefits of cooperation. U4 denotes the gain when the government participates in the cooperative cooperation between residents and enterprises, U2 denotes the gain when the government does not participate in the cooperative cooperation between residents and enterprises, and U1 and U3 denote the initial gain before the cooperative cooperation between residents and enterprises in waste separation, respectively. The additional gain is U5, when both residents and enterprises choose to cooperate. The distribution coefficient of this additional gain is a (0≤a≤1); that is, residents get the part of aU5; enterprises get the part of (1-a) U5.
(5) Penalty for breach of contract. Under the supervision of the government, one should avoid situations where one of the residents and the enterprise cooperate. One of the defaults causes losses to the other when the residents choose not to participate in the cooperative cooperation, and the enterprise chooses to participate, the residents need to pay a specific default penalty P1 to the enterprise; when the residents choose to participate in the cooperative cooperation and the enterprise chooses not to participate, the enterprise needs to pay a specific default penalty P2 to the residents.
Build a Payment Matrix
In the model, the government, residents, and enterprises choose the corresponding strategies according to their wishes. The payment matrices of the government-civil-enterprise waste separation cooperative game are shown in Tables 1 and 2. The residents’ participation constraint is reflected in the default payment P1 in the table. The incentive constraint is reflected in the distribution coefficient e of the additional benefits obtained by participating in the cooperative game; the enterprises’ participation constraint is reflected in the default payment P2, and the incentive constraint is reflected in the distribution coefficient 1-e of the additional benefits obtained by participating in the cooperative game.
Therefore, the payment matrix of a tripartite game can be obtained from the above assumptions, as in Table 1 and Table 2.
Table 1.
Payment matrix of the cooperative game for waste separation with government participation.
Earnings Expectation Function Construction
According to Tables 1 and 2, the expected return EG1 for the government’s “participation” strategy, EG2 for the “non-participation” strategy, and EG3 for the government’s average expected return in the game are:
The expected return ER1 for residents choosing the “cooperation” strategy, the expected return ER2 for the “non-cooperation” strategy, and the average expected return ER3 in the game are:
The expected return EE1, the expected return EE2, and the average expected return EE3 of the firm choosing the “cooperation” strategy in the game are:
Stable Evolutionary Strategy Solving
From the above analysis, the government replication dynamic Equation (1) is obtained:
(1)
Resident replication dynamic Equation (2):
Enterprise replication dynamic Equation (3):
(3)
Linking Equations (1), (2), and (3) yields the government, residential, and business replication dynamics system:
(4)
According to the method proposed by Friedman [41], the evolutionary stability strategy (ESS) of the system of differential equations can be known from the local stability analysis of the Jacobian matrix. The Jacobi matrix of the system can be obtained from Equation (4):
(5)
In system (4), such that F(x) = F(y) = F(z) = 0, eight local equilibrium points E1 (0, 0, 0), E2 (0, 0, 1), E3 (0, 1, 0), E4 (0, 1, 1), E5 (1, 0, 0), E6 (1, 0, 1), E7 (1, 1, 0), and E8 (1, 1, 1) can be obtained. According to evolutionary game theory, the equilibrium point that satisfies the Jacobian matrix when all eigenvalues are non-negative is the evolutionary stability strategy (ESS).
Equilibrium Point Stability Analysis
First, analyze the case of E1 (0, 0, 0) when the Jacobian matrix:
The eigenvalues of the Jacobi matrix are λ1 = -U1, λ2 = -U1, and λ3 = P1-(1-b)C. By substituting the other seven points into Equation (5), the eigenvalues of the Jacobi matrix of the corresponding equilibrium points can be obtained, as shown in Table 3.
In this paper, to facilitate the analysis of the signs corresponding to different eigenvalues and with generality, the following assumptions are made: eS- (1-e)S-U2>0; aU5+P1-bC>0; (1-a)U5+P2-(1-b)C>0. The net benefits of collaborative cooperation among the government, residents, and enterprises in waste separation outweigh the net benefits of non-cooperative cooperation.
(1) When P1-(1-b)C<0, i.e., the default amount paid by the resident to the firm is less than the cost shared by the firm under the government non-participation strategy. The discussion is divided into four scenarios.
Scenario 1, when bC-bdC-U1<0 and (1-b)dC-(1-e) S-P1>0, i.e., the difference between the residents’ shared costs under the two government strategies is less than the residents’ initial benefits without collaborative cooperation, and the difference between the firms’ shared costs and the government subsidies received under the government participation strategy is more significant than the default payments paid by the residents to the firms.
Scenario 2, when bC-bdC-U1<0 and (1-b)dC-(1-e) S-P1<0, i.e., the difference between the residents’ shared costs under the two government strategies is less than the residents’ initial benefits without collaborative cooperation, and the difference between the residents’ shared costs and the government subsidies received by the firms under the government participation strategy is less than the default amount paid by the residents to the firms.
Scenario 3, when bC-bdC-U1>0 and (1-b)dC-(1-e) S-P1>0, i.e., the difference between the residents’ shared costs under the two government strategies is greater than the residents’ initial benefits without collaborative cooperation, and the difference between the residents’ shared costs and the government subsidies received by the firms under the government participation strategy is more significant than the default amount paid by the residents to the firms.
Scenario 4, when bC-bdC-U1<0 and (1-b)dC-(1-e) S-P1<0, i.e., the difference between the residents’ shared costs under the two government strategies is only less than the residents’ initial benefits without co-optation, and the difference between the residents’ shared costs and the government subsidies received by the firms under the government participation strategy is less than the default amount paid by the residents to the firms.
Table 4 shows that the Jacobi matrix’s eigenvalues corresponding to the equilibrium points E1 (0, 0, 0) and E8 (1, 1, 1) are non-positive. In this case, the system has two stable points, E1 (0, 0, 0) and E8 (1, 1, 1), corresponding to the evolutionary strategies (non-participation, non-cooperation, non-cooperation) and (participation, cooperation, and cooperation).
Table 3.
Eigenvalues of the Jacobi matrix.
Table 4.
Local stability of equilibrium points.
(2) When P1-(1-b)C>0, i.e., the default amount paid by the residents to the firm is greater than the cost shared by the firm under the government non-participation strategy. The discussion is also divided into the above four scenarios. Since the analysis results at points E3, E4, E5, E6, E7, and E8 are consistent, Table 4 lists the stability analysis results for points E1-E2.
Table 4 shows that the Jacobian matrix’s eigenvalues corresponding to the equilibrium point E8 (1, 1, 1) are non-positive. In this case, the system has only one stable point, E8 (1, 1, 1), which corresponds to the evolutionary strategy of (participation, cooperation, and cooperation).
Results and Discussion
Date and parameter values
Chengdu City, Sichuan Province, has explored a new urban waste separation method of “government supervision + enterprise leadership + universal participation” in the promotion of building waste separation pilot, recycling enterprises, and building enterprises to “Internet +” model cooperation, and relying on the third-party Internet service platform, the establishment of green accounts for waste separation participants, the implementation of green contribution value incentive mechanism; in the residential community waste separation pilot, households and environmental protection companies and other collaboration. Each household sets up a waste Q.R. code. The sanitation company motivates residents by sweeping the code for points to enhance their environmental awareness.
The new model of urban waste separation has a standard feature, that is, led by enterprises, the use of Internet technology to manage the separation, and the establishment of effective incentive mechanisms, and ultimately to make the public develop good habits of waste separation and enhance the environmental awareness of all. The successful operation of the new pilot model of “government supervision + enterprise leadership + universal participation” has dramatically enhanced the environmental awareness of residents, from which we can see the vast development space for waste separation and disposal. It is expected that the new model will cover the whole country. It will be extended to the county and rural areas to make the living environment more clean and hygienic.
By establishing the “government supervision + enterprise leadership + national participation” model of waste separation, the annual output of domestic waste is about 5.8 million tons, of which recyclables account for about 41%. According to the Chengdu Urban Management Committee statistics, by the end of July 2021, 824,000 households participated in domestic waste separation, accounting for about 15% of the households in the city. More than 2,900 residential communities, schools, and organizations participated, reaching about 1 million households in 2021 and achieving the goal of zero landfills of primary domestic waste in 2022.
In this paper, the initial values of the parameters in the payment matrix are assumed to be based on the actual situation of collaborative waste separation cooperation in Chengdu, Sichuan Province, as shown in Table 5.
This paper uses Matlab 2019a software to simulate the dynamic evolutionary game process of strategy selection under different initial conditions of government, residents, and enterprises through the above case study and setting initial parameters. The simulation results discuss the initial willingness to participate subjects, the degree of government support, the cost-sharing coefficient, additional benefits, and their allocation coefficients.
Sensitivity Analysis
The Evolutionary Impact of Tripartite Willingness on Synergistic Cooperation
Fig. 1a) shows a simulation of the impact of simultaneous changes in the initial willingness of the government, residents, and enterprises to participate in collaborative cooperation, with other parameters held constant. Assuming that the initial willingness of government, residents, and enterprises is the same, i.e., x = y = z = 0.5, we can see from Fig. 1a) that the zero boundaries of the willingness of the three parties are between 0.4 and 0.5. When the initial willingness of x, y, and z are all less than the critical value, x, y, and z converge to the point (0, 0, 0); at this time, the enterprises participating in the entire competition in the market converge faster than residents and the government, and the government converges the slowest. This is because the market least influences the government and has natural administrative properties; when the initial willingness x, y, and z are more significant than the critical value, x, y, and z converge to the point (1, 1, 1); however, when the initial willingness is at a moderately low level, the willingness of enterprises directly falls faster, the willingness of residents and the government first rises and then falls, in which the residents’ willingness rises slightly and then resumes falling faster than the government. There is a slight rise followed by a slow decline, finally converging at the point (0, 0, 0); when the willingness of all three parties to participate is more significant, the government, residents, and enterprises will directly rise and converge at the point (1, 1, 1). The simulation results show that as the initial willingness x, y, and z increases, x converges to 1 more slowly, and y and z converge to 1 more quickly. Eventually, all three parties tend to participate in the collaborative cooperation because residents and enterprises are more sensitive to the benefits and expenditures in terms of the public service category of waste separation collaborative cooperation. In contrast, the government is less sensitive to the benefits due to its public service provision attributes and policy-oriented reasons. The government is less sensitive to the benefits and expenditures due to its public service attributes and policy orientation.
Table 5.
Parameter assignment.
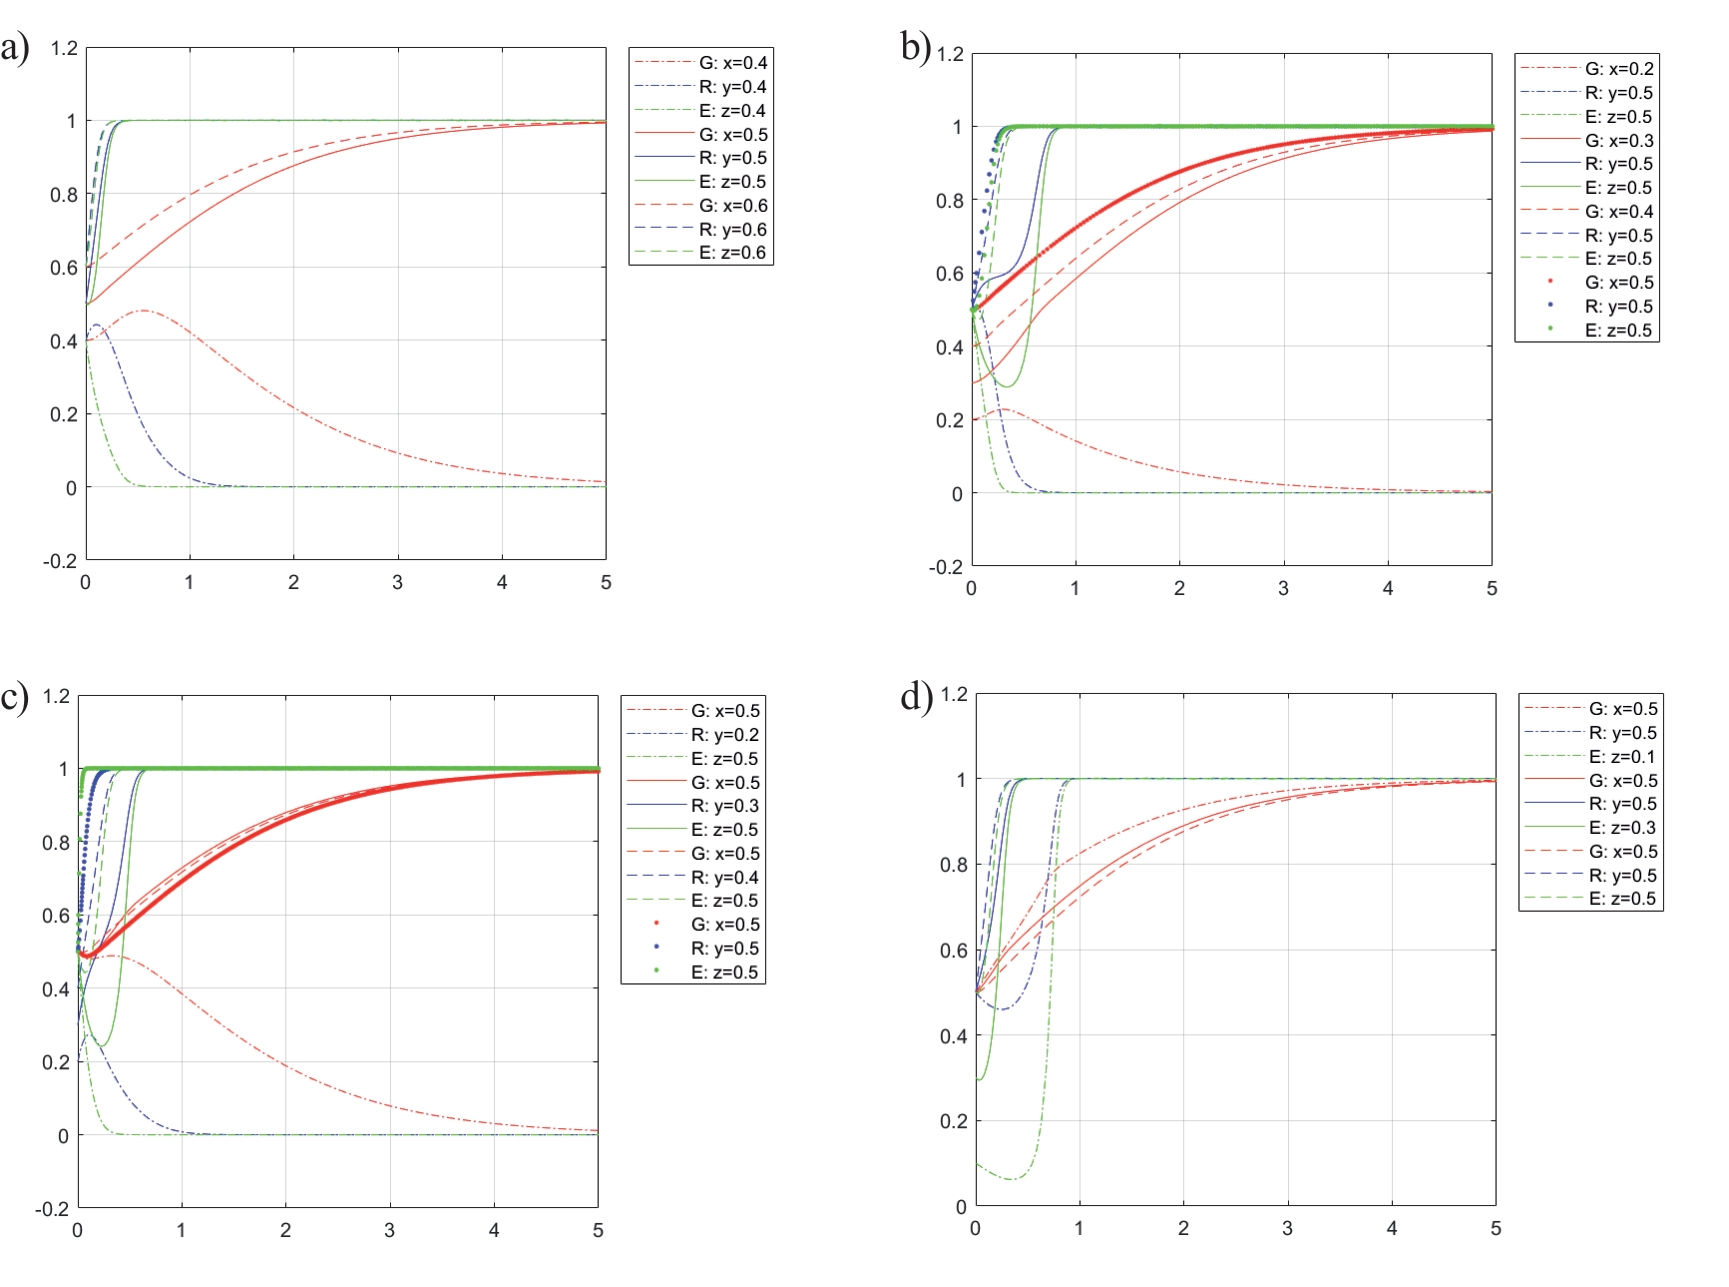
Fig. 1b) shows the simulation of the effect of the change of the initial willingness x of the government on the collaborative cooperation strategy of residents and enterprises to participate in waste separation, with other parameters held constant. From Fig. 1b), when the initial willingness of residents and universities is at a medium level, the critical value of government initial willingness x is between 0.2 and 0.3. When x is less than this critical value, y and z converge to 0, and the final curve converges to the point (0, 0, 0). At this time, the increase of x makes y and z converge slowly, and z converges faster than y. When x is more significant than this critical value, y and z converge to 1, and the final curve converges to the point (1, 1, 1). The final curve converges to the point (1, 1, 1) when x increases and z converges slower than y. When the willingness to participate in x is moderately low (x = 0.3), the y curve rises first. It then goes through a short, smooth period before finally converging to 1.
Fig. 1c) shows the simulation of the effect of the change in the initial willingness y of the residents on the government and enterprises’ participation in the synergistic cooperation strategy with other parameters held constant. Fig. 1c) shows that when the initial willingness of government and enterprises is at a medium level (x = z = 0.5), the critical value of residents’ initial willingness y is between 0.2 and 0.3. When the value of y is less than this critical value, the curve converges to the point (0, 0, 0), at which y rises and then falls, x first smooths for a period and then falls, z directly falls, and finally, all converge to 0; when y is more significant than this critical value. The simulation results show that with the increase in residents’ initial willingness y, the enterprises’ willingness to participate grows gradually stronger. Finally, they all choose the cooperative strategy. The cooperation strategy does not change significantly during the government’s willingness to participate. Since market factors mainly influence enterprises, the residents’ willingness to participate becomes more significant, the participation becomes higher, and enterprises feel the market change and change with it; market change factors less influence the government due to the provision of public services and administrative attributes.
Fig. 1d) shows the simulation of the impact of the change in the initial willingness of enterprises z on the government and residents’ participation in the collaborative strategy, with other parameters held constant. As can be seen from Fig. 1d), when the initial willingness of enterprises z is at a low level (z = 0.1), the y and z curves all fall briefly and then rise rapidly and finally converge to 1, and the equilibrium point converges to the point (1, 1, 1); when the initial willingness of enterprises z gradually increases to a medium level, the y and z curves converge significantly faster. The x curves converge slower than the low level of the initial willingness of enterprises z, but the overall change is not significant. The simulation results show that when the initial willingness of enterprise z is low, the government will increase its participation and use policy support to promote cooperation between residents and enterprises. When the initial willingness of enterprise z gradually increases, the government only needs to participate less to make the residents and enterprises cooperate.
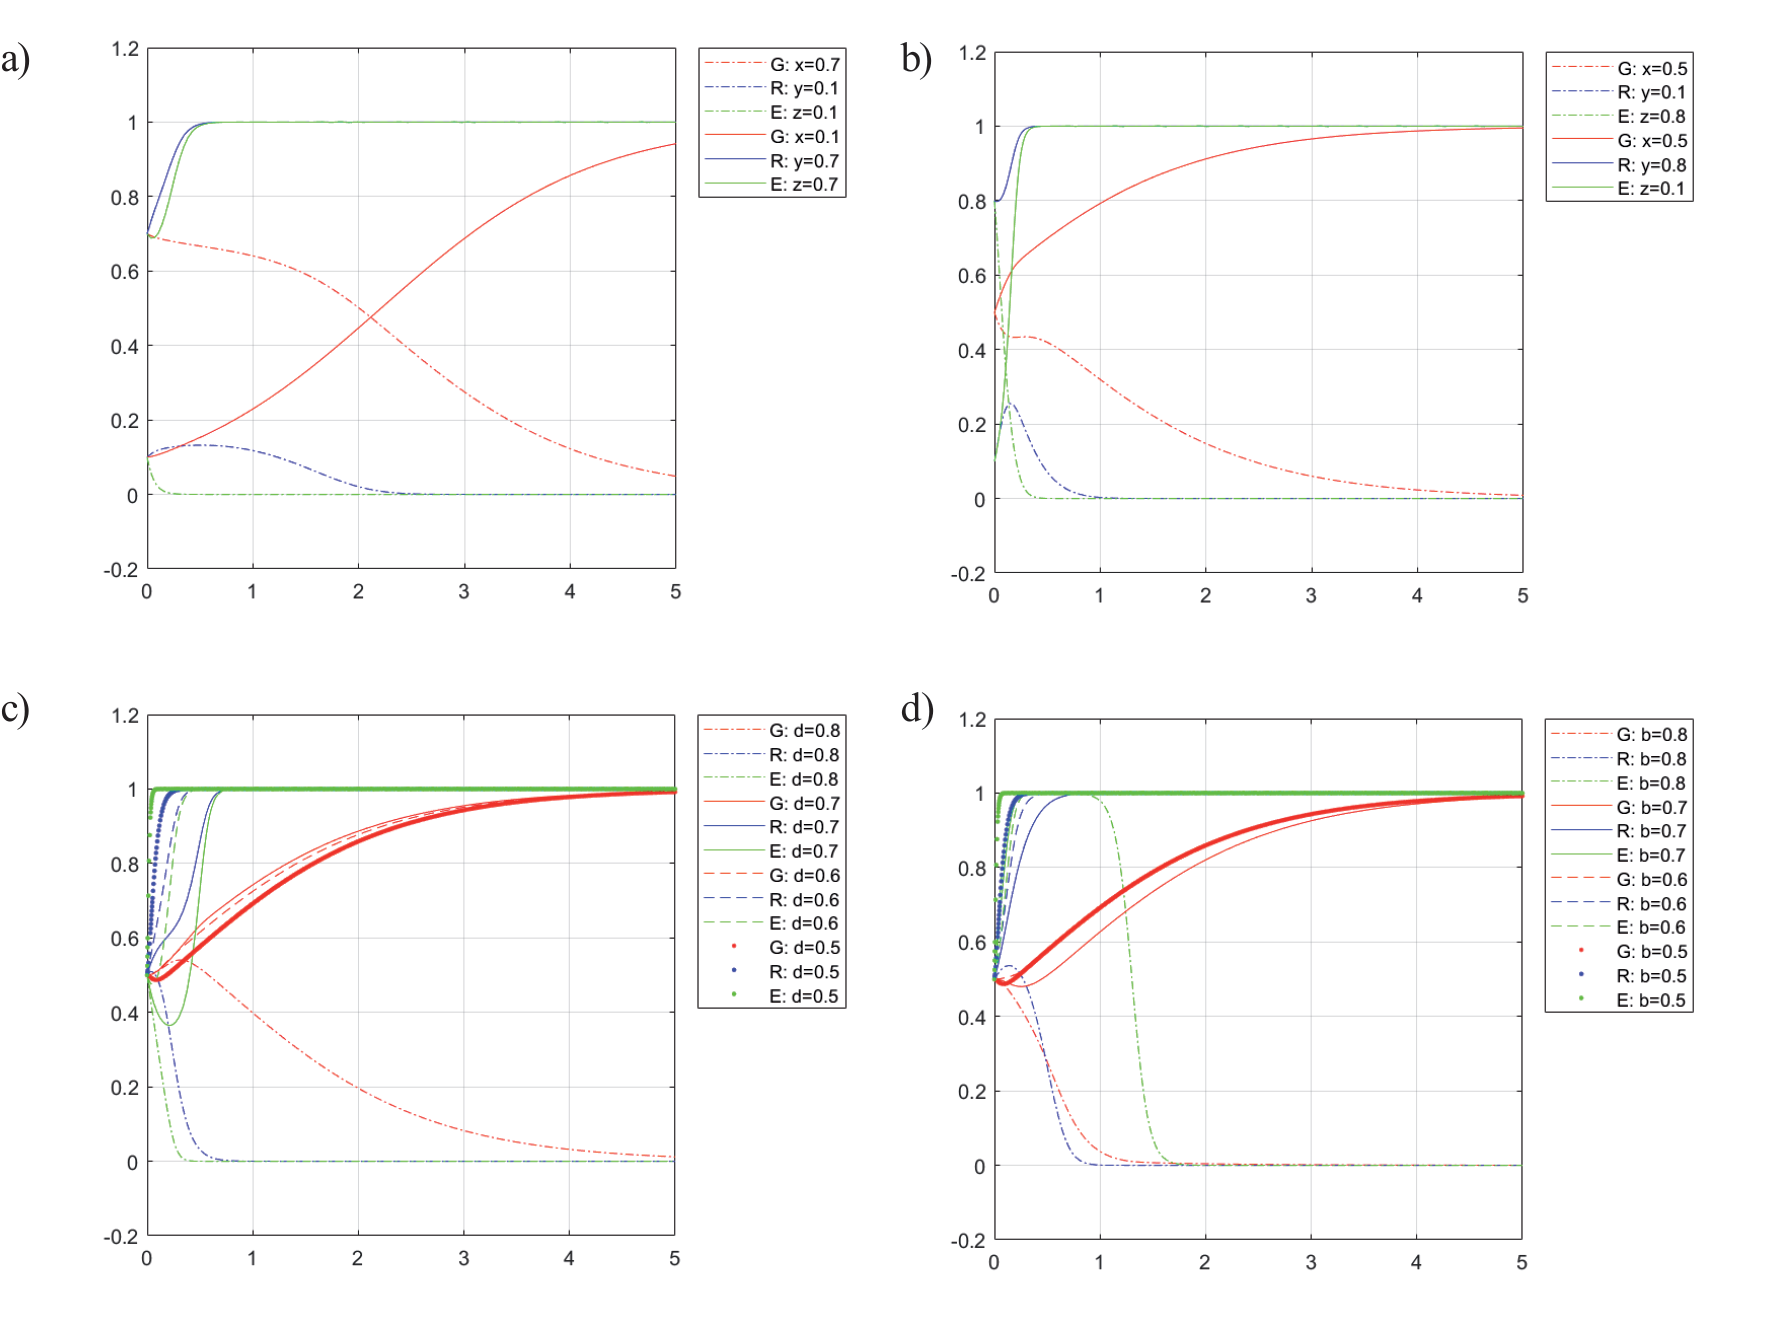
Fig. 2a) shows that when the initial willingness is y, the z of residents and enterprises is low. When the initial willingness x of the government is at a high level, the curve converges to 0, and the equilibrium point converges to the point (0, 0, 0), i.e., all three parties choose not to participate in the cooperative waste separation; when the initial willingness y and z of residents and enterprises are at a high level, and the initial willingness x of the government is at a low level, the curve converges to 1. The equilibrium point converges to the point (1, 1, 1), i.e., all three parties choose not to participate in the cooperative waste separation. As the curve converges to 1, the equilibrium point converges to the point (1, 1, 1), i.e., all three parties choose to participate in the cooperative waste separation. The simulation results show the government’s initial willingness to participate in waste separation cooperation converges to 1. The government’s x converges to 0 when the government’s x is low. The simulation results show that the government’s participation or non-participation has less influence on residents’ and enterprises’ waste separation cooperation when the government’s support is negligible. The market factor becomes the key to enterprises’ strategy selection. The government influences the residents more than the enterprises. When the government’s policy support is small, but the enterprises can get a better income through cooperation, the enterprises’ willingness to participate in cooperation will become stronger; finally, they choose a cooperative cooperation strategy; when the enterprises’ concern is deep, but the income obtained through cooperation is lower than the psychological expectation, the enterprises’ willingness to participate will become lower, and finally they choose no cooperative cooperation strategy.
Fig. 2b) shows that when the initial willingness of enterprises is high (z = 0.8) and the initial willingness of residents is low (y = 0.1), x, y, and z will converge to 0. At this time, the willingness of residents y will rise rapidly and then fall rapidly. The willingness of enterprises z will show a rapid and direct decline. The rate of decline is significantly faster than the willingness of residents y. The government’s willingness x will converge to 0 when the initial willingness of enterprises is high (z = 0.8) and the initial willingness of residents is low (y = 0.1). When the initial willingness of enterprises is low (z = 0.1) and the initial willingness of residents is high (y = 0.8), x, y, and z will converge to 1. Currently, the enterprises’ willingness converges faster than the residents’ willingness, and the final equilibrium point converges to the point (1, 1, 1). The simulation results show that, under the condition that the government’s willingness to participate in x remains unchanged, the residents’ willingness to participate in y has a more significant influence on the enterprises’ willingness to participate in z than the enterprises’ willingness to participate in z on the residents’ willingness to participate in y. This is because the initiation point of waste separation cooperation is the source separation of waste. The residents are the first executors of the source separation of waste. The enterprises can only further perform their role functions after the waste has been source-separated, making enterprises more sensitive to residents’ willingness to participate. Only when residents’ willingness to participate is high can enterprises’ willingness to participate increase. Otherwise, it will decrease.
The Evolutionary Impact of Government Support on Synergistic Cooperation
The government’s willingness to participate is mainly reflected in two aspects: first, policy support, which makes residents and enterprises have a certain percentage of total cost reduction in collaborative cooperation by specifying a series of relevant policies; second, direct government funds subsidize residents and enterprises, and the government allocates the subsidized funds according to the actual situation.
Fig. 2c) shows the change in coefficient d of the total cost reduction of synergistic cooperation by the government-provided support policies on the residents’ and enterprises’ participation in the synergistic cooperation strategy, with other parameters constant. When d is more significant than this critical value, x, y, and z converge to 0, and the final equilibrium point tends to the point (0, 0, 0). At this time, the convergence speed of enterprise willingness z is faster than that of resident willingness y. The government’s willingness x tends to 0 after a period of increase and then decrease, and the convergence speed is the slowest; when d is less than this critical value, x, y, and z converge to 1, and the equilibrium point tends to point (1, 1, 1). At this time, the decrease of d accelerates the convergence speed of y and z, and along with the decline of d, the convergence of y and z presents different situations. When d is at a higher level (d = 0.7), the z curve first declines and then rises, and the convergence speed is slower than the y curve; when d = 0.6, the convergence speed of y and z is the same; when d = 0.5, the z curve converges faster than the y curve. The simulation results show that the change of cost reduction coefficient d affects the choice of strategies for residents and firms. The impact on firms is more significant than that on residents. This is because when the government participates in collaborative cooperation, it will provide specific policy support for residents and enterprises, which makes the cost of collaborative cooperation decrease for residents and enterprises, i.e., residents and enterprises will choose to participate in collaborative cooperation if they only need to pay fewer costs to bring significant benefits. The change in d is more pronounced for firms because of their profit-seeking attributes.
The Evolutionary Impact of Cost-sharing Factors on Synergy
Fig. 2d) shows the simulation of the effect of the change in the cost-sharing coefficient on the participation of residents and firms in the synergistic cooperation strategy with other parameters held constant. As shown in Fig. 2d), the critical value of the cost-sharing coefficient b is between 0.7 and 0.8. When b is more significant than this critical value, x, y, and z converge to 0. At this time, the x curve converges the slowest when b increases, and the y curve rises slightly before decreasing. The z curve is the most special, first rising rapidly to its highest point, then falling rapidly after a period of smoothness, and the equilibrium point converges to the point (0, 0, 0); when b is less than this critical value, x, y, and z converge to 1. When b is less than the critical value, x, y, and z converge to 1. At this time, the b decreases, the y and z curves converge faster, the x curve converges at a nominal rate, enterprise z converges faster than resident y converges, and the final equilibrium point converges to (1, 1, 1). The simulation results show that the decrease of cost-sharing coefficient b affects the strategy choice of both residents and firms. The effect is more significant for firms than residents. This is because the profit-seeking attributes of firms make them more sensitive to changes in their costs. Therefore, the cost-sharing coefficient b has a more significant impact on firms.
The Evolutionary Impact of Revenue and Its Distribution Coefficient on Synergistic Cooperation
Fig. 3a) shows the simulation of the effect of the change in the extra benefit U5 of the collaborative cooperation between residents and firms on the choice of the collaborative cooperation strategy with other parameters held constant. When U5 is less than this critical value, x, y, and z converge to 0, with z converging faster than y. The x curve rises and then falls, and the final equilibrium point tends to the point (0, 0, 0); when U5 is more significant than this critical value, x, y, and z all converge to 1, and at the level of U5 = 80, the z curve first falls and then rises. At the level of U5 = 80, the z curve first decreases and then rises to 1, and the y curve rises more smoothly. At the level of U5 = 100, the z converges faster than y, the x convergence speed does not change significantly, and the final equilibrium point tends to the point (1, 1, 1). The simulation results in Fig. 3a) show that the increase in additional earnings can increase the willingness of residents and firms to participate, with a more significant impact on firms than on residents and an insignificant impact on the government. This is because the profit-seeking property of enterprises makes them the most sensitive to benefits, followed by residents, while the government is the least sensitive to benefits due to its public service provision property and policy-oriented factors.
Fig. 3.
Evolutionary results of the change in additional benefits and the coefficient of distribution of additional benefits.
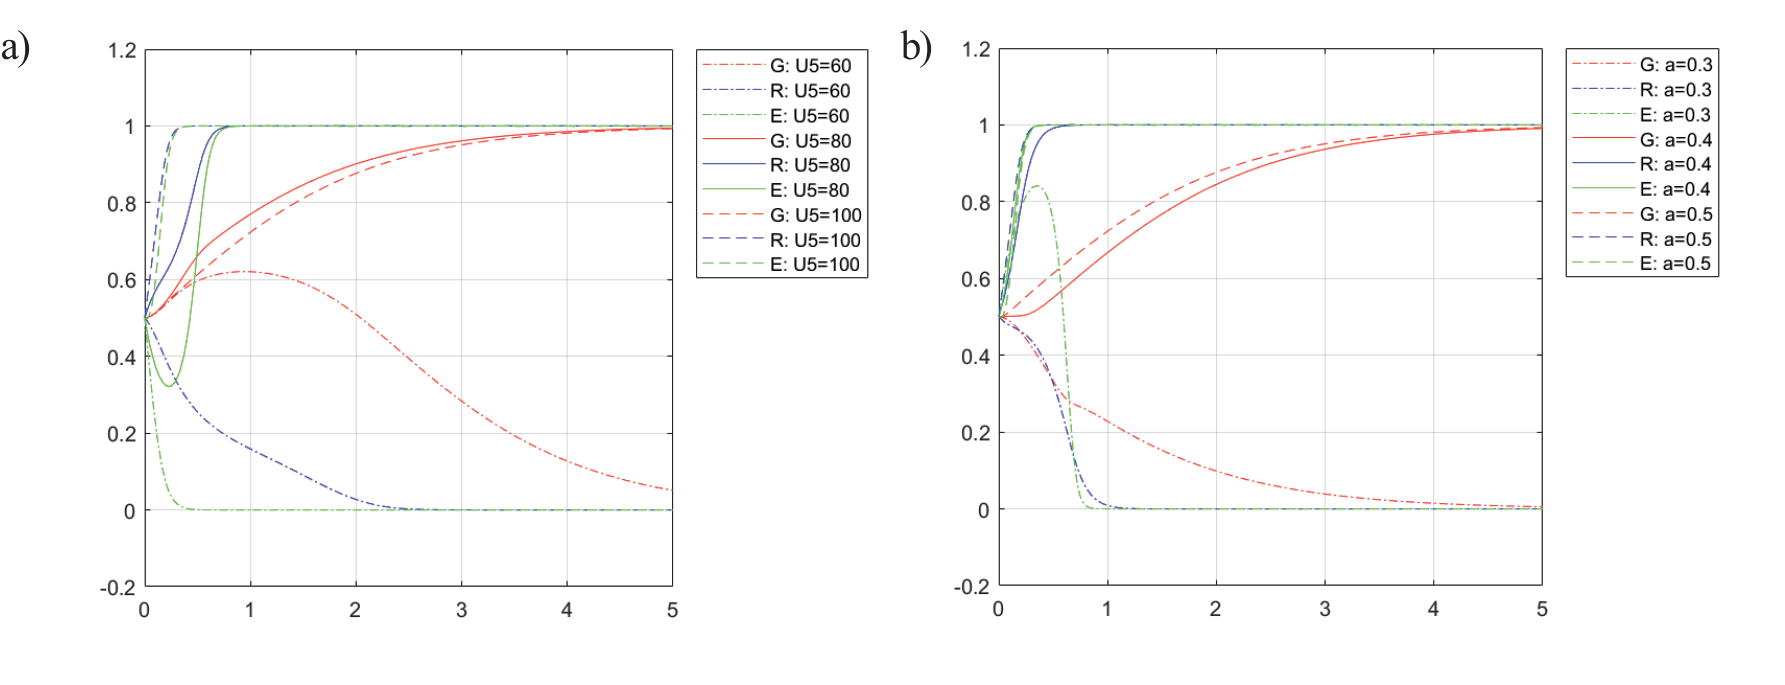
Fig. 3b) shows the additional benefit allocation coefficient change in the synergy between residents and firms with other parameters constant. From Fig. 3b), the critical value of the additional benefit allocation coefficient is between 0.3 and 0.4. When the allocation coefficient a is less than this critical value, x, y, and z converge to 0, z experiences a significant fluctuation and finally declines. In contrast, the y and x curves decline smoothly, where the z curve converges faster than y, the x curve converges the slowest, and the final equilibrium point converges to the point (0, 0, 0); when the allocation coefficient a is larger than the critical value, x, y, and z all converge to 1. The difference in the convergence speed of the x, y, and z curves is not apparent. The final equilibrium point tends to the point (1,1,1). According to the simulation results in Fig. 3b), residents’ willingness will drop rapidly as the distribution coefficient decreases. The enterprises’ willingness will experience fluctuations and then also drop. The government’s willingness will also drop slowly because the distribution coefficient is too small, so the residents’ share is too small. Their willingness will immediately decrease once it falls below the residents’ psychological expectations. The enterprises’ share of revenue will increase partly in the short term. However, as the residents’ willingness decreases, the source of waste separation is cut off. The willingness of enterprises will also decrease. When the willingness of both residents and enterprises decreases, the government’s willingness will also decrease slowly.
Discussion
In this paper, we assume that the game parties are finite rational and use evolutionary game theory to establish the game payment matrix of “government lead + enterprise input + universal participation”, systematically analyze the evolutionary process of cooperative decision-making among government, residents, and enterprises, and combine the numerical analysis of the case with exploring the strategic behavior of government, residents, and enterprises in waste separation and their influencing factors. The following perspectives are drawn.
(1) The government, residents, and enterprises have different degrees of influence on each other’s willingness to participate. ① The government, residents, and enterprises have different degrees of influence on each other’s willingness to participate. ② The influence of residents and enterprises on each other is asymmetric, and enterprises are more sensitive to residents’ willingness to participate in collaborative cooperation. As more residents start separating waste at the source, more and more enterprises will enter this segment and collaborate with residents. Therefore, the government should give more policy support directly to residents, enhance their enthusiasm for waste separation and cooperation, separate waste at the source, attract enterprises to cooperate, fully utilize the resources of existing grid-based community management, and breed an excellent market atmosphere for waste separation and cooperation as well as the government’s leading role [42].
(2) Enterprises are more sensitive to government policy support. Tax preferences, government transfer payments, green channels, and other policy support reduce the cost of residents’ and enterprises’ cooperation and attract more enterprises to join waste separation cooperation. This paper finds that the effect of direct government financial subsidies for both residents and enterprises, both in terms of total amount and distribution ratio for both residents and enterprises, is not apparent. Therefore, the government should rationalize its support policies, avoid directly subsidizing residents and enterprises, and adopt more indirect support policies that reduce the cost of waste separation cooperation between them [43].
(3) Enterprises are more sensitive to the cost-sharing factor than residents. The source separation of waste is the starting point of cooperation. Residents are the initiators of cooperation in waste separation [44]. When the total cost of cooperation in waste separation is apportioned, the residents’ apportioned part is too high. Although the enterprises’ apportioned part is reduced, the enterprises’ willingness will rise rapidly in the short term. However, after the residents’ willingness decreases significantly, the enterprises’ willingness will also be forced to decline. Therefore, when designing cooperative programs, enterprises should take the initiative to bear most of the total costs and reduce the residents’ to actively protect residents’ enthusiasm to participate in cooperative waste separation.
(4) Enterprises are more sensitive to extra benefits and allocation coefficients. Enterprises pursue the maximization of economic benefits. The change in extra benefits will cause a change in enterprises’ willingness to participate; residents are at the source of waste separation and are the initiation point of cooperation [45]. If the distribution coefficient is too low, residents will get less than their psychological expectations, rapidly changing their willingness to participate. Therefore, enterprises make efforts to increase the total amount of additional revenue by optimizing the cooperative cooperation scheme of waste separation to improve their enthusiasm to participate; the revenue distribution is moderately tilted to residents to guide them to participate in the source separation waste efficiently.
Conclusions
This paper intends to give the following suggestions for promoting the establishment of the government-resident-enterprise cooperative mechanism for waste separation.
(1) Raising the level of environmental awareness among residents. It is a highly complex issue of how the government, residents, and enterprises can effectively cooperate in waste separation. One of the keys is the attitude and level of environmental awareness of individual residents. Cooperative participation does not necessarily mean full support for household waste separation. Collaborative waste separation is essential, as is the quality of personal waste separation. Researchers have studied many aspects of collaborative waste separation and have focused on analyzing government educational efforts. Therefore, the government should improve the environmental awareness cultivation system from both school and non-school systems, establish a top-down waste separation education model, and strive to create an excellent ecological awareness atmosphere in the whole society to effectively improve the level of environmental awareness of individual residents and their family members, thus achieving the purpose of both increasing the willingness to participate in waste separation and enhancing the quality of individual residents’ waste separation.
(2) Designing a policy system that is appropriate for the enterprise. Enterprises fundamentally obey the fundamental laws of the market, and their goal is profitability. The government should, according to this characteristic of enterprises, 1) design policies to reduce the cost of collaborative cooperation of enterprises and avoid direct financial subsidies to enterprises, such as tax breaks, transfer payments, low-interest loans, and other policies or programs; 2) assist enterprises to set up rationalized cost-sharing coefficients, and protect the enthusiasm of individual residents to cooperate in waste separation through the open and standardized development of cost management methods payable by individual residents by government price departments.
3) The government environmental protection department will take the lead in setting up a particular fund channel to manage the additional revenue generated by the cooperative efforts to increase the total amount of additional revenue and set the revenue distribution coefficient in a reasonable range to protect the enthusiasm of individual residents to cooperate in waste separation.
(3) Continuously deepen the research on waste separation. However, due to the limitation of research time and existing research conditions and researchers, the government, one of the participating parties, has not been sufficiently detailed due to the vast area of China and the different situations in different cities. In our following study, we intend to refine the government as a cooperative body into the central government and local government, for example, the non-cooperative study based on the central government, local government, and residents’ waste separation, the study of the central government, local government, and enterprises’ participation in waste separation behavior, and the study of residents’ feedback on waste separation policy based on internet public opinion.

