

Introduction
Forest ecosystems are increasingly being disrupted by climate change. However, our understanding of forest response patterns under climate change is still incomplete, especially regarding longer cycles, environmental action effects, and forest damping feedback [1]. Therefore, exploring the effects of climate change on subtropical forest succession has become a recent research focus in the context of global environmental climate change. Climatic factors have a significant influence on the spatial distribution [2], biomass composition [3], and net ecosystem productivity (NEP) of subtropical forest vegetation [4]. Currently, most of the research focuses on the impact of climate change on forest vegetation and productivity, but there are few studies on the impact of forest soil property change. Soil a critical component of forest ecosystems, playing a crucial role in vegetation recovery and spatial distribution [5, 6]. It also controls soil microbial composition and respiratory status [7, 8]. Soil properties are closely related to the health of forest ecosystems. Therefore, understanding the response of soil properties to the environmental climate is vital to effective forest restoration and scientific management.
Fanjing Mountain is a typical subtropical primary forest with clear vertical zonation of vegetation and soil. As such, it is an excellent natural laboratory for studying the effects of climate change on forest soil succession. Soil carbon, nitrogen, phosphorus distribution characteristics, stoichiometric characteristics, and spatial and temporal variability of soil organic carbon were studied in Fanjing Mountain [9-11]. However, these studies were conducted on soils of specific rare plant habitats, and only covered the fate of a few soil chemical components. At present, little research has explored the evolution of soil properties at Fanjing Mountain over longer periods. Therefore, this study aims to determine and compare the differences in the climatic environment and soil properties between 1982 and 2014 phases of Faning Mountain. The purpose of this study is to investigate the evolution pattern of soil properties due to climatic changes in Fanjing Mountain over 32 years and analyze the main environmental drivers of soil evolution. This study revealed the natural succession model of the subtropical forest ecosystem from a soil perspective. The research results have important theoretical and practical significance for restoring degraded forest vegetation and protecting rare plants.
Materials and Methods
Study Area
Fanjing Mountain National Nature Reserve is located at the junction of Jiangkou, Yinjiang, and Songtao counties in northeastern Guizhou Province, China. It is the central peak of the Wuling Mountains. It has a unique ecosystem of primaeval evergreen broad-leaved and mixed coniferous forests in the central subtropics and was included in the World Natural Heritage List in 2018. The highest elevation of Fanjing Mountain is 2572 m, with a vertical height difference of over 2000m from the foothills of the mountain. The sizeable vertical height difference allows water and heat to be redistributed across the hill at different elevations, resulting in a typical vertical distribution pattern of central subtropical mountain plants [7]. Meanwhile, the soil in Fanjing Mountain showed five different kinds of soil with different appearances depending on the altitude [10]. Below 500 m above sea level, the distribution of Fanjin Mountain is dominated by yellow-red loam, marked as Soil 1. Soil 2 is yellow loam, between 500 m and 140 0m above sea level. Between 1400 m and 2000 m, the distribution is dominated by yellow-brown earth, marked as Soil 3. Between 2000 m and 2200 m, the distribution is dominated by black dwarf forest soils, marked as Soil 4. Above 2200 m, the distribution is dominated by scrub-grass soils, marked as Soil 5. The geographical location of the study area is shown in Fig. 1.
Data Sources
Climate data were obtained from two meteorological stations on the windward slope (Jiangkou Station) and the leeward slope (Yinjiang Station) of Fanjing Mountain and meteorological stations within Fanjing Mountain. Meteorological data from the Jiangkou and Yinjiang stations were provided by the Institute of Mountain Environment and Climate of Guizhou Province. The Fanjing Mountain Forest Ecosystem Observatory, Guizhou Academy of Sciences, abbreviated as FJ Observatory, provides internal meteorological observations. The meteorological data obtained include the annual average temperature (Avg-T), the annual minimum temperature (Min-T), the annual maximum temperature (Max-T), the annual temperature range (T-Ran), the cumulative temperature greater than 10ºC (≥10ºC-T), the annual rainfall (Ann-R), and the average annual relative humidity (Avg-H). Altitude (AL) and slope direction (S-D) data were obtained from sampling records. Due to constraints, the meteorological data measured in this study were limited to a few representative sample points and did not cover the whole of Fanjing Mountain. Since temperature and precipitation usually correlate with altitude [12], several measured meteorological observations can be fitted to the model with altitude. Other sample meteorological data can be obtained from the model.
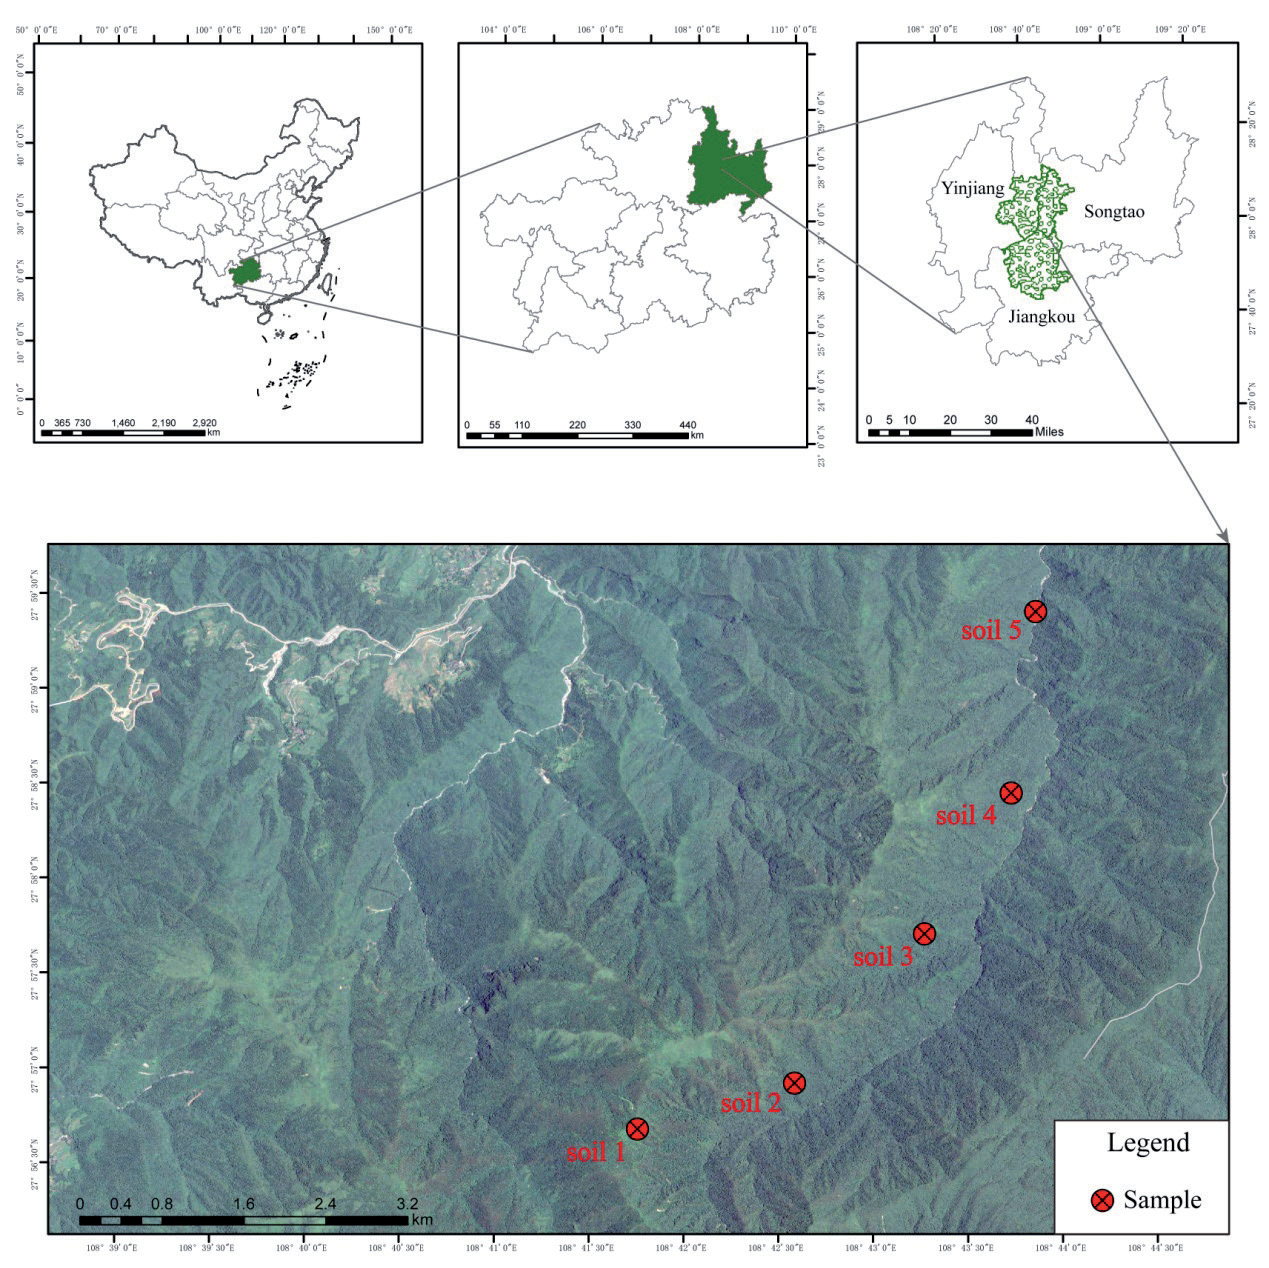
The soil data is obtained from the actual sampling and testing data from the sample plots within the FJ Observatory. In 1982 and 2014, the FJ Observatory conducted a comprehensive scientific study of the soils of Fanjing Mountain. Soils 1 to 5 were sampled in 1982 with 4, 7, 7, 3 and 2 samples, respectively, in addition to one multi-point mixed soil sample. The location of the 2014 sampling was determined by reference to the latitude and longitude of the 1982 sampling record. In 2014, 8, 40, 14, 19 and 28 samples were collected from Soil 1 to 5, plus one multi-point mixed sample.
Sampling Method
A stainless steel soil sampler was used to collect the top layer of soil from 0-10cm. The soil samples collected were air dried after removing gravel and plant roots, then sieved and prepared for testing. The gravimetric method determined the soil’s mechanical composition [13]. The soil texture was classified and evaluated by the International Standard for Soil Texture Classification [14]. The soil pH was tested by potentiometry using a soil-to-water ratio of 1:2.5 (FE28-Meter, Mettler Toled, Switzerland) [15]. The ammonium acetate method measured the cation exchange capacity (CEC) [16]. Potassium dichromate titration solution was used to determine soil organic carbon (SOM) and total soil nitrogen (TN) by the Kjeldahl (Kjelflex k360, Switzerland), and molybdenum antimony reverse spectrophotometry (UV-1900i, Shimadzu, Japan) was used to determine total soil phosphorus (TP) [17].
Statistical Analysis
When comparing indicators of different magnitudes and units, it is necessary to normalize the data of each indicator. The normalized data can be used to compare the relative size of the original index in the whole. In this study, the normalization method was used. Its processing formula is shown in formula (1) [18].
Where x is the value to be transformed, x' is the transformed value, xmin is the minimum value in the series, and xmax is the maximum value.
Growth (G) and growth rate (GR) can be used to evaluate the change in an indicator over two periods. The formulae for calculating them are given in equations (2) and (3) [19]. The positive growth rate means an increase; the larger the value, the more significant the increase. A negative growth rate means reduction; the more significant the value’s absolute value, the greater the reduction.
Here x1 and x2 are the content of soil indicators in 1982 and 2014, respectively. G is the amount of growth in 2014 over the same indicator in 1982. GR is the growth rate of the different indicators in 1982.
In this study, Origin 2019b software was used for heat mapping. The redundancy analysis of soil properties and environmental factors in Fanjing Mountain was done using CANOCO 5 software. Redundancy analysis is a type of constrained ordination which aims to find new explanatory variables to predict the distribution of response variables. Standardization by error variance is chosen for the data for linear ranking with the environmental variables [20].
Results
Content Characteristics and Evolution Characteristics of Soil Properties in Fanjing Mountain in 1982 and 2014
Evolutionary Characteristics of the Overall Soil Properties of the Fanjing Mountain
The indicator contents of the overall soil properties of Fanjing Mountain in 1982 and 2014 are shown in Table 1. The results show significant differences between the two periods in the contents of the indicators of Sand, Silt, Clay, SOM, CEC and TP and no significant differences in the contents of the indicators of pH and TN. This indicates that after 32 years of evolution, the soil of Fanjing Mountain has remained stable in terms of pH and total nitrogen content. However, the rest of the indicators have evolved significantly. In 2014, the sand and clay of the soil were more than that of 1982, with an increase of 3.28% and 6.75%, respectively, and a growth rate of 13.69% and 60.53%. Silt content decreased by 10.08%, with a growth rate of -15.52 in 2014. The condition of the soil texture in both periods was evaluated according to the International Standard for Classification of Soil Textures (ISCS). In 1982, the overall soil texture of Fanjing Mountain was silty loam, and in 2014 it evolved to silty clay loam. Among the remaining property indicators, the organic matter indicator showed the highest absolute reduction of 38.02 g/kg, with a growth rate of -37.43. This result indicates that nearly two-fifths of the soil organic matter content was lost in 2014. At the same time, TP decreased by 1.41 g/kg in 2014 compared to 1982, with a growth rate of -85.78%, indicating a significant loss of total soil phosphorus content in 2014 and a loss of more than four-fifths. In addition, the CEC content decreased by 5.99 cmol/kg in 2014 compared to 1982, with a growth rate of -28.35%, and it was also lost by around one-fifth.
Evolution Characteristics of Different Soils in Fanjing Mountain
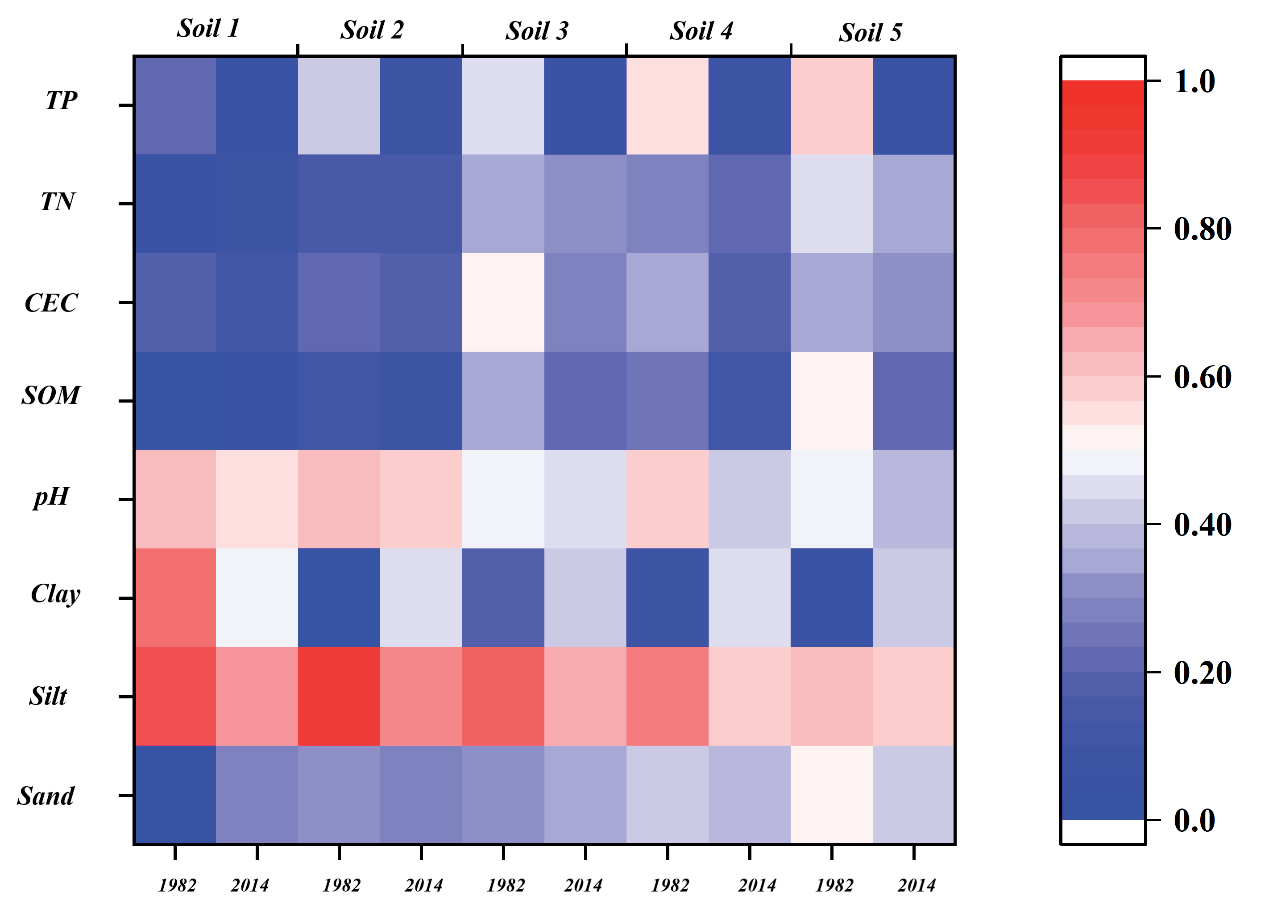
After normalizing the indexes of soil properties, the relative size of each index content of the soil in the two periods can be compared intuitively. The contents characteristics of different soil properties in Fanjing Mountain in 1982 and 2014 (after standardization) differed (Fig. 2). In 1982, there was no significant difference in pH, CEC, TN and TP between the five soil types, but there were significant differences in soil mechanical composition and SOM. In 2014, there was no significant difference in mechanical composition and TP among the five soil types. However, the groups significantly differed in pH, SOM, CEC and TN. Comparing the two periods, soil 1 in 1982 was silty clay, and the texture of other soil types was silty loam. In 2014, soil 3 was silty loam, and the texture of other soil types became silty clay loam. Compared with 1982, the pH in 2014 decreased slightly, and the soil of Fanjing Mountain had an acidification trend. In 2014, except for the increase of soil 1, the SOM of the other four soil types was lower than that of 1982. The CEC of soil 5 changed little, and the CEC of the other four soil types was lower than that in 1982. The contents of TN and TP in the five soil types in Fanjing Mountain in 2014 were significantly lower than those in 1982.
Table 1.
Soil properties in Fanjing Mountain in 1982 and 2014.
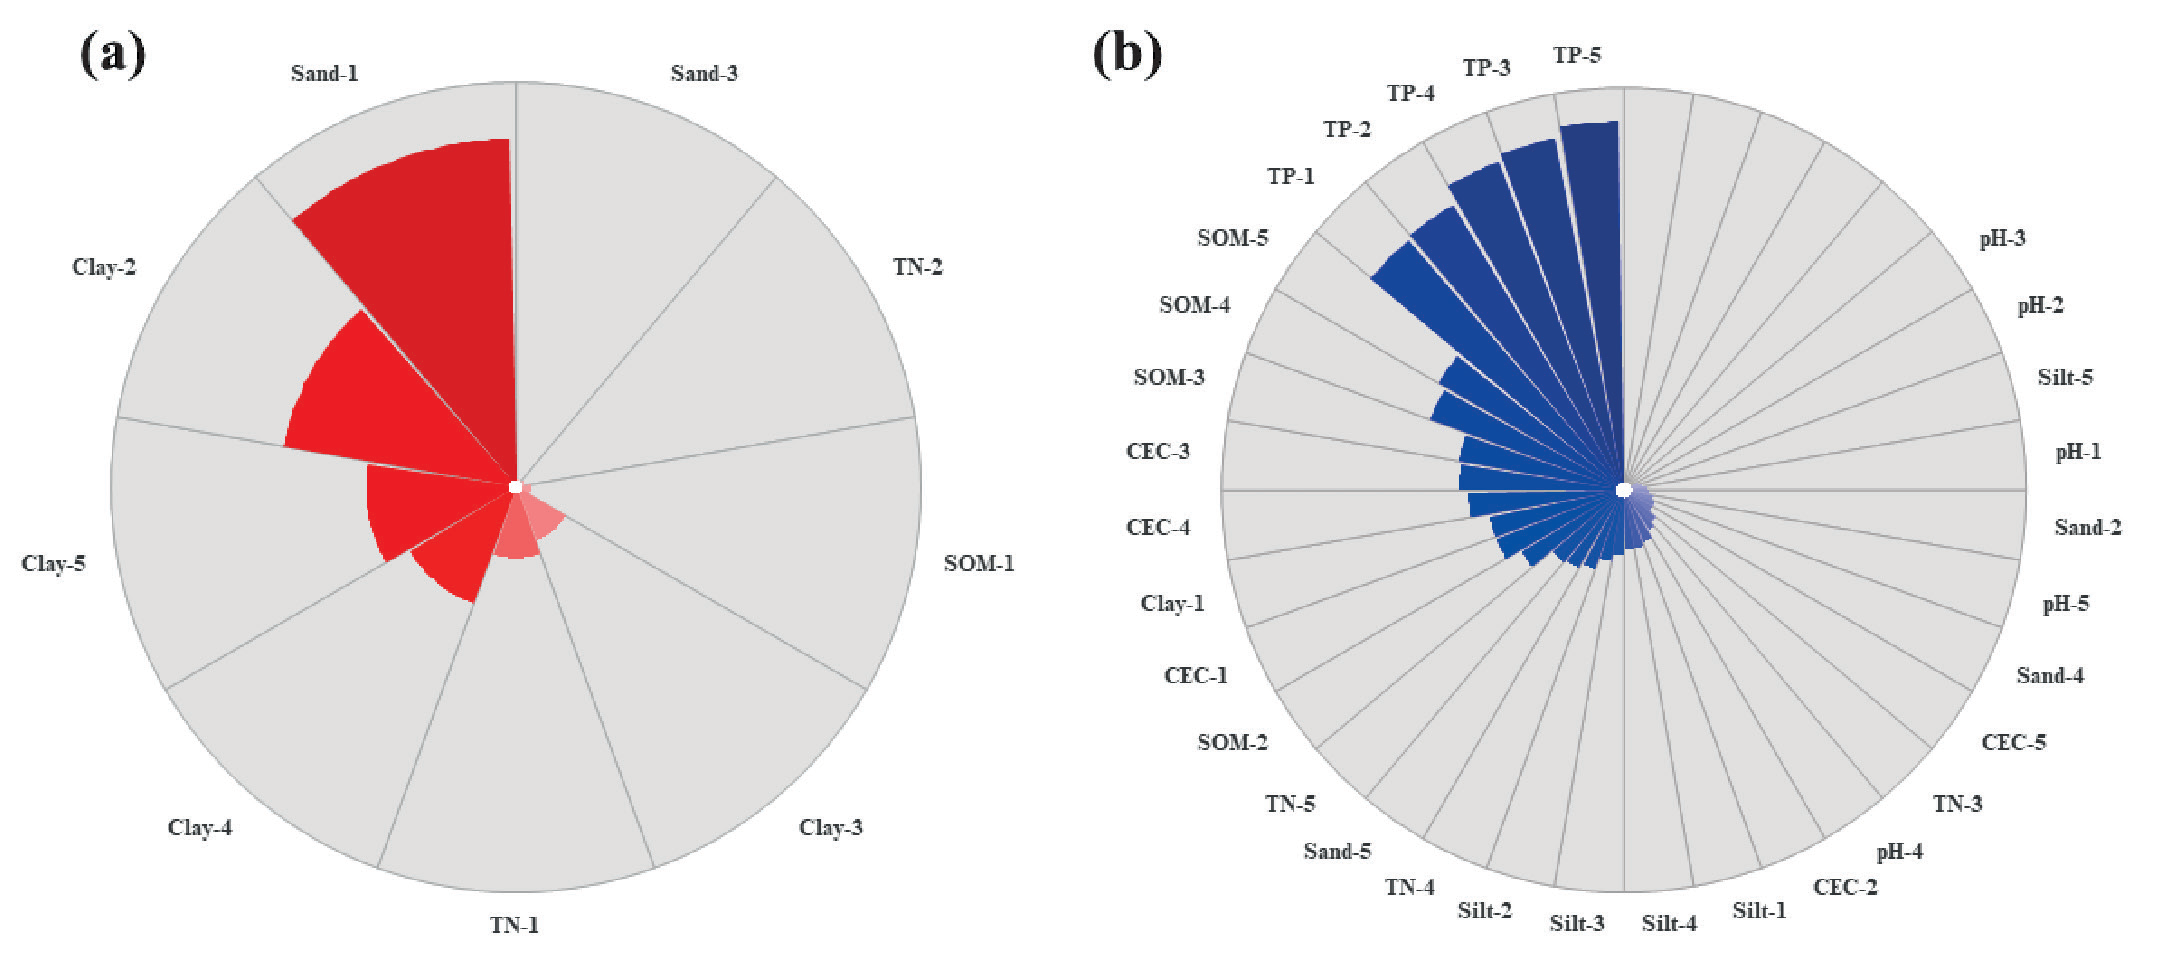
After evolution, the character properties of different types of soil in Fanjing Mountain have changed, some properties have a positive growth rate (Fig. 3a), and some properties have a negative growth rate (Fig. 3b). The sands of soil 1 and 3 showed positive growth, with 516.34% and 11.80 %, respectively. The sand of soil 2,4 and 5 showed negative growth, and the growth rates were -6.42%, -8.25% and -22.47%, respectively. The clay content of soil 2, 3, 4 and 5 increased by 349.02%, 84.81%, 183.40% and 222.28%, respectively. The clay of soil 1 was negative growth, and the growth rate was -34.01%. The silts of all soil types showed negative growth, and the silt growth rates of soil 1 to 5 were -14.79%, -18.0%, -16.35%, -14.85%, and -4.64%, respectively. The TN of soil 1 and 2 increased positively, and the growth rates were 105.31% and 13.39%, respectively. The TN of soil 3,4 and 5 showed negative growth, with growth rates of -89.11%, -87.33%, and-91.65%. The SOM of soil 1 was positive, and the growth rate was 22.66%. The SOM of soil 2 to 5 showed negative growth, with growth rates of -29.65%, -41.65%, -51.25%, and -53.18%, respectively. The pH, CEC and TP of the five soil types were negative growth. The pH of soil 4 decreased the most, reaching 11.70%. The remaining soil pH decreased by less than 8%. The soil CEC loss from high to low was soil 3,4,1,2 and 5, and the growth rate was between -40.95% and -8.26%. The loss of TP in five soil types is the most prominent, and the growth rate is more than -80%. Among them, the loss of soil 5 is the most serious, and the growth rate is -91.65%.
Characteristics of the Climate and Environmental Changes in Fanjing Mountain in 1982 and 2014
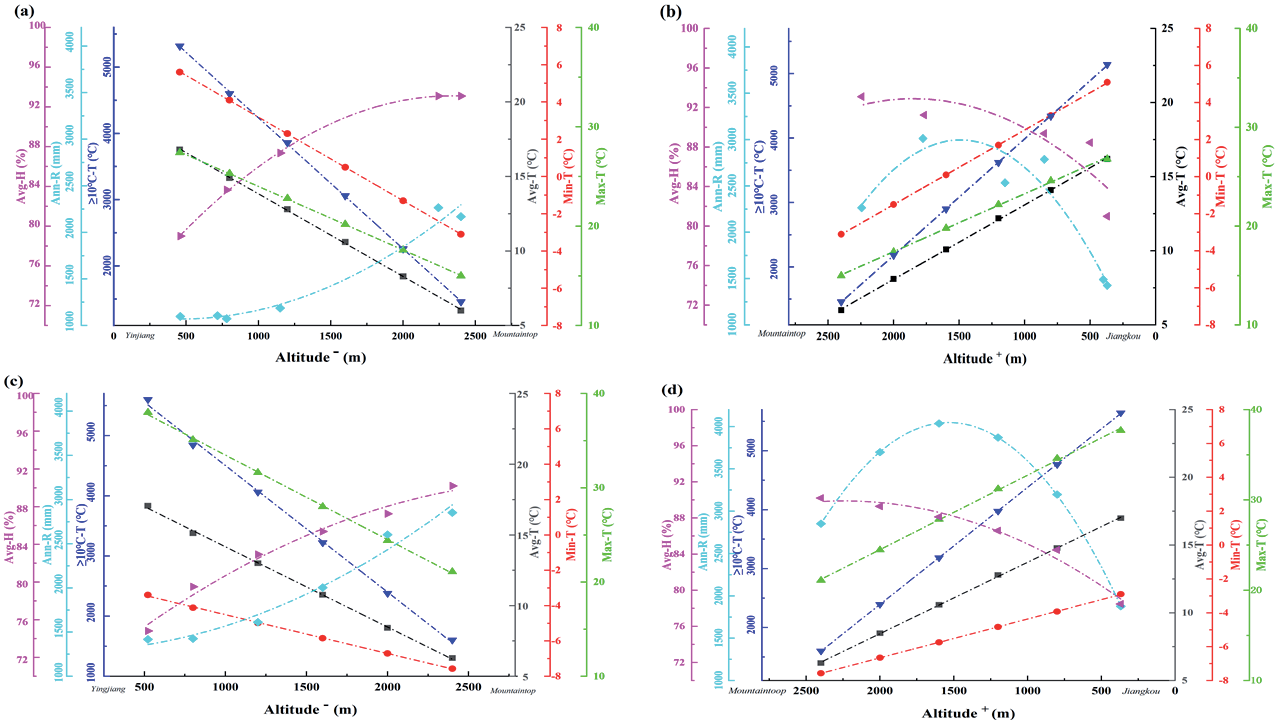
Based on the meteorological station data, the Avg-T, Min-T, Max-T, ≥10ºC-T, Ann-R, and Avg-H of representative sample sites at different altitudes on the windward and leeward slopes of Fanjing Mountain in 1982 and 2014 were obtained (Fig. 4). Compared with 1982, Avg-T, Max-T, ≥10ºC-T and Ann-R at the same locations in Fanjing Mountain in 2014 showed an increase, and they increased by 0.37ºC, 8.42ºC, 257.42ºC and 618.74 mm, respectively. While Min-T and Avg-H in 2014 showed a decrease compared with 1982, they decreased by 6.49ºC and 3.53%. By 2014, the climatic environment of Fanjing Mountain showed a change in the frequency of extreme temperatures, an increase in the annual variance, and a decrease in relative humidity.
The meteorological conditions of mountains are usually directly related to altitude, and the meteorological conditions of windward slope and leeward slopes of mountains are quite different. Therefore, this study fitted the variation model of meteorological data with an altitude of representative samples on the windward and leeward slopes in 1982 and 2014. The fitting model can obtain the meteorological information of other samples in different slope directions of Fanjing Mountain. The results showed that the temperature index (Avg-T, Min-T, Max-T, ≥10ºC-T) was negatively correlated with the altitude of Fanjing Mountain, and the fitting model was linear. The humidity index (Ann-R, Avg-H) is related to the altitude of Fanjing Mountain, and the fitting model is the binomial model. The model fitting accuracy is high, and R2 is above 0.8 (Table 3).
Response of Soil Properties to Climate Change in the Fanjing Mountain
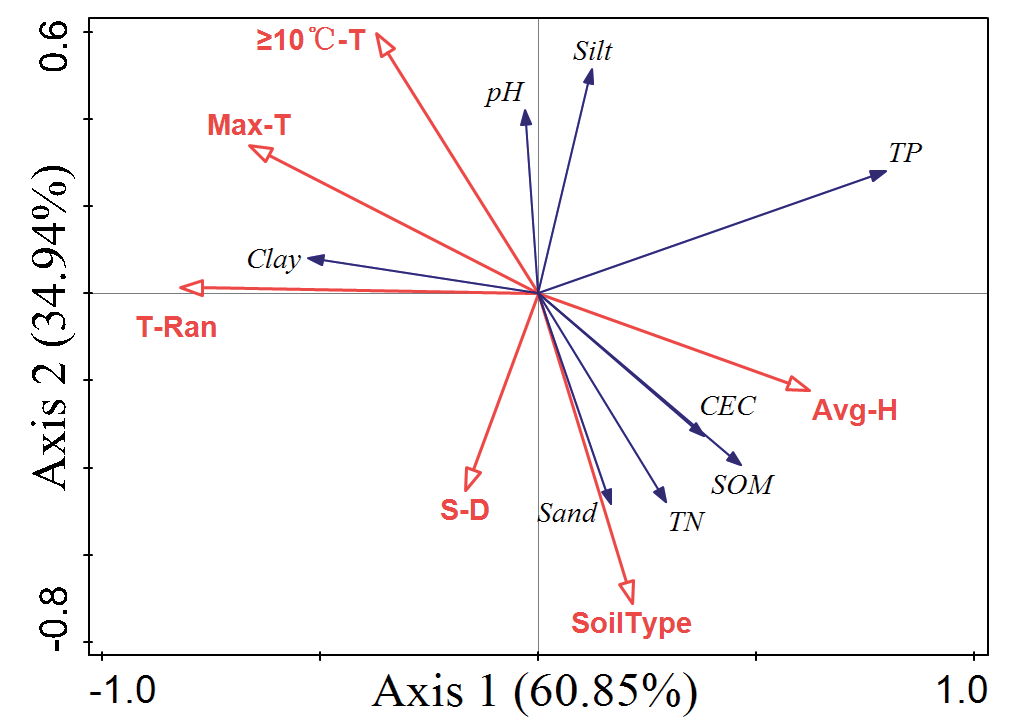
Based on the CANOCO 5 software, the soil properties and the environmental factors were analyzed by detrend correspondence analysis (DCA). The results showed that the value of Gradient length was 1.45, which is less than 3. Therefore, using the linear model RDA, this data is suitable for analyzing the correlation between soil properties and environmental variables. The data were standardized by error variance. The environmental variables with significant explanations were selected by stepwise iteration, and then the soil characteristics were analyzed redundantly with the environmental variables with significant explanations. The first and second axes explained 60.85% and 34.94% of the soil properties, respectively (Table 4). The results of the significance analysis of the environmental factor explanations showed that environmental factors such as Soil type, Max-T, T-Ran, and ≥10ºC-T had highly significant effects on the evolution of soil properties in Fanjing Mountain. In addition, environmental factors such as Avg-H and S-D significantly had significant effects on soil properties in Fanjing Mountain. In contrast, environmental factors such as AL, Avg-T, Min-T and Ann-R were not significantly correlated with soil properties (Table 5).
Table 3.
The fitting models for the meteorological indicators of the different slope directions versus altitude in 1982 and 2014 in Fanjing Mountain.
Table 4.
Summary of the interpretation of different axes for the soil properties.
Table 5.
Explanatory table of environmental factors on soil properties in Fanjing Mountain.
| Name | Explains % | Contribution % | pseudo-F | P |
|---|---|---|---|---|
| T-Ran | 17 | 41.6 | 24.4 | 0.002** |
| Soil type | 10 | 24.4 | 16.2 | 0.002** |
| S-D | 2.1 | 5.1 | 3.5 | 0.016* |
| Ann-R | 1.4 | 3.3 | 2.3 | 0.07 |
| Avg-H | 1.6 | 3.9 | 2.7 | 0.044* |
| AL | 0.4 | 1 | 0.7 | 0.6 |
| ≥10ºC-T | 4.3 | 10.6 | 7.8 | 0.002** |
| Max-T | 4.1 | 10.1 | 7.9 | 0.002** |
Interrelations between soil properties and significant explanatory environmental factors can be seen through RDA analysis (Fig. 5). The hollow red arrows in the figure represent environmental factors, and the solid blue arrows represent the soil indicators. The arrow’s quadrant indicates the positive or negative correlation between the environmental factor and the ranking axis. The length of the arrow line represents the magnitude of the correlation between an environmental factor and a soil indicator. The longer the line, the higher the correlation and vice versa. The angle of the arrow line represents the degree of correlation between the environmental factors and the soil properties. The smaller the angle, the higher the correlation and the lower the correlation. The results showed that soil properties such as Sand, TN, SOM, and CEC were positively correlated with environmental factors such as Soil type, Avg-H, and S-D and negatively correlated with environmental factors such as T-Ran, Max-T, and ≥10ºC-T. Soil properties such as pH and Silt were positively correlated with ≥10ºC-T and negatively correlated with environmental factors such as Soil type, S-D and Avg-H, and negative correlations with environmental factors such as Soil type, S-D and Avg-H. Soil properties such as Clay were positively correlated with T-Ran, Max-T and ≥10ºC-T negatively correlated with environmental factors such as Avg-H and Soil type. TP in soil properties is positively correlated with Avg-H and negatively correlated with environmental factors such as S-D and T-Ran.
Discussion
Forest soil texture and nutrients change directly and indirectly, affecting forest ecosystems [21, 22]. Firstly, changes in soil texture can directly affect the porosity, which in turn affects the soil’s aeration, permeability, and nutrient effectiveness [23]. This study found that the texture evolution of different soil types in Fanjing Mountain showed other characteristics. This phenomenon may be related to the vertical distribution of soil parent material and the different weathering degrees caused by the difference in a regional environment [24]. Secondly, soil nutrient properties are essential for forest health. Soil phosphorus is usually considered a limiting element for tropical and subtropical forest productivity [25]. This study found a dramatic decrease in soil nutrients, especially soil phosphorus content, in Fanjing Mountain. This phenomenon poses a significant threat to the ecosystem security of Fanjing Mountain and should be taken seriously. Studies have shown that applying biochar to soil may stabilize soil organic carbon (SOC), concomitantly increasing nutrient retention [26].
Climate warming is a serious challenge facing the world. The average temperature of the Earth’s surface increased by 0.85ºC from 1880 to 2012. By 2100, temperatures will rise by 1ºC to 3.7º C [27]. Global warming is accelerating the Earth’s hydrological cycle, and global precipitation patterns could change significantly. Compared to 1982, Fanjing Mountain also experienced a general increase in temperature, frequent extreme heat, widening annual variation, and increased precipitation in 2014. Climate change at Fanjing Mountain is consistent with global warming trends.
Fig. 5.
Redundancy analysis of the significant explanatory environmental variables on soil properties.
The evolution of forest soil properties is affected by many factors. First, the differences in soil types lead to a different evolution of soil properties induced by the same environmental factors. This is because different soil types differ in their ability to resist weathering and absorb and decompose nutrients [28]. In addition, different types of soils grow diverse vegetation, and the role of the root zone of vegetation on microorganisms varies [29]. These differences can significantly affect the succession process of soils. Secondly, climate warming has a direct impact on the evolution of forest soil. Climate warming can induce changes in soil properties by affecting the distribution of forest vegetation [2], the composition and function of soil microbial communities [30] and the activity of soil enzymes [28] in turn. At the same time, extreme weather can disrupt the ecological balance of forest ecosystems and affect the geochemical cycling of materials [31]. This phenomenon may be an actual cause of the degradation of rare plants in Fanjing Mountain. In addition, the annual relative humidity strongly influences the evolution of soil properties. Seasonal changes in atmospheric relative humidity affect the growth of forest vegetation [32] and forest soil moisture composition [33], further affecting the composition of soil nutrients. Finally, slope direction is also an essential factor influencing changes in soil properties in Fanjing Mountain. Slope direction can alter temperature and precipitation conditions in small areas [34]. The high mountains of Fanjing Mountain block the cold air entering the region from the northeast, resulting in significant temperature and precipitation differences between the mountain range’s eastern and western sides. These environmental differences indirectly influence the evolution of soil properties on both sides of Fanjing Mountain.
Conclusions
Compared with 1982, the soil properties of Fanjin Mountain changed significantly in 2014. The soil texture evolved from a silty loam in 1982 to a silty clay loam in 2014. There was a significant increase in soil clay particles. In addition, the soil showed acidification, a weakened cation exchange capacity, and a relatively stable soil total nitrogen but a significant loss of soil organic matter and total phosphorus nutrients. The evolution of these soil properties is due to the dominant influence of differences in soil types and climate warming. The evolution of soil properties is also significantly influenced by humidity and slope orientation. In this study, the driving factors of forest soil property evolution were discussed. However, the effect of changes in forest soil properties on aboveground vegetation has not been discussed. This aspect can be further explored in the future.

