


Introduction
Applying sewer water can introduce various beneficial and potentially harmful elements to the soil, altering its physical, chemical, and biological properties over time [1, 2]. However, understanding these changes is essential for optimizing the benefits of sewer water application while minimizing potential risks. Physical properties of soil, such as texture, structure, and porosity, can be affected by long-term sewer water application, affecting water retention capacity and aeration and ultimately affecting crop growth and yield [3-5]. Increased sodium content from sewer water may lead to soil dispersion and reduced aggregate stability. Increased organic carbon, nitrogen, phosphorus, potassium, and magnesium contents in the soil can result from using sewage water for agricultural soil irrigation instead of pure groundwater irrigation [6]. When soil microorganisms are irrigated with sewage effluent, their metabolic activity also increases [7-9]. However, as wastewater irrigation continues, the organic carbon, total nitrogen, microbial biomass (C and N), and microbial activity also increase. This is because soil microorganisms exhibit higher metabolic activity when exposed to sewage effluent irrigation. Thus, it is important to take into account the possible advantages of applying sewage water for agricultural land irrigation [8].
The chemical properties encompass nutrient content, pH levels, and potential contaminants introduced by sewer water application, where excessive concentrations may lead to detrimental effects such as nutrient leaching and eutrophication in nearby water bodies [10]. However, the biological properties include soil microorganisms that play a significant role in maintaining ecosystem functions. Research suggests that the long-term application of sewer water may alter soil microbial communities due to changes in nutrient availability or potential contaminant exposure, as sewage water contains significant quantities of nutrients like nitrogen, phosphorus, and potassium, which reduce dependence on chemical fertilizers and enhance soil productivity [11, 12]. Continuous sewage irrigation can yield better crops such as soybean, maize, cotton, and sorghum due to the additional nutrient inputs, especially in nutrient-deficient soils. Also, the increased availability of organic matter contributes to plant growth factors such as biomass production, shoot elongation, and leaf expansion. Studies have shown that the effects of long-term sewer water application on plant nutrient content vary across different crop seasons due to temperature fluctuations, evapotranspiration rates, and nutrient demands. Understanding these variations helps in informed crop selection and irrigation management strategies.
When water is recycled for irrigation, it is possible that nutrients in recycled water can be used as fertilizer sources. Therefore, sewage water is an important source of plant nutrients and organic substances required to maintain soil fertility and productivity [13]. The results of several researchers showed that the length of the shoot, the number of leaves and plants, the total area of the leaves and plants, and the dry weight of the shoot and root increased significantly [14, 15]. Crops like soybean, maize, cotton, rabi sorghum, tomato, and wheat recorded a higher yield under sewer water application than normal irrigation water [16]. Furthermore, applying wastewater increases both the macronutrients and micronutrients in the soil, which are essential to plant growth and photosynthesis pigments. Prolonged application of sewage water can enhance organic carbon content, leading to improved soil structure, water-holding capacity, and microbial activity. These changes collectively promote healthier soil ecosystems [17, 18]. As a result, the level of nutrients in soils is expected to improve considerably with continuous water treatment with wastewater [19-21].
Also, the accumulation of heavy metals is one of the main disadvantages of irrigation wastewater [10]. In sewage water, trace elements such as zinc (Zn) and copper [22] can provide micronutrient benefits. However, their accumulation beyond critical thresholds poses toxicity risks to both plants and soil microorganisms. Heavy metals such as lead (Pb), cadmium [23], and chromium (Cr) often accumulate in soils due to untreated or poorly treated sewage water. These metals may enter the food chain, posing long-term health risks, and have been found to inhibit root elongation and crop productivity. The total concentrations of Mg, Hg, Mo, Ca, Cu, and Cr and the available Pb, Cd, and Cu concentrations increase significantly under drainage water irrigation [24]. Also, excessive sodium in wastewater can lead to soil dispersion, which reduces aggregate stability, compromising soil texture and permeability. Most studies confirm that heavy metal content and its accumulation in soil depend on the source and nature of sewer water. However, some harmful effects, such as inhibition of root and shoot growth and reduction in yield, are due to the accumulation of heavy metals in plants grown in sewer water-irrigated fields [2, 25, 26]. Variability in sewage water quality and seasonal fluctuations can result in inconsistent impacts on soil properties, including salinity and pH, such as higher salinity levels, which may occur during summer due to concentrated effluents. Nutrient leaching from sewage-irrigated fields into nearby water bodies contributes to eutrophication and subsequent ecological damage, such as algal blooms and oxygen depletion in aquatic systems [27].
Although sewage water enriches the soil with macronutrients like nitrogen and phosphorus, the seasonal variability in their availability remains a challenge. For example, nitrogen availability is higher during the rabi season due to favorable biological nitrogen fixation, while phosphorus levels vary due to leaching during rainy seasons. Prolonged sewage irrigation modifies soil texture through changes in organic matter content and fine particle distribution. While increased organic matter can improve soil structure and water retention, high sodium content disrupts soil aggregates, leading to crust formation and reduced porosity. Sewage irrigation enhances microbial activity and soil biomass due to increased organic matter. However, long-term exposure to contaminants in sewage water alters microbial diversity and may lead to the proliferation of harmful pathogens or antibiotic-resistant bacteria.
Sewage irrigation presents a dual-edged sword in sustainable agriculture. While it offers significant benefits in terms of nutrient recycling and water conservation, the associated risks of soil contamination, heavy metal accumulation, and environmental pollution necessitate careful management. Addressing these challenges requires an integrated approach, combining advanced wastewater treatment technologies, soil remediation strategies, and informed irrigation practices. The present study was undertaken to evaluate the effect of sewer water application after 40 years of continuous application on soil properties and plant nutrient contents as affected by crop season. The study further aimed at addressing the following: (1) investigating the cumulative effects of sewage irrigation on soil health, crop productivity, and environmental sustainability, particularly in regions with continuous application spanning decades; (2) developing soil management practices to counteract salinity, heavy metal accumulation, and soil structural degradation caused by sewage irrigation; and (3) tailored studies on nutrient uptake, heavy metal accumulation, and yield variations across different crop species and seasons can help optimize sewage irrigation practices. Future research must identify optimal sewage water treatment methods to retain beneficial nutrients while mitigating harmful contaminants like heavy metals and pathogens. Sustainable sewage irrigation can be achieved by fostering collaboration among researchers, policymakers, and farmers, ensuring long-term soil health, crop productivity, and environmental protection.
Materials and Methods
Study Location and Experimental Design
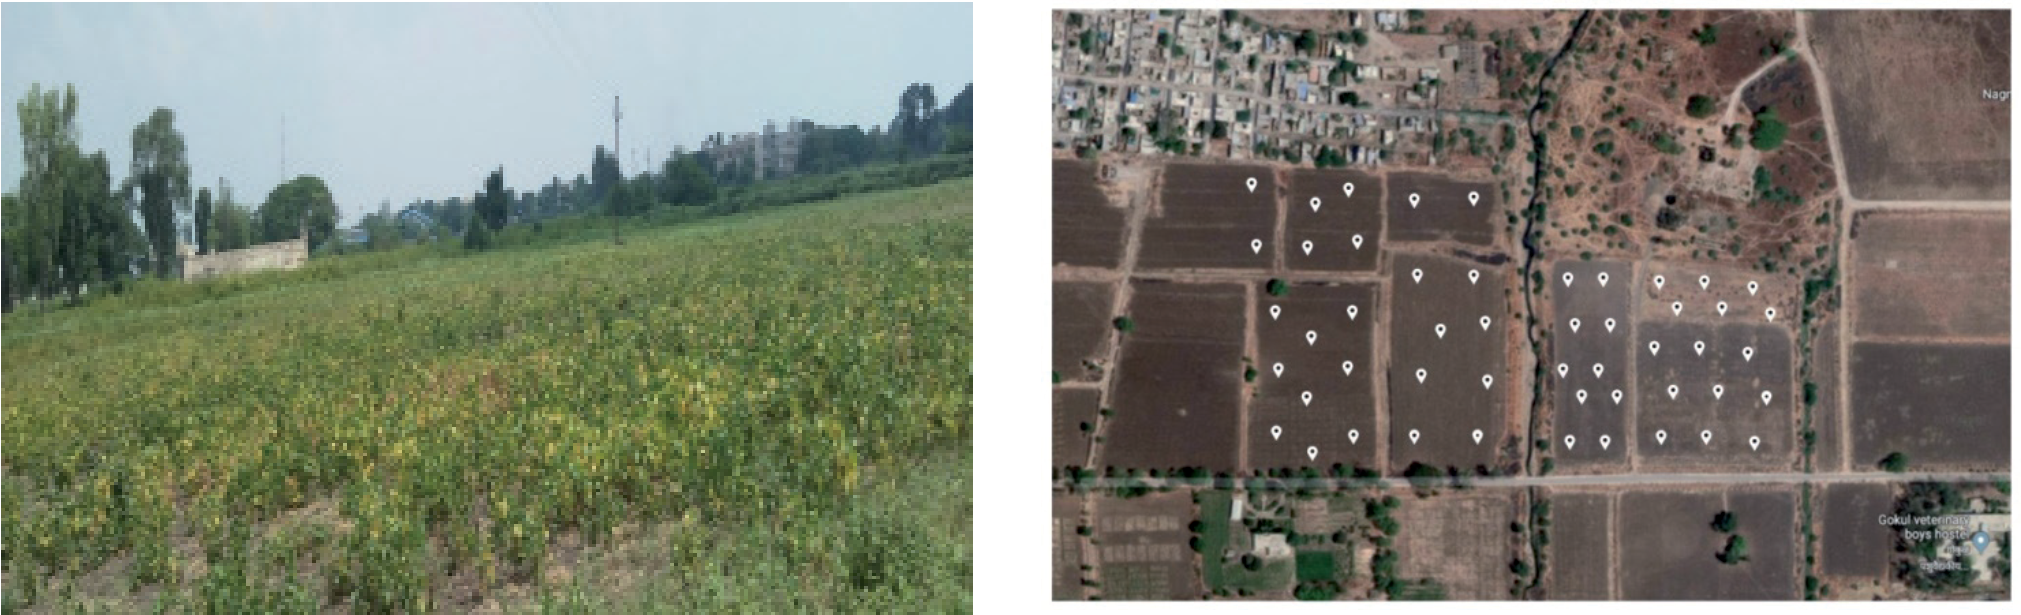
The experiment was conducted at MPKV, Parbhani, during the 2022-2023 agricultural year to assess the impact of 40 years of continuous sewage water application on soil properties and plant nutrient levels of sorghum and soybean across crop seasons (rabi and kharif). The experimental plots had been receiving treated sewage water from the MPKV Parbhani sewage treatment plant for the past 40 years (Fig. 1). The soils in the study area, derived from basaltic “Deccan trap” rocks, are rich in iron, copper, and magnesium (Table 1). Predominantly black in color due to montmorillonite clay, the soils exhibit a high coefficient of expansion and shrinkage, resulting in deep cracking during summer. These soils vary in texture from light to heavy and range in depth from very shallow to extremely deep. Based on the USDA soil taxonomy, they are classified as Typic Halplusterts (Parbhani series).
Soil Sampling and Preparation
Soil samples were collected from the research field near the Sorghum Research Station, MPKV, Parbhani, after harvesting the sorghum (rabi) and soybean (kharif) crops. Fifty representative GPS-based soil samples were taken during both seasons, with a 0-30 cm sampling depth. Samples were air-dried, crushed, and sieved through a 2-mm sieve. Physicochemical analyses were conducted using standard laboratory procedures:
pH Measurement: The pH was measured using a 1:2 soil-to-water suspension. A soil sample of 10 g was mixed with 20 ml of distilled water and stirred intermittently for 30 min to allow equilibrium between the soil and water phases [28]. The pH meter was calibrated with standard buffer solutions before use.
Electrical Conductivity (EC): EC was determined using a conductivity meter in a 1:2 soil-to-water solution [29]. The soil-water suspension was prepared similarly to the pH test, and the EC meter measured the soil solution’s ability to conduct electrical current. EC reflects the salinity levels of the soil, with higher values indicating potential salinization risks.
Where R is the resistance of the soil solution.
Organic Carbon: OC was analyzed using the Walkley–Black wet digestion method, where soil organic matter was oxidized with potassium dichromate (K2Cr2O7) and sulfuric acid (H2SO4) [30, 31]. The residual dichromate was titrated with ferrous ammonium sulfate to estimate the carbon content.
Table 1.
Soil sample site with GPS location of study area.
where: Vb: Volume of ferrous ammonium sulfate for blank titration, Vt: Volume for sample titration, and W: Weight of the soil sample.
Available Nitrogen (N): The alkaline-KMnO4 method was used. Soil nitrogen was oxidized by alkaline potassium permanganate under heating, releasing ammonia gas, which was trapped in boric acid and titrated with HCl [32]. This is crucial for assessing the soil’s potential to support plant growth.
Available Phosphorus (P): Extracted using 0.5 M sodium bicarbonate solution (pH 8.5) and quantified with Barton’s reagent, which reacts with phosphorus to produce a yellow-colored complex measurable by a UV-VIS spectrophotometer at 420 nm [33].
Available Potassium (K): Soil potassium was extracted using a neutral ammonium acetate solution and measured using an inductively coupled plasma spectrophotometer (ICP-OES, GBC, Australian Model) [34, 35].
Exchangeable Calcium (Ca) and Magnesium (Mg): Extracted using a 1 N ammonium acetate solution and analyzed using an atomic absorption spectrophotometer (GBC 906, Australian Model) [36, 37].
Bulk Density: Measured using the soil core method by determining the soil mass in a given volume [38]. This indicates soil compaction, which influences water infiltration and root penetration.
Mass of soil (g)
Calcium Carbonate (CaCO3): Estimated using acid neutralization and calcimeter methods. The soil was treated with dilute acetic acid, and the released CO2 volume was measured. This indicates the soil buffering capacity and the potential for lime-induced alkalinity. The Cation Exchange Capacity (CEC) was measured following the procedure described by [39].
Plant Sampling and Analysis
Sample Preparation
Fifteen whole-plant sorghum (rabi) and soybean (kharif) samples were collected from the field post-harvest. Both grain and straw samples were collected and analyzed for nutrient content. Samples were air-dried for 2-3 days on clean, dust-free surfaces at ambient temperature. This step prevented contamination and retained the integrity of the samples. Dried samples were placed in an oven at 65ºC to remove residual moisture. This ensured consistent and accurate weight measurements for subsequent analysis.
Nutrient Analysis
Nitrogen (N): Measured using the micro-Kjeldahl distillation method after digestion, as digested with concentrated sulfuric acid (H2SO4) and hydrogen peroxide (H2O2), breaking down the organic bonds and releasing nitrogen as ammonium ions (NH4+) [40]. Ammonia was distilled and trapped in a boric acid solution, then titrated with standard HCl to determine nitrogen content.
Where S: Sample titration volume, B: Blank titration volume, N: Normality of HCl, and W: Weight of the sample in grams.
Phosphorus (P): Estimated by digesting plant samples in a di-acid mixture (HNO3: HClO4 in a 3:1 ratio). The digested solution was reacted with Barton’s reagent, forming a yellow-colored complex proportional to phosphorus concentration. Absorbance was measured at 420 nm using a UV-VIS spectrophotometer [39]. Phosphorus availability is critical for energy transfer and metabolic processes in plants.
Potassium (K): Potassium in the di-acid digest was analyzed using a flame photometer (Systronic manufacture). The intensity of the emitted light (at a specific wavelength) indicated potassium concentration. This method is highly sensitive and specific for detecting potassium in plant tissues and regulates water use, enzyme activation, and photosynthesis in plants.
Results and Discussion
Effect of Sewer Water Application on Soil Physicochemical Properties
Table 2 shows information regarding the soil’s pH, EC, organic carbon, calcium carbonate, cation exchange capacity, and bulk density. The findings showed that during the kharif season, the soil’s pH ranged from 7.05 to 8.09 with a mean value of 7.67, while during the rabi season, it ranged from 7.39 to 8.25 with a mean value of 7.92. In the same way, the soil EC varied from 0.25 dS m-1 to 0.52 dS m-1 with a mean value of 0.39 dS m-1 during the kharif season and from 0.42 dS m-1 to 0.74 dS m-1 with a mean value of 0.55 dS m-1 during the rabi season.
Table 2.
Physicochemical properties of the study area after 40 years of continuous application of the sewer water.
The study area’s soil organic carbon concentration varied from 3.1 g kg-1 to 9.9 g kg-1, with a mean value of 6.37 g kg-1 during the kharif season, and from 4 g kg-1 to 10.8 g kg-1, with a mean value of 7.47 g kg-1 during the rabi season. Similar to this, the calcium carbonate concentration in the soil in the examined area varied from 29.0 g kg-1 to 69.84 g kg-1 with a mean value of 56.98 g kg-1 in the rabi season and from 30.12 g kg-1 to 70.95 g kg-1 in the kharif season. The results also indicated that during the kharif season, the bulk density of the soil varied from 1.18 g cm-3 to 1.45 g cm-3, with a mean value of 1.32 g cm-3, while during the rabi season, it ranged from 1.2 to 1.46 mg m-3. In the same way, during the kharif season, the soil’s CEC varied from 50.12 cmol (P+) kg-1 to 58.45 cmol (P+) kg-1 with a mean value of 52.88 cmol (P+) kg-1, and during the rabi season, it varied from 49.61 cmol (P+) kg-1 to 58.26 cmol (P+) kg-1 with a mean value of 52.80 cmol (P+) kg-1.
The results revealed higher mean soil pH in rabi than in kharif season. This might be due to the leaching of the basic cations (e.g., Ca, Mg, K) from the top soil layer (0.30 cm) into the below soil horizons and leaving more stable minerals that are rich in Fe and Al oxides [41, 42]. The higher mean soil EC in the kharif season compared to rabi season might be due to more sewer water contamination in summer and may enhance the high build-up of the salts in the soil [43]. Organic carbon was present more during the rabi season than during the kharif season. The declining trend in soil organic carbon during the kharif season might be due to higher temperatures than the rabi season, as high temperatures enhance soil organic matter decomposition rates (microbial respiration) [44, 45]. No difference was observed in the mean values of soil bulk density and CEC in the rabi and kharif seasons.
Effect of Sewer Water Application on Soil Nutrient Contents
Table 3 presents the soil N, P, K, S, exchangeable Ca, and Mg information. During the kharif season, soil nitrogen content ranges from 100.4 kg ha-1 to 281.36 kg ha-1 with a mean value of 224.88 kg ha-1, and during the rabi season, it ranges from 115.12 kg ha-1 to 294.45 kg ha-1 with a mean value of 236.56 kg ha-1. According to further data, the available phosphorus level in the soil varies from 6.78 kg ha-1 to 14.96 kg ha-1, with a mean value of 9.78 kg ha-1 during the kharif season and from 8.12 kg ha-1 to 17.85 kg ha-1 with a mean value of 12.71 kg ha-1 during the rabi season. With a mean value of 514.87 kg ha-1 in the kharif season, the potassium content ranges from 370.96 kg ha-1 to 796.34 kg ha-1; in the rabi season, it ranges from 357.45 kg ha-1 to 784.69 kg ha-1 with a mean value of 503.96 kg ha-1. In the rabi season, the soil exchangeable calcium concentration varies from 14.95 cmol (P+) kg-1 to 31.7 cmol (P+) kg-1 with a mean value of 23.51 cmol (P+) kg-1. The range of values is 18.45 cmol (P+) kg-1 to 35.12 cmol (P+) kg-1.
The exchangeable magnesium concentration in the soil varies during the kharif season, with a mean value of 18.97 cmol (P+) kg-1 and a range of 13.45 to 24.96 cmol (P+) kg-1. The mean value throughout the rabi season is 17.30 cmol (P+) kg-1, with a range of 10.7 to 23.7 cmol (P+) kg-1. During the kharif season, the accessible soil sulfur varies between 4.12 and 8.89 mg kg-1, with an average of 5.72 mg kg-1. It has a mean value of 5.45 mg kg-1 and varies from 4.0 mg kg-1 to 8.49 mg kg-1 during the rabi season.
The results of the soil nutrient analysis revealed that after 40 years of continuous application of sewer water, no build-up of the soil’s available N and P was reported. However, a build-up of the soil’s available K was observed after 40 years of continuous application of sewer water. Results further indicate that the soils were deficient to sufficient in soil-available sulfur content after 40 years of continuous application of sewer water. The critical limit of soil-available sulfur is 10.7 mg kg-1 for soils in Maharashtra, as previously reported by [46].
Table 3.
Soil nutrient contents of the study area after 40 years of continuous application of the sewer water.
Similarly, no build-up was observed for the soil exchangeable Ca and Mg in the study area. The activity of nitrogen-fixing bacteria may be the best explanation for the elevated nitrogen concentrations during the rabi season. Evidence shows that the rabi season is associated with higher rates of biological nitrogen fixation and mineralization, leading to an increase in the season’s nitrogen content [47, 48]. The findings demonstrated little nutrient drainage from the soil throughout the rabi season with little to no rain, which caused an accumulation of high levels of nutrients during this time. It is well known that phosphorus levels in soil with maximum leaching are lower than in soil with minimum leaching. This was consistent with the study of [49] and [22]. Additionally, it was noted that the rabi season had higher potassium levels than the kharif season. This difference can be attributed to the rabi season’s tendency to experience elevated potassium levels as a result of soil equilibrium changes from freezing and thawing, which release fixed potassium from non-exchangeable forms [22, 23]. The increased levels of exchangeable calcium and magnesium during the kharif season may result from the sorghum crop’s lower absorption than the soybean crop during the rabi season.
Effect of Sewer Water Application on Straw and Grain Nutrient Contents of Sorghum
Table 4 contains information related to examining plant nutrients in sorghum grain and straw. With a mean value of 0.61%, the nitrogen content of sorghum straw varies from 0.51% to 0.78%. On the other hand, it has a mean value of 0.91% and varies from 0.82% to 1.12% in sorghum grain. Straw contains 0.20% to 0.36% phosphorus, with a mean of 0.28%. With a mean value of 0.48%, it varies from 0.33% to 0.58% in grain. Additional data showed that straw had a mean potassium content of 3.36%, with a range of 3.09% to 3.98%. On the other hand, it varies with grain, from 2.38% to 3.08%, with a mean of 2.72%. Straw has a mean sulfur level of 0.37%, with a range of 0.21% to 0.52%. In contrast, the range for grain is 0.85% to 1.37%, with a mean of 1.07%. Effective water use in irrigation and maintaining sufficient N improved grain sorghum’s biomass, nitrogen use, and nitrogen use efficiency [50]. Additionally, irrigation rates have been found to significantly affect infiltration rate and soil-saturated hydraulic conductivity, with higher moisture contents leading to a decrease in these parameters [51, 52].
Effect of Sewer Water Application on Straw and Grain Nutrient Contents of Soybean
Data pertaining to soybean nutrient contents are shown in Table 5. Results revealed that nitrogen in soybean straw ranges from 0.58% to 0.70%, with a mean value of 0.63%. While in soybean seeds, it ranges from 5.01% to 5.93%, with a mean value of 5.47%. The phosphorus in soybean straw ranges from 0.17% to 0.31%, with a mean value of 0.24%. Meanwhile, the P content in seed ranges from 0.34% to 0.58%, with a mean value of 0.47%. The potassium content in soybean straw ranges from 1.29% to 1.8%, with a mean value of 1.49%, and it ranges from 1.26% to 1.76%, with a mean value of 1.45% in the seed. Similarly, sulfur content in soybean straw ranges from 0.11% to 0.21%, with a mean value of 0.16%, while it ranges from 0.77% to 0.92%, with a mean value of 0.81% for seeds. Results further showed that the N, P, and S content was higher in sorghum grain, while K content was higher in sorghum crop straw [53]. Similarly, N, P, and S were greater in soybean seeds, while K content was higher in soybean straw.
Table 4.
Nutrient contents in sorghum straw and grain.
Table 5.
Nutrient contents in soybean straw and seed.
Effect of Sewer Water Quality from Drainage and Wells near the Sorghum Field
The analysis of water quality parameters, as summarized in Table 6, reveals notable differences between morning and evening sewage water and well water. The electrical conductivity (EC) of morning sewage water was recorded at 1.18 dS m-¹, while evening sewage water showed a higher EC value of 1.33 dS m-¹. In comparison, well water had an EC range of 0.539 to 0.714 dS m-¹, with a mean value of 0.649 dS m-¹, indicating relatively low salinity levels [16, 31]. Carbonate content in morning sewage water was 12 meq L-¹, increasing to 14 meq L-¹ in the evening, whereas well water exhibited a carbonate range of 0.4 to 1.6 meq L-¹, with a mean value of 0.96 meq L-¹. Bicarbonate levels showed the opposite trend: morning drainage water contained 1.2 meq L-¹, reducing to 0.8 meq L-¹ in the evening. Well water displayed a bicarbonate range of 3.6 to 5.6 meq L-¹, with an average of 4.48 meq L-¹, indicating a more consistent bicarbonate concentration [16, 54]. Chloride levels in morning sewage water were measured at 8.0 meq L-¹, slightly decreasing to 7.6 meq L-¹ in the evening. Well water, by contrast, showed a chloride range of 3.6 to 5.2 meq L-¹, with a mean value of 4.56 meq L-¹, indicating a relatively low salinity hazard from chloride ions [10, 55].
The calcium content in the morning sewage water was 4.2 meq L-¹, increasing marginally to 4.6 meq L-¹ in the evening. Well water had calcium levels ranging from 1.6 to 3.2 meq L-¹, with a mean of 2.32 meq L-¹. Magnesium in morning sewage water was 4.8 meq L-¹, with evening values remaining consistent. By comparison, well water magnesium levels ranged from 1.6 to 3.2 meq L-¹, averaging 2.44 meq L-¹ [8]. The sodium adsorption ratio (SAR), a key parameter in assessing water suitability for irrigation, was significantly higher in sewage water. Morning drainage water had a SAR of 5.4, which increased to 6.8 in the evening. In contrast, well water exhibited a much lower SAR range of 0.98 to 1.51, with a mean value of 1.25, indicating better suitability for irrigation purposes [19]. The residual sodium carbonate (RSC) values further highlighted the differences between water sources. Morning drainage water had an RSC of 4.0 meq L-¹, slightly decreasing to 3.8 meq L-¹ in the evening. On the other hand, well water had an RSC range of 0.4 to 1.2 meq L-¹, with a mean of 0.68 meq L-¹. These findings suggest that prolonged use of untreated sewage water could lead to soil sodicity, necessitating appropriate management strategies [2].
Effect of Long-Term Application of Sewer Water on the Soil
Long-term sewage irrigation has been shown to enhance soil macronutrient content, including nitrogen (N), phosphorus (P), and potassium (K). The study revealed that soil nitrogen levels ranged from 100.4 kg ha-¹ to 281.36 kg ha-¹ during the kharif season, with a mean value of 224.88 kg ha⁻¹, and increased further during the rabi season to a range of 115.12 kg ha⁻¹ to 294.45 kg ha⁻¹ with a mean value of 236.56 kg ha⁻1. Phosphorus levels also showed an upward trend, with mean values of 9.78 kg ha⁻¹ and 12.71 kg ha⁻¹ in the kharif and rabi seasons, respectively. The organic carbon content in the soil increased over time, with a mean value of 6.37 g kg⁻¹ during the kharif season and 7.47 g kg⁻¹ in the rabi season. This improvement positively impacted soil structure, water retention, and microbial activity, indicating that sewer water contains a variety of dissolved and suspended substances that significantly impact the soil’s physical, chemical, and biological properties [15].
Sodium-rich sewer water caused soil dispersion and reduced aggregate stability, resulting in poor aeration and water infiltration. While cation exchange capacity (CEC) remained stable across seasons (mean values of 52.88 cmol kg⁻¹ in kharif and 52.80 cmol kg⁻¹ in rabi), this was likely due to the soil’s buffering capacity. However, areas with high sodium levels experienced degradation over time. Using sewer water reduced the dependency on synthetic fertilizers by recycling nutrients, particularly in resource-constrained areas. This approach also addressed freshwater scarcity using an alternative water source [56, 57]. The application of sewer water for irrigation has been a subject of interest, as it can provide a reliable water source for agricultural production, particularly in regions with limited water resources [5, 54]. However, the long-term effects of this practice on soil properties and ecosystem health require careful consideration.
Table 6.
Water samples from drainage and wells near the sorghum research station of the Parbhani district of the Marathwada region.
Conclusions
Utilizing wastewater can be beneficial because it reduces adverse impacts on the quality of downstream water resources, recycles minerals found in the wastewater, and closes the growing gap between water supply and demand, especially in semi-arid areas. The study found significant changes in soil properties, such as pH, organic matter content, and nutrient levels, due to continuous sewer water application and that plant nutrient contents are influenced by the type of crop grown and the specific nutrients present in the sewer water. Similarly, the positive influence of sewage water on available nutrients was found more during the rabi season than the kharif season, with the plant nutrient contents increasing the variables in grain and straw in both crops. Furthermore, the results suggest that the long-term use of sewer water for irrigation can both positively and negatively impact soil fertility and plant growth, offering valuable insights for agricultural practices in areas where sewer water is used for irrigation. Further studies are needed to explore the long-term effects of sewer water irrigation on soil health, crop productivity, and environmental sustainability.

