

Introduction
Tourism has the potential to narrow the income gap between impoverished and affluent communities, and serves as an agent of change in economic development [1]. The People’s Government of Henan Province has taken tourism as a pillar industry for poverty alleviation in Funiu Mountain area which is one of the 14 poverty-stricken regions in China [2]. By the generally adopted “Scenic spots + communities + smallholder” tourism development model in rural revitalization in China, household owned and operated is the main way for farmers to participate in tourism. Due to the vulnerable socio-ecological systems (SESs), household tourism operation system are generally highly exposed to multiple disturbance such as seasonality, consumer volatility, and institutional changes [3]. Thus, understanding and grasping livelihood adaptability and the susceptibility to multiple disturbance are of the most important issues faced by local stakeholders aiming to promote the rural transformation and sustainable development [4].
Over the past few years, numerous studies have been conducted to assess livelihood vulnerability at community and individual levels [5, 6]. According to Chambers and Conway, a livelihood comprises the capabilities, assets (including both material and social resources) and activities that contribute to a means of living. A livelihood is sustainable when it can cope with and recover from stresses and shocks, maintain or enhance its capabilities and assets while not undermining natural resources [7, 8]. While recognizing that poor people are always exposure to vulnerability context, the SLF seeks to militate against such insecurity through building up adaptive capacity, a key concept relevant to resilience [9]. In the SLF, adaptive capacity is mainly structured by five livelihood assets [10]. The transforming structures and processes operating at multiple levels shape access to resources [11]. Although the SLF to a limited extent addresses the issues of sensitivity and adaptive capacity to shocks, it has been criticized for emphasizing on short-term coping with immediate shocks and less focusing on long-term dynamics [12].
By the Intergovernmental Panel on Climate Change (IPCC) vulnerability definition, vulnerability is considered to be a function of exposure to climate impacts, and the sensitivity and adaptive capacity of the system being exposed [13]. Vulnerability is implicit in SLF [14]. In this context, vulnerability refers to the susceptibility to circumstances of not being able to sustain a livelihood [9]. Recently, an increasing number of studies link IPCC’s vulnerability framework with SLF to quantify livelihood vulnerability at the household or community levels, such as the livelihood vulnerability index [11], the multidimensional livelihood vulnerability index [15], and the socio-environmental vulnerability index [16]. These conceptual frameworks provide the foundation for our livelihood vulnerability assessment with tourism smallholders. However, many scholars indicate that due to the local characteristics of livelihood system, more local-level analyses are necessary to gain a better understanding of livelihood vulnerability and for better targeting of resilience building [12].
By previous studies, understanding of vulnerability both in SES and SLF research strands relate to ideas of resilience representing adaptive capacity [17]. Resilience applied to SES has at least three core elements involving: response to disturbance, capacity to self-organize, capacity to learn, and adapt to disturbance [18-20]. Resilience thinking is implicit in the SLF [21]. Livelihood resilience refers to the capacity of livelihoods to cushion stresses and disturbances while maintaining or improving essential properties and functions [22, 23]. Linking SLF to resilience thinking can enhance the understanding with livelihood dynamics, and how households maintain and enhance their livelihoods in the face of change [24]. Recently, some efforts have been made on characterizing livelihood resilience, such as the concept of “layers of resilience” [9], the livelihood resilience framework for identifying the attributes and indicators [22], and the tourism destination resilience framework [25]. Unfortunately, few livelihood resilience framework have been tested and modified to date [23].
Vulnerability and resilience constitute different but overlapping research themes in sustainability science [19]. Some vulnerability research cluster employs the term resilience as the coping capacity [26], while resilience views vulnerability as an antonym for its label [27]. From a comprehensive perspective, an increasing number of studies believe that a combining of vulnerability and resilience contribute to a more comprehensive understanding the livelihood system evolution in dynamic context and the building of capacity for adaptive action.
By the discussion above, a convergence of vulnerability, resilience, and livelihood can complement and significantly add to the understanding of vulnerability and help us to better identifying key elements for future resilience building. On the other hand, few studies have quantitatively examined household livelihoods vulnerability in tourism-guided rural transformation. Thus, this paper fitstly proposes the TLVI, by combining the SLF, IPCC’s vulnerability framework, and resilience, in consideration of the rural toursim development model of “Scenic spots + communities + smallholder” in poverty-stricken areas in China. Then, household livelihood vulnaerabiliy of four livelihood strategies is empirically examined using household and community date.
Material and Methods
Study Sites
Yihe River is an important tributary on the south bank of the Yellow River, with a total length of 264.88 kilometers and a drainage area of more than 6100 square kilometers. The upper reaches of the Yihe River are in Luanchuan County, in deep Funiu Mountain region. The upper reaches of the Yihe River have a length of 11 kilometers and a drainage area of more than 1053 square kilometers, with an Altitude from 450 m to 2212.5 m. It is core area of a national nature reserve that provides biodiversity protection and soil and water conservation along the middle route of the South-to-North Water Transfer Project. The per capita cultivated land area here is close to the warning line of 0.05-hectare per capita cultivated land by FAO. This region is one of 14 contiguous poverty-stricken areas in China.
The “project plans for poverty alleviation of Henan Province (2014-2020)” regards tourism as an important way to accelerate the rural revitalization in this area. Under the comprehensive influence of China’s rural governance system and the development level in study area, rural tourism here adopts a model of “Scenic spots + communities + smallholder”. By the end of 2019, 45 villages regard rural tourism as the leading industry, with 1205 agritainments operated by smallholders and 3880 direct employees. Tourism livelihood in this area face multiple livelihood risks, such as competition risk, demand change risk, seasonal fluctuation, knowledge risk, and policy risk [3].
Conceptual Livelihood Vulnerability
It has been implied in previous literature that resilience, SLF, and vulnerability constitute different but overlapping research themes embraced by sustainability science [14]. In our research, the three frameworks are combined to conceptual livelihood vulnerability of tourism smallholders. The three dimensions of the IPCC vulnerability framework were adopted as the major elements of TLVI. Resilience was introduced to manifest the adaptive capacity of IPCC vulnerability framework. The SLF is employed to provide the starting point for identify the sub-elements of exposure (Exp), sensitivity (Sen), and adaptive capacity (Ada Cap). The proposed framework is shown in Fig. 1.
Exposure refers to the nature and degree to which tourism-based livelihood systems are susceptible to significant livelihood context changes [13]. By our survey and relevant studies, the livelihood systems of tourism smallholders in the study area are generally prone to multiple risks, such as disruption, seasonality, consumer volatility, and institutional change.
Sensitivity refers to the degree to which a livelihood system is affected by or responsive to livelihood risks. Livelihood sensitivity measurement metrics have been developed in many previous studies [11]. Based on relative references [28] and the livelihood characteristics of tourism smallholders in the study area, income loan ratio, dependency ratio, and community poverty were selected in this study to represent household livelihood sensitivity.
Buffer capacity refers to the amount of disturbance a system can absorb and still retain the same structure, function, identity [20]. By previous literature, the five household assets-natural, social, financial, physical, and human, assets are the core content of “buffer capacity” in TLVI [22]. In addition, a sustained system needs to learn from experience and is embedded in relations among local people [12, 29], Risk experience and Community cohesion were identified as another two basic elements for Buffer capacity.
Capacity for reorganization refers to the capacity to renew and reorganize the livelihood system for a new development trajectory [30]. From the perspective of dynamic capabilities, exploring and adopting new opportunities [31], creating new products [32], and developing collaborative relationships [20] are viewed as factors for building new routines. Based on previous literature, three variables for Capacity for reorganization were identified: Entrepreneurship, Strength of developers, and the self-efficacy of smallholders.
A resilient SES is a learning system which is not just acquiring knowledge and skills but also translating the knowledge into action [22]. From perspective of strategic management, three significant attributes of Learning capacity are identified: proactive learning capabilities, knowledge identification capability, and commitment to learning culture [29]. Considering the tourism livelihood systems in rural transformation, proxy indicators corresponding to the three primary attributes were identified as follows: Motivation of learning, Knowledge identification capability, and Knowledge transfer capability.
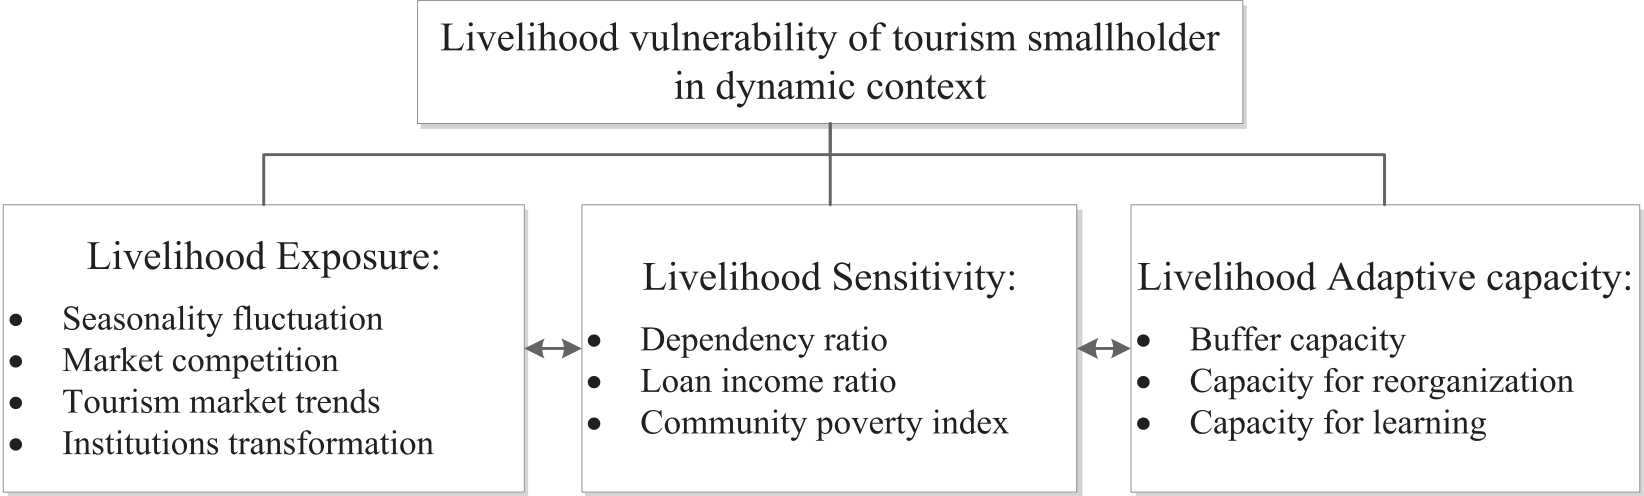
A review of both theoretical and empirical literature related to livelihoods, vulnerability, and resilience serves as the basis for identifying the contributing factors [9, 14, 22, 28, 33]. The contributing factors are specific to household tourism operation system embedded in the rural tourism development model of “Scenic spots + communities + smallholder” in poverty-stricken aeras in China (Table 1 and Table 2).
Data Collection
Participatory rural appraisal and convenience sampling were used to investigate tourism smallholders. Seven tourism villages in the upper reaches of the Yihe River were covered in this survey (Fig. 2 and Table 3). The interviewers were trained in the survey technique and confidentiality protocol. 540 households were interviewed in October 2019 and June 2020. Generally, the heads of the households were interviewed, but if they were unavailable, their spouses were interviewed. A total of 540 questionnaires were distributed to tourism smallholders, and 524 effective questionnaires were collected, with a recovery rate of 97.04%. It was shown by the reliability and validity test results that the value of corrected item-total correlation coefficient f value, Cronbach’s alpha coefficient, Kaiser-Meyer-Olkin value, and the Bartlett sphere test p-value are 0.631, 0.875, 0.857, and 0.00, respectively.
Table 1.
List of indicators selected for each dimension of vulnerability.
Table 2.
List of indicators of five livelihood assets.
Calculation Livelihood Vulnerability
Following previous studies [11], the TLVI was derived for each of the sampled households using three major components: exposure (Exp), sensitivity (Sen), and adaptive capacity (Ada Cap). Each significant component included several sub-components. Each sub-component was calculated considering a 4-point scale. We standardized the values of the sub-components using the following equation to scale each sub-component from 0 to 1:
where IndexXij denotes the standardized value of the sub-indicator for the household i, Sij denotes the j th raw indicator value of household i, Smin and Smax denote the minimum and maximum possible values, respectively.
The indicators were averaged using Eq. (1) to calculate the value of the vulnerability dimensions for each index, according to Eq. (2):
where Fi denotes the value of one of the components of household i, including exposure (Expi), sensitivity (Seni), buffer capacity (BCi), self-organization capacity (SOCi), and learning capacity (LCi). IndexXij is the indicator value of the j th indicator, and n indicates the number of sub-components in each major component.
Specifically, referring to the calculation method for the adaptation capability index [34,35], three contributing factors of resilience (i.e., BC, SOC, and LC) were combined to calculate the Ada Capi using Eq. (3):
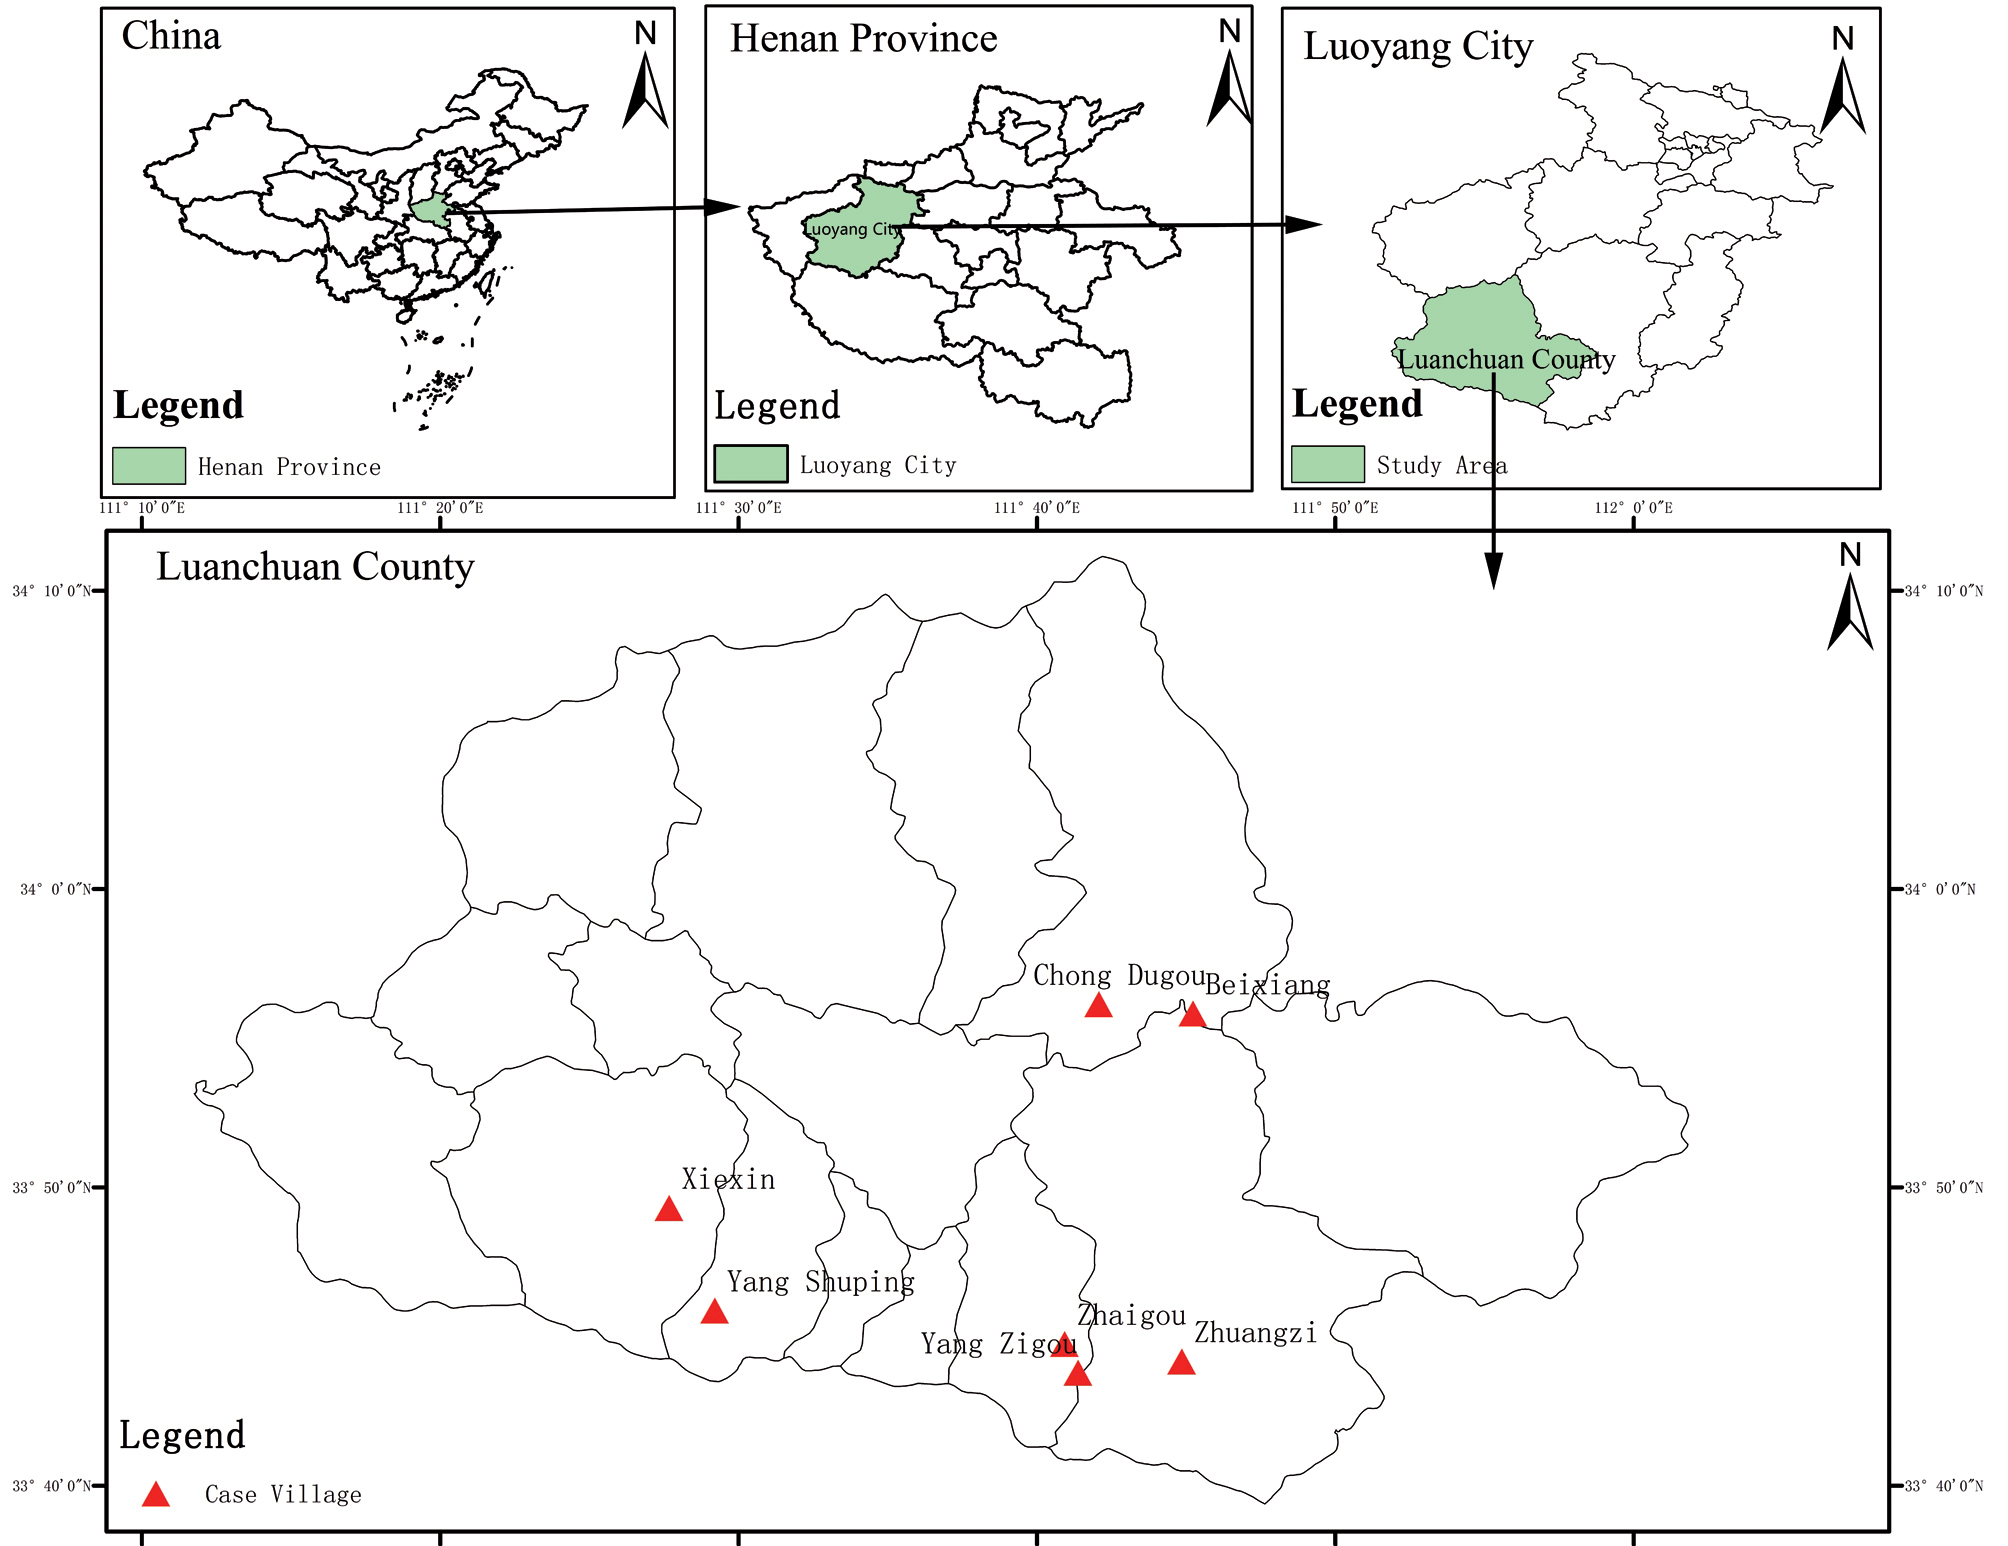
Table 3.
Distribution of sample smallholders.
where Ada Capi is the value of the adaptive capacity of the i th household, BCi is the calculated buffer capacity score, SOCi is the calculated self-organization capacity score, and LCi is the capacity score for learning.
Based on the previous researches [16, 17], the three major components (Exp, Sen, and Ada Cap) of the IPCC vulnerability framework were combined as in Eq. (4):
where TLVIi denotes the vulnerability index for household i based on the IPCC vulnerability framework, Expi denotes the calculated exposure score, Ada Capi denotes the adaptative capacity score, and Seni denotes the sensitivity score. The TLVIi values ranged from -1 to +1 [11]. We applied the conversion [TLVI × (0.5) + 0.5] to scale it from 0 to 1 and facilitate its comparison at different levels. Reference to the existing research, the value of major component, sub-component, and the TLVI was classified into three levels: low level (0.00-0.33), moderate level (0.34-0.66), and high level (0.67-1.00).
Table 4.
Income structure of the sample smallholders.
| Source of income (10K yuan) | Agriculture and Forestry | Agritainment operation | Urban non-agricultural employment |
|---|---|---|---|
| Income | 0.09 | 13.52 | 5.23 |
| Proportion (%) | 0.00 | 72.00 | 28.00 |
According to previous study [36], the usual expression of the Gini coefficient is given by Eq. (5):
where G is the Gini coefficient, μ is the mean value of the distribution, N is the sample size, and yi is the income of the i th sample unit.
Results and Discussion
Differences in Livelihood Strategies
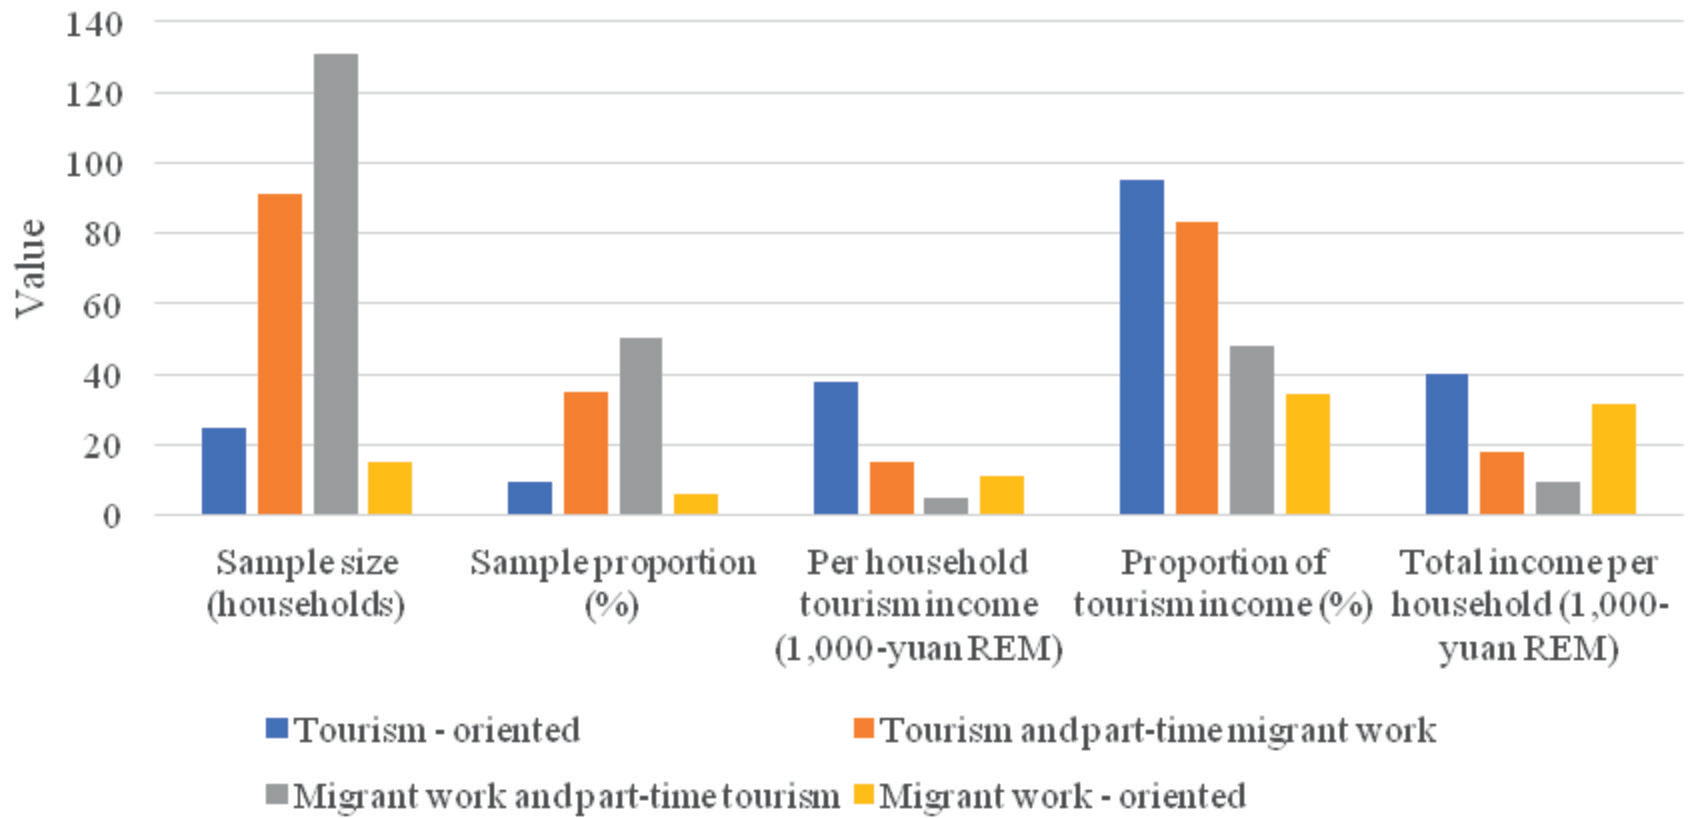
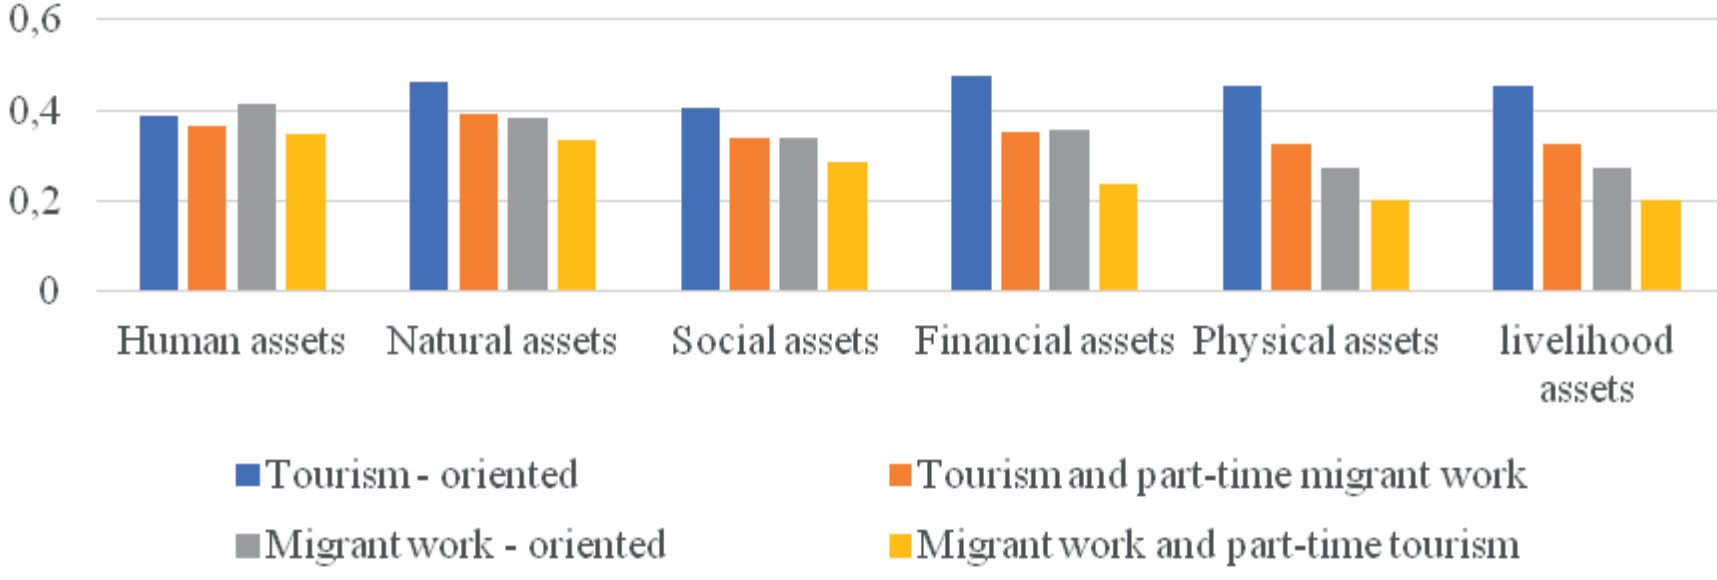
With the promotion of returning farmland to forests and the rise of rural tourism since 1999, farmers in the study area have gradually transitioned away from traditional agricultural and forestry livelihoods (Table 4). During tourist season, many farmers participate in agritainment operations, while in the low tourist season, they participate in migrant work [37]. By using k-means clustering method, the smallholders were divided into four livelihood types based on income from tourism and migrant work [38, 39]: Tourism – oriented (TO), Tourism and part-time migrant work (TPM), Migrant work and part-time tourism (MPT), and Migrant work – oriented (MO). Fig. 3 and Fig. 4 show the different livelihood characteristics of each group by Kruskal-Wallis test.
MO smallholders are generally high educated mainly living and working in the cities. Given their high expenditure on housing and education, they have resorted to agritainment ventures as a means of reducing financial pressure [40]. In contrast, MPT smallholders are typically marginalized rural groups who have limited access to urban non-agricultural employment and rural tourism, and frequently confront pressures concerning family income and expenses [41]. TO and TPM smallholders are the major groups for agritainment operation. They take root in rural areas and take rural tourism as the main livelihood [42]. TO smallholders are often rural elite groups with entrepreneurial spirit in agritainment operation showing a demonstration effect on residents [43]. TPM smallholders are often followers of TO smallholders in agritainment operation [44].
Livelihood Vulnerability of the four Livelihoods Groups
Livelihood Exposure
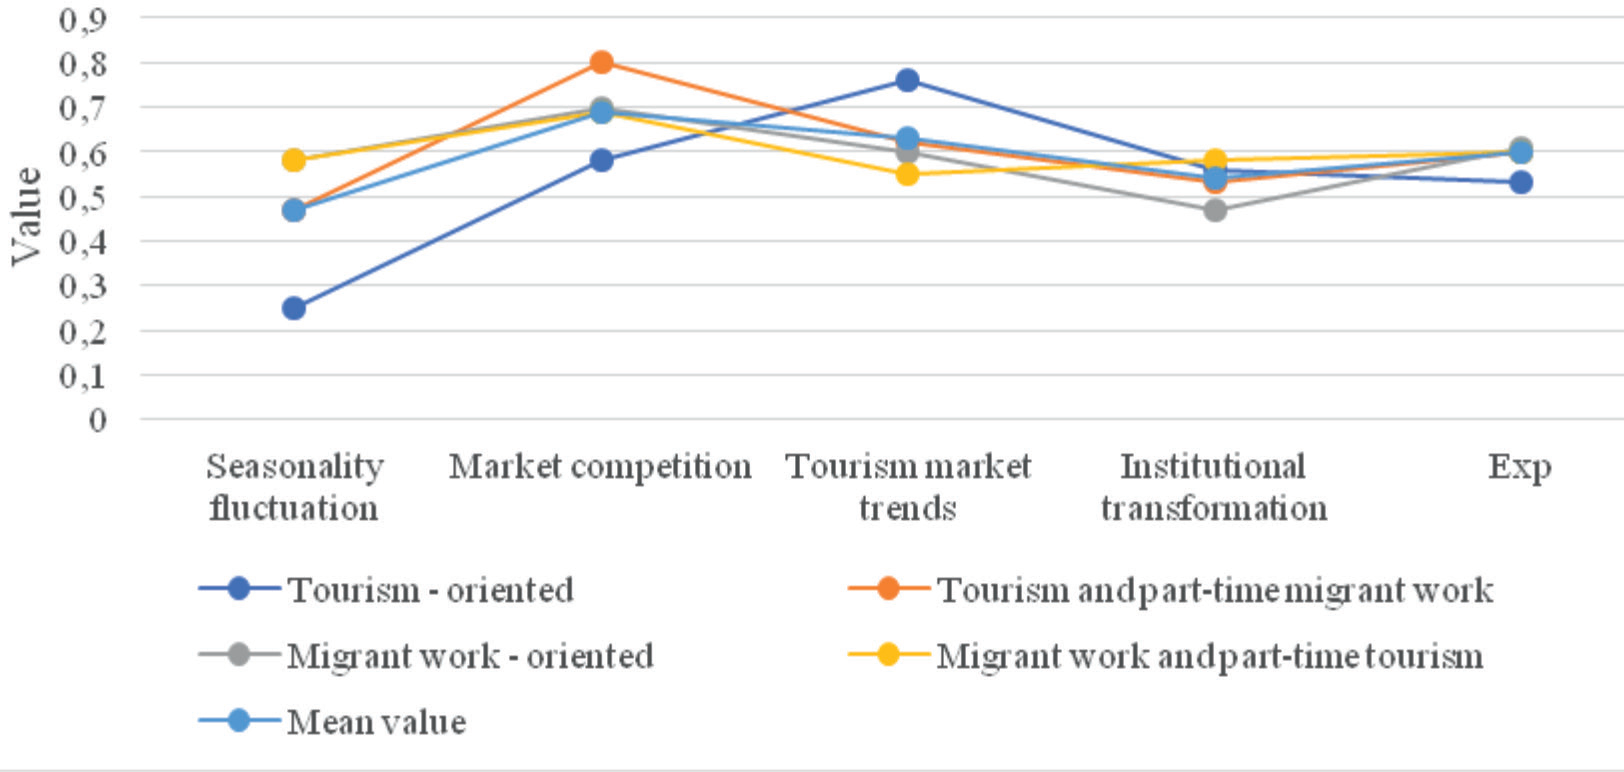
TO smallholders have the least exposure to environmental changes compared to MPT and TPM smallholders (Fig. 5). Our survey revealed that TO smallholders primarily focus on the high-end tourism market which is mild seasonal fluctuations and low market competition [40]. However, changes in tourism consumption attitudes of the high-end tourism market prompt TO smallholders to renovate the agritainment facilities and house for rapid response to fluky market. [48]. Thus, TO smallholders have emerged as leaders in household tourism operation innovation.
MO smallholders are exposed to the highest level of dynamic context (0.61) followed by TPM (0.60) and MPT smallholders (0.60). MO smallholders primarily targets the low-end mass tourist market, which have significant seasonal variations. Correspondingly, MO smallholders shows higher seasonal variability (0.58) than TPM smallholders (0.47). Besides, MO smallholders are less exposed to market competition (0.70) and demand variability (0.60) than that of TPM smallholders (0.80 and 0.62, respectively), because most of the Summer Vacation and Research Tourism Market are repeat customers [45]. Furthermore, MO smallholders perceive the least disturbance from market-oriented institution transformation (0.47) compared to other three groups, indicating that the agritainment operation of MO smallholders is a type of market behavior and depends less on government support [35].
The demonstration effect of elite smallholders motivates TPM smallholders to engage in agritainment operations. Their agritainment operations chiefly target the mass tourism market, which is characterized by significant seasonality and less variation in tourism consumption attitudes compared to the high-end tourism market [46]. As a result, TPM are more exposed to seasonal fluctuations (0.47) and have lower exposure to trends in the tourism market (0.70) than TO smallholders. Moreover, TPM smallholders shows the highest market competition (0.80), followed by MO smallholders. Previous studies have found that agritainment operations concentrated in the mass tourism market have created a herd effect, due to the homogeneity of livelihood assets and the sharing of livelihood knowledge among farmers [47]. TPM smallholders have a lower exposure to institutional transformation pressure (0.47) compared to TO smallholders (0.58). This is mainly due to that they are imitators and followers of TO smallholders in household tourism operation, which are less affected by the basic system transformation in terms of access to resources and opportunities [43].
MPT smallholders are often situated far from major tourist routes and tourist agglomeration zones [48]. Due to limitations in development opportunities, MPT smallholders have the lowest livelihood assets (0.33) compared with the other three livelihood groups. Resident interviews revealed that agritainment operations, such as house renovation, purchasing of daily necessities and home appliances, and facility upgrades, were all restricted due to the lack of financial and human resources. Their investment in agritainment operations is highly dependent on government subsidies, which implies a high exposure to institutional transformation. Moreover, MPT smallholders are typically limited by their geographic location, operation, and investment capability, and thus generally provide lower-end products and services, such as summer vacations for the elderly with the consumption characteristics of low payment capacity, high seasonal fluctuations, and small demand changes [49]. As a result, MPT smallholders are highest exposed to seasonality fluctuation (0.61) and institutional transformation pressure (0.63). In contrast, MPT smallholders had the lowest exposure to market competition (0.53) and tourism market trends (0.50) among the four livelihood groups (Fig. 5).
Livelihood Sensitivity
The mean value of the major indicator on Sensitivity for the four livelihood groups ranged from 0.18 (not sensitive) to 0.34 (moderately sensitive). TO smallholders showed the least sensitivity (0.18). Especially, the sub-indicators on Dependency ratios of TO smallholders showed the least Sensitivity (0.20) among four livelihood groups. The results could be attributed to the fact that operators of High-end agritainment are mostly young family. This is consistent with previous research that an increase in dependency ratio has been reported to reduce the tendency of families to participate in venture capital or entrepreneurship [50]. Besides, TO smallholders had the least sensitivity on Community poverty index (0.06) compared with other three livelihood groups. Previous studies found that agritainments targeting the high-end tourism market generally requires a more favorable development environment which directly or indirectly correspond to more development opportunities and low poverty incidence [38]. TO smallholders had the second lowest sensitivity on Income loan ratio (0.27) followed by MO smallholders (0.20). It may be because high-end agritainment are capital-intensive which also generates high capital gains. In sum, the TO smallholders has developed a positive development cycle of “high-end business – high investment and high return – high self-accumulation – low loan income ratio” in livelihood development. In sum, the livelihood sensitivity of TO smallholders was at a low level (Fig. 6).
The Sensitivity of MO smallholders was equal to that of TO smallholders (0.18 ). MO smallholders had a Dependency ratio of 0.22, which was the second lowest after TO smallholders. In rural China, MO smallholders are typically the Descendant family that have separated from Parental family and migrated to cities. They share the responsibility of supporting the elderly with their sibling families from the same parental families. This trend is consistent with previous research that has shown an increase in rural to urban migration, leading to higher rural aging levels [40]. MO smallholders also showed the least sensitivity to Income loan ratio (0.20) compared to the other livelihood groups, possibly due to that their investment in agritainment are primarily the household savings rather than loans. Additionally, MO smallholders had the second-highest Community poverty index (0.13), right after migrant work and part-time tourism smallholders. This could be attributed to the limited livelihood options which leave high-quality labor with no alternative other than to participate in migrant work in the developed coastal cities.
Among the four livelihood groups, MPT smallholders showed the highest Sensitivity (0.34). In terms of the sub-elements, MPT smallholders had the highest Dependency ratios (0.26), Income loan ratio (0.55), and Community poverty index (0.20), compared to other three livelihood groups. MPT smallholders account for the largest proportion in the sample (50%), and its livelihood sensitivity to some extent reflects the common characteristics of farmers’ livelihoods in poverty-stricken mountain areas. Interestingly, MPT smallholders had lower volume of credit compared with TO smallholders, but they showed a higher Dependency ratio than the latter. One possible explanation for this could be that strong support of rural revitalization policies enhance their access to financial credit, while inadequate livelihood capacity and remote location lead to less access to tourism benefits sharing compared to the other livelihood groups [37].
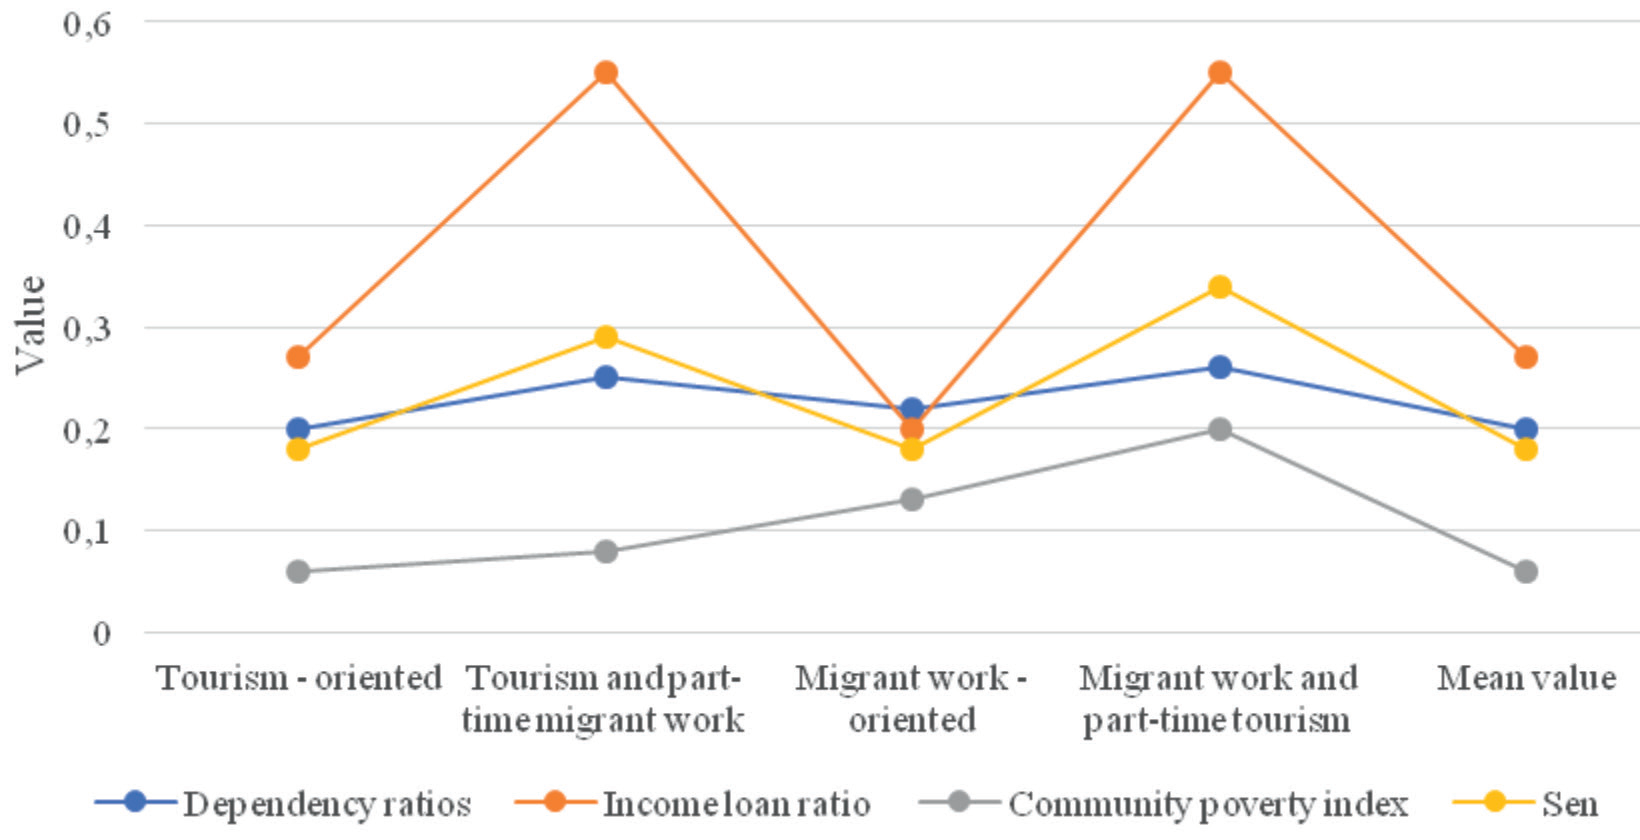
Rural tourism transformed the lifestyles of smallholders and taken subsistence farmers from traditional to modern subsistence [39]. From the perspective of livelihood system evolution, the TPM smallholders is the closest group of MPT smallholders compared with To and Mo smallholders. As expected, the mean Dependency ratio for TPM smallholders is immediately lower than that of MPT smallholders. Additionally, the mean Community poverty index for TPM smallholders (0.08) is lower than that of MPT smallholders (0.20). Interestingly, the mean Income loan ratio for TPM smallholders (0.55, moderately sensitive) is the same as that of MPT smallholders (0.55). As per our survey, TPM smallholders have better access to credit due to their superior location conditions, human assets, and employment opportunities that arise from tourism. Smallholders with such advantages are more likely to embrace adaptation strategies that can generate high incomes.
Livelihood Adaptive Capacity
The TO smallholders have significant advantage in terms of livelihood assets (0.78), entrepreneurship (0.67), self-efficacy (0.82), motivation for learning (0.89), and knowledge transfer and identification capabilities (0.83 and 0.89, respectively), which affect the capacity to engage in tourism (Fig. 7). Previous study found that due to the labor and assets intensive, the agritainment of TO smallholders presents modern enterprise attributes in a sense [51]. By the Structural Hole theory, rural elites were considered important nodes connecting the internal and external relationship networks of rural society, which enhances their access to information and other resource [44]. Through leveraging resources and advantages from structural holes, rural elites transform themselves into entrepreneurs and become role models for residents during the rural transformation.
The mean value of the major indicator on Adaptive capacity for MO smallholders was 0.29, following TO smallholders (0.46). Nevertheless, MO smallholders had the highest Risk experience (0.67) due to their experience and cognition with risk factors, which was facilitated by the good education experience of their household leaders [52]. Specifically, MO smallholders showed high Motivation of learning (0.76) and Knowledge identification capability (0.82), indicating their strong adaptive capacity. Previous research indicates that smallholders with formal education often have better access to new technologies and therefore have greater adaptability in dynamic context [53]. However, the scores for the Motivation of learning (0.76), Knowledge transfer capability (0.69), and Knowledge identification capability (0.82) for MO smallholders were lower than TO smallholders (0.89,0.83, and 0.89, respectively). The result indicates that agritainment operation more often involves comprehensive mobilization of diverse family endowments, while migrant work mainly relates to family labor resources.
The mean value of the major indicator on Adaptive capacity for TPM smallholders was 0.26, following MO smallholders and TO smallholders. Especially, the sub-components on Self-organisation (0.67) and Capacity for learning (0.72) are next only to that of TO smallholders. This finding is in accordance with the existing literature, which reports that TPM smallholders were the followers of tourism-oriented smallholders in agritainment operation [43]. Referring to the sub-components, lack of Buffer capacity (0.51), especially the lack of Livelihood asset (0.54) and Risk experience (0.41) seemed to be the major constraints for TM smallholders. On the other hand, TPM smallholders had higher Self-organization (0.67) and Capacity for learning (0.72) than that of MO smallholders (0.6 and 0.7), although the latter had more experiences of education. The results highlight again the fact that agritainment operation is a kind of Entrepreneurship behavior involving diverse asset investments while migrant work is mainly involving labor force participation.
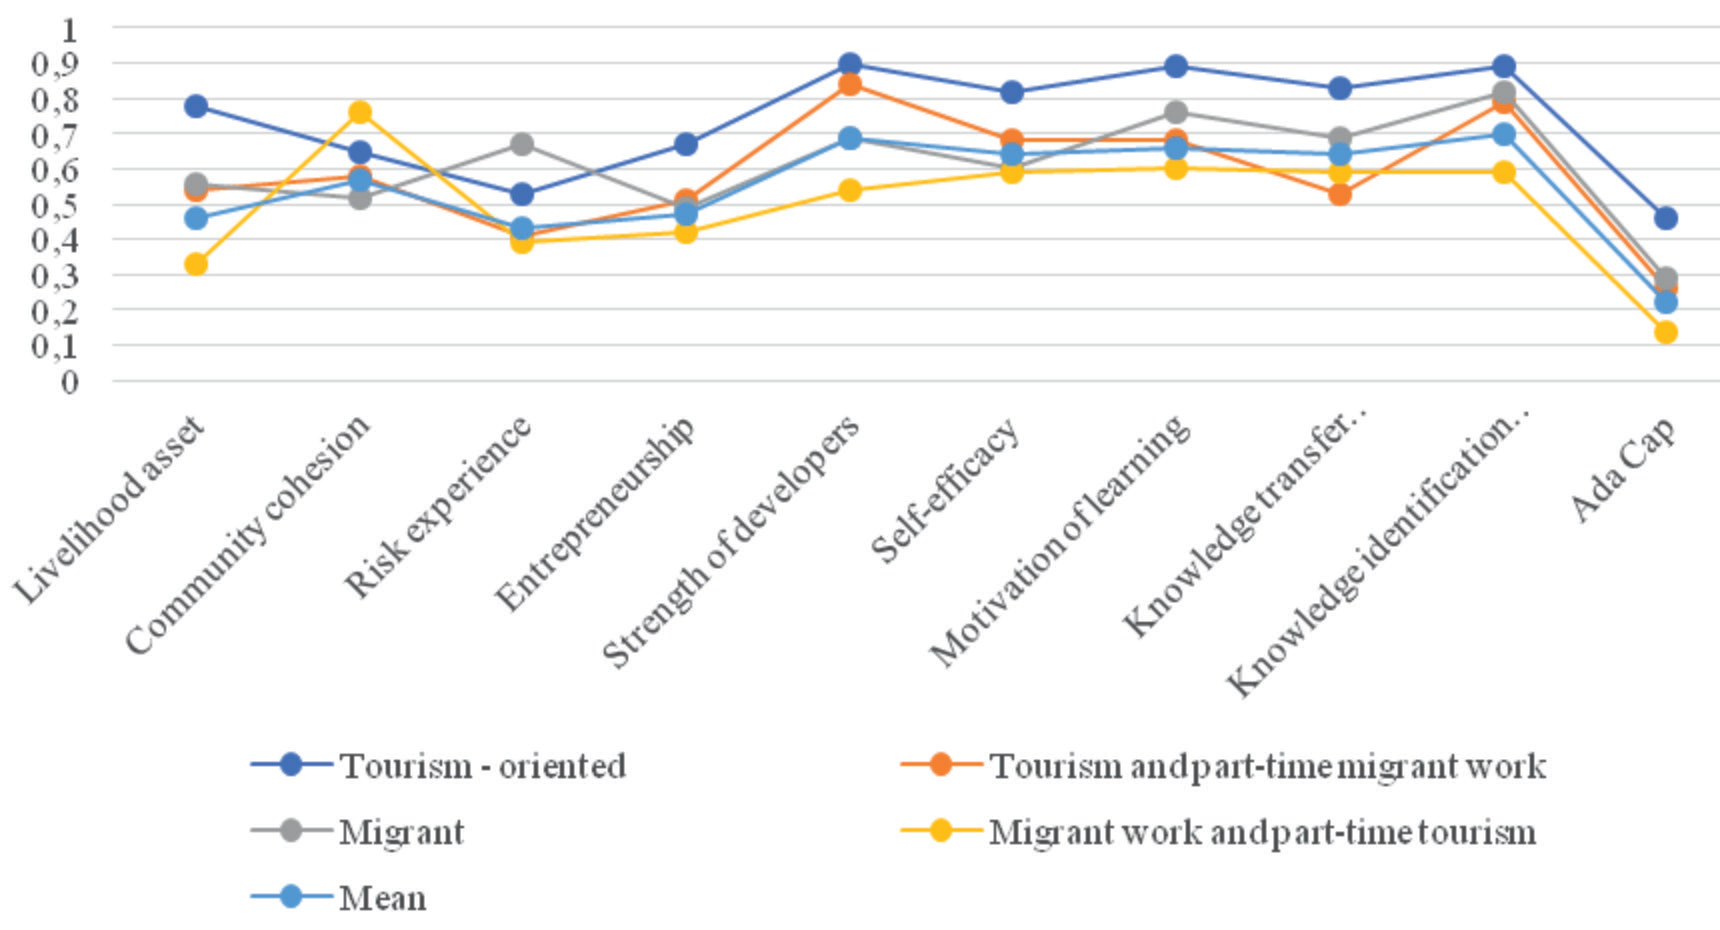
The mean value of the major indicator on adaptive capacity and its sub-elements (incl. livelihood assets, community cohesion, social experience, entrepreneurship, self-efficacy, opportunity recognition ability, development power, and learning capacity) of MPT smallholders are the least among four livelihood groups. This suggests that MPT smallholders are facing a significant development challenge, which has resulted in a low household income. This finding is consistent with previous research, which has shown that smallholders in poverty-stricken areas often fall into a low-level trap of “low adaptive capacity - inefficient livelihood activities portfolio - low accumulation and low level” due to limited livelihood opportunities and insufficient self-development ability [50]. Therefore, MPT smallholders are critical target group for rural tourism poverty alleviation initiatives and wider rural revitalization policies.
Livelihood Vulnerability
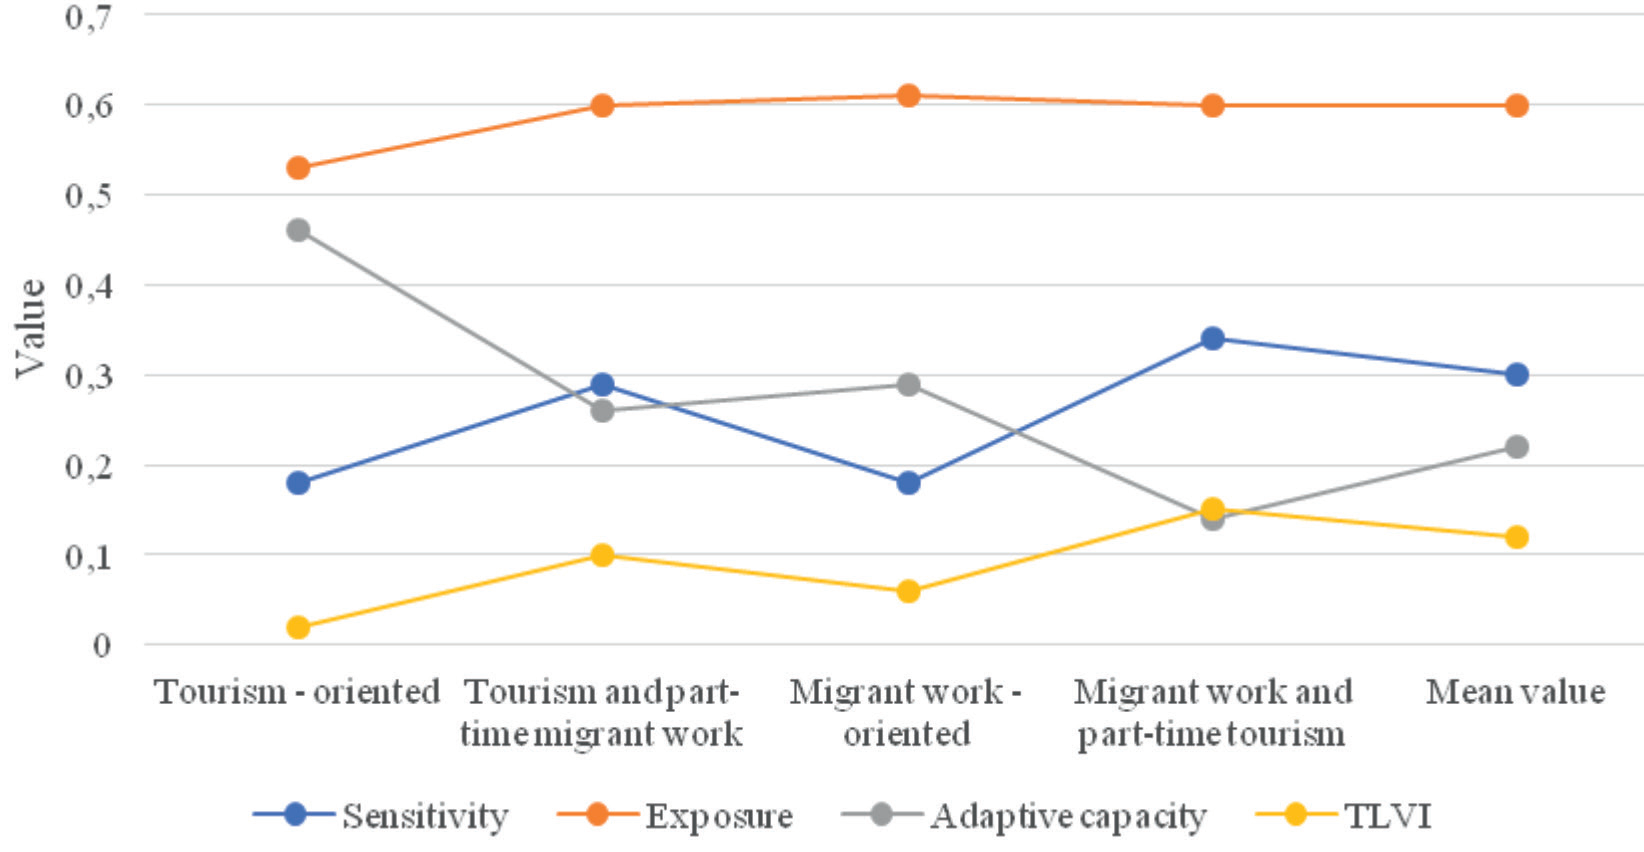
The mean value of TLVI ranged from 0.02-0.15 indicating generally low livelihood vulnerability (Fig. 8). MPT smallholders had the highest vulnerability (0.15) due to their highest Seasonality fluctuation, Institutional transformation, Dependency ratios, Income loan ratio, Community poverty index, and the lowest sub-elements of Adaptive capacity. By contrast, TO smallholders are the least vulnerable (0.02) due to the least exposure (0.53) and sensitivity (0.18), and the highest Adaptive capacity (0.46). TPM smallholders have the second highest vulnerability and the highest Market competition, Institutional transformation. MO smallholders have the second lowest vulnerability and the highest Seasonality fluctuation. The findings were in consistent with previous studies that livelihood strategies of intensification or extensification (TO and MO) generally have high livelihood resilience and low livelihood vulnerability in rural transformation [38]. However, this finding is against the conventional observation that livelihood diversity has been used as key indicator for livelihood sustainability [54].
The Gini coefficients of exposure, sensitivity, adaptive capacity, and vulnerability were 0.46, 0.55, 0.43, and 0.52, respectively. According to the Gini coefficient grading standard, the livelihood system of the sample smallholders had a significant gap in the above four aspects due to the heterogeneity of family initial endowment. This finding was consistent with previous studies showing that tourism may increase the livelihood gap among smallholders, especially in the early stage of the tourism destination lifecycle [55].
Conclusions
It is undisputed that a sustainable tourism livelihood is embedded in a specific tourism context within which it cope with vulnerability, and achieve livelihood outcomes. Hovever, there is a lack of awareness among researchers about the suitable methods for livelihood vulnerability assessment of household livelhood embeded in the rural tourism development mode of “Scenic spots + communities + smallholder”. This paper proposed the TLVI based on the SLF, IPCC’s vulnerability framework, and resilence concept. The key variables for the index were identified through a review of the literature and our own knowledge about the rural tourism development in Funiu Mountain poverty-stricken areas. Different from previous livelihood vulnerability index, the TLVI introduced the resilience elements to represent the Adaptive capacity in the IPCC vulnerability framework. The analysis results by the TLVI provided the practioners information both for the reactive response to short-term risks and proactive response for Long-term development. In addition, the basic indicators of the TLVI covers household element and factors of tourism destination community, which reflect the embeddedness of household livelihoods into the community environment. The TLVI has the potential to help organizations identify specific interventions that could help build livelihood resilience fo differentiated vulnerable household groups within a tourism destination community.
The empirical results showed that the livelihood strategies and the livelihood vulnerability of local smallholders had significant difference during tourism-guided rural transformation. The larger the proportion of tourism income in total household income, the higher they were exposed to market competition and tourism market trends. Otherwise, they were highly exposed to Seasonality fluctuation. Multi-level factors, including rural revitalization strategies, natural conditions, household livelihood capabilities, and community factors, jointly shaped the portfolio of activities, leading to the differences in livelihood vulnerability among smallholders. Different from existing discoveries, our finding reported that intensified livelihood strategies showed higher livelihood Adaptive capacity compare with diversified livelihoods, while the former showed lower TLVI and sensitivity than the latter in tourism-guided rural transformation. Furthermore, the analysis results revealed that livelihood diversity mainly related to coping and short-term dynamics, while specialized livelihoods showed more focusing more on long-term adaptation dynamics.
Based on the findings, the following recommendations are proposed. First, due to Market competition and Tourism market trends are the main source of risk exposure for four livelihood groups, stakeholders should prioritize rural tourism destination development planning and learning capacity of agritainment operators to promote innovation and diversified development. Second, Dependency ratios and Income loan ratio are the common challenges for four livelihood groups. Therefore, stakeholders should play a critical role in the construction of rural elderly care and education systems, and the improvement of financial markets to reduce household burden and financial costs. Third, Livelihood asset, Community cohesion, Risk experience, Entrepreneurship, and Knowledge transfer capability constitute the common constraints for TPM, MPT, and MO livelihood. The stakeholders should attach importance to asset-building, community empowerment, entrepreneurship education, and risk management training to enhance Adaptive capacity. Fourth, livelihood diversity is a common livelihood choice for tourism smallholders. Thus, promoting industrial integration and agglomeration development to broaden the portfolio of activities would yield greater value for effectively resisting the impact of risks.
The contributing factors of the livelihood vulnerability of tourism smallholders were highly community – household livelihood strategy specific. However, we were more concerned about the livelihood vulnerability of tourism smallholders from seven tourism destination community located in the upper reaches of Yihe River. Future research should be conducted concerning smallholders in tourism destinations community located in other geographical environments (Such as tourism community in City Outskirts, tourism community in plain farming district). Additionally, our single-time data have limitations in portraying the evolutionary process of vulnerability dimensions and their interrelationships. Therefore, future studies would adopt a longitudinal approach with multi-period data to investigate the dynamic of livelihood vulnerability.

