

Introduction
VOCs are organic compounds that evaporate easily at room temperature due to their high volatility. Moreover, VOCs readily participate in various chemical and physical interactions with environmental particles, contributing to air pollution [1]. They are precursors to pollutants such as ozone and fine particulate matter [2]. VOCs are also the main culprits of common photochemical pollution and odor pollution in daily life and pose direct risks to human health [3, 4], such as cognitive impairment in adults [5]. The sources of VOCs are divided into anthropogenic sources and natural sources. Natural sources primarily originate from plant emissions. Although VOCs emitted by plants can also affect human and environmental health, some of the compounds can act as therapeutic drugs, and natural sources account for a small part [6, 7]. In contrast, anthropogenic VOC emissions significantly exceed those from natural sources [8]. With ongoing industrial development, the petroleum refining industry has emerged as a major source of VOC emissions in China [9], and China currently leads the world in anthropogenic VOC emissions [10].
In order to continuously promote pollution prevention and control, the Beijing Municipal Government has formulated the “Blue Sky Defense 2025 Action Plan”, which outlines key tasks such as strengthening VOC management in major emission-intensive industries, with a special focus on high-emitting enterprises in industries such as petrochemicals, cement, and printing. To reduce VOC emissions, photocatalytic oxidation technology can be employed for removal, while metal-organic frameworks and biomass adsorption can serve as alternative treatment methods [11-13]. For enterprises, effectively reducing VOC emissions requires adopting advanced VOC control technologies or equipment. However, adopting such technologies or equipment often incurs additional costs. Due to limited resources, enterprises typically lack the initiative to implement them proactively. As the primary regulators [14], government agencies are responsible for encouraging key emitting enterprises to continuously explore emission reduction potential. At the same time, the public is becoming increasingly concerned about environmental issues. Empirical studies have shown a significant positive correlation between public environmental awareness and air pollution levels [15]. Therefore, when exploring the impact of government regulation on the application of green technology in enterprises, the impact of public participation on the promotion of green technology in enterprises should also be considered.
This paper develops an evolutionary game model between government regulators and enterprises to examine the impacts of factors such as additional emission costs, local government penalties, public supervision penalties, and central government penalties on corporate green emission strategies and government regulatory behaviors. It also conducts an in-depth analysis of the equilibrium outcomes. For unstable equilibrium points, this paper further considers the potential risks of delayed discovery of environmental pollution, introduces a central government penalty mechanism, optimizes the model structure, and consequently makes the equilibrium point converge to a stable state.
The remainder of this paper is structured as follows. We further introduce the relevant literature progress in the literature review. Then, the evolutionary game model and an improved evolutionary game model are presented in materials and methods. Moreover, the results of model analysis are presented in results and discussion. Finally, we conduct the main research findings in conclusions.
Literature Review
In recent years, the field of environmental economics has increasingly emphasized the dynamic cost–benefit trade-offs involved in green technology adoption. Li et al. developed an integrated model combining computable general equilibrium and technology choice to quantitatively assess the impact of policy incentives on the cement industry [16]. Their findings indicate that approximately 70% of emission reduction technologies are cost-effective, suggesting that green production is not merely a financial burden. Government incentives also play a critical role in facilitating firms’ adoption of green technologies. Using a multivariate regression model, Shi et al. empirically examined the effect of economic incentives on green innovation and enterprise growth, and found that government subsidies significantly promote green technology development, particularly among firms in central and western China [17]. Wen et al. analyzed the Chinese refrigerator market and evaluated the effectiveness of a dual-subsidy policy implemented at both the production and consumption levels [18]. Their results show that dual incentives are more effective than single subsidies in accelerating the system’s transition to a steady state. Ge et al. constructed a tripartite evolutionary game model involving the government, enterprises, and consumers, and demonstrated that publicity surrounding the “dual carbon” policy can guide consumers toward green consumption, which in turn incentivizes enterprises to adopt greener production strategies [19]. Guo et al. further highlighted that subsidy policies alone may not yield sustainable outcomes; instead, a combined approach incorporating punitive measures and information-sharing mechanisms is more effective in promoting the green transformation of coal enterprises [20].
Evolutionary game theory is a vital branch of game theory and plays a crucial role in mathematically addressing multi-party strategy interactions. It was first introduced into economics by Friedman in 1991 [21], thereby expanding its applicability to complex multi-agent systems.
The strategic interactions between government regulators and enterprises exhibit the characteristics of a dynamic game. To comprehensively identify the key factors influencing VOC emissions supervision, the evolutionary game theory method has emerged as an effective tool for analyzing the interactions between the government and enterprises [21-23]. A substantial body of research has applied the evolutionary game theory approach to examine the interactions between government regulation and corporate green production [24-26]. In response to air pollution caused by VOC emissions, Shen et al. aimed to identify a regulatory mechanism that would incentivize enterprises to prevent and control haze proactively [27]. Chang et al. developed a tripartite evolutionary game model and demonstrated that coordinated governance constitutes the optimal strategy for achieving effective air pollution control in China [28]. Similarly, Wang et al. proposed a tripartite evolutionary game model and found that a strategy combining strong incentives with severe penalties can effectively enhance public participation in supervision [29]. This offers a novel research perspective on enhancing the green development of enterprises. Chu et al. developed a policy simulation-based approach to environmental regulation and employed a non-cooperative tripartite evolutionary game model to achieve effective air pollution control [30].
In summary, current research on government regulation and corporate green technology application focuses on general incentive and punishment mechanisms, and has not yet deeply distinguished the functions and roles of governments at different levels in environmental governance. At the same time, in actual environmental governance, the phenomenon of delayed discovery of polluting behavior is common, but few scholars in existing research consider this risk.
In view of the above shortcomings, this paper, distinct from the commonly adopted tripartite evolutionary game framework involving the government, enterprises, and the public, introduces public supervision and a hierarchical punishment mechanism between local and central governments into an evolutionary game model. This refinement brings the model closer to real-world governance structures and enhances its analytical interpretability. Moreover, the model introduces the risk of regulatory lag caused by delayed detection of polluting behavior, thereby addressing the instability of equilibrium points in the basic model. These improvements not only extend the application scope of evolutionary game theory in environmental policy design but also enhance its practical relevance and policy value.
Materials and Methods
Evolutionary Game Model
Problem Description and Assumptions
The participants in this study include high VOC-emitting enterprises and local government regulatory agencies. In the evolutionary game between enterprises and government regulators, enterprises can choose between two strategies: {Green Emission, Traditional Emission}. Green Emission refers to the adoption of environmentally friendly technologies, optimization of production processes, and utilization of low-pollution raw materials to minimize VOC emissions and promote sustainability. Similarly, government regulators can choose between {Strong Supervision, Weak Supervision} as their regulatory strategies.
In the evolutionary game, assume that both enterprises and government regulators incur baseline operational costs denoted as R1 and R2 respectively, during their regular production and administrative activities. Enterprises adopting the Green Emission strategy need to invest in advanced equipment and technologies, incurring additional costs, denoted as C1. Similarly, the Strong Supervision strategy requires government regulators to allocate additional regulatory expenditures, denoted as C2. If an enterprise adopts a green emission strategy, the government provides policy support under the strong regulation strategy, denoted as Rg. Conversely, if an enterprise chooses the Traditional Emission strategy, the government regulator imposes penalties, with a penalty amount of F1 under Strong Supervision. In the {Weak Supervision, Traditional Emission} scenario, public supervision substitutes ineffective government oversight, with the public regulatory penalty denoted as F2. Government credibility also plays a crucial role, denoted as G1. Under the {Strong Supervision, Traditional Emission} strategy combination, government credibility is enhanced, whereas under {Weak Supervision, Traditional Emission}, if pollution is detected by the public, government credibility deteriorates. Moreover, under the {Weak Supervision, Traditional Emission} scenario, due to weaker regulatory efforts, pollution is detected by the public with a probability of P.
Before constructing the game model, we make the following assumptions:
Assumption 1: All game participants are assumed to be boundedly rational, with the ability to dynamically adjust their strategies during the game in order to maximize their individual payoffs.
Assumption 2: The probability of an enterprise adopting green emission is x, and consequently, the probability of adopting traditional emission is 1 – x. Similarly, we assume that the probability of government regulatory agencies adopting strong supervision is y, and the probability of adopting weak supervision is 1 – y. Clearly, x, y ∈ [0,1], and 1 – x, 1 – y ∈ [0,1].
Assumption 3: Under the {Weak Supervision, Traditional Emission} strategy, pollution may go undetected by both the government and the public. To account for this, we assume that the probability of pollution being detected under this strategy is P.
Based on the aforementioned parameter settings and model assumptions, an evolutionary game model was constructed between the government regulator and high-VOC emission enterprises. In this section, we analyze the payoffs for each player at different stages. The overall payoffs are summarized in Table 1.
Evolutionary Game Model for VOC Emission Supervision
Let Fx and Fy represent the replicator dynamic equations for enterprises and government regulatory agencies, respectively. By solving these, the replicator dynamics for both parties can be obtained as follows:
By setting Fx and Fy to 0, we obtain four pure strategy solutions and one mixed strategy solution: (0,0), (0,1). (1,0). (1,1), and (x*, y*), where:
Table 1.
The payoff matrix.
According to Friedman’s method [16], the Jacobian matrix of the differential equations can be used to determine whether a local equilibrium constitutes an Evolutionarily Stable Strategy (ESS). Let J denote the Jacobian matrix, which is given by:
Let φ1 = – C1 + PF2, φ2 = – C2 + + F1 + G1 + PG1. For – C1 + Rg + F1. We assume that F1>C1, hence – C1 + Rg + F1>0. After simplification and calculation, the determinant (detJ) and trace (trJ) of the Jacobian matrix at each local equilibrium point are presented in Table 2.
For the parameters φ1 and φ2 defined above, four possible cases arise. The ESS stability conditions proposed in this paper are as follows:
(1) When φ1>0 and φ2>0, that is – C1 + PF2>0 and – C2 + + F1 + G1 + PG1>0, the ESS point is (1,0).
(2) When φ1>0 and φ2<0, that is – C1 + PF2>0 and – C2 + + F1 + G1 + PG1<0, the ESS point is (1,0).
(3) When φ1<0 and φ2>0, that is – C1 + PF2<0 and – C2 + + F1 + G1 + PG1>0, the evolving system does not possess an ESS point, and it remains in a fluctuating state without reaching stability.
(4) When φ1<0 and φ2<0, that is – C1 + PF2<0 and – C2 + + F1 + G1 + PG1<0, the ESS point of the system is (0,0).
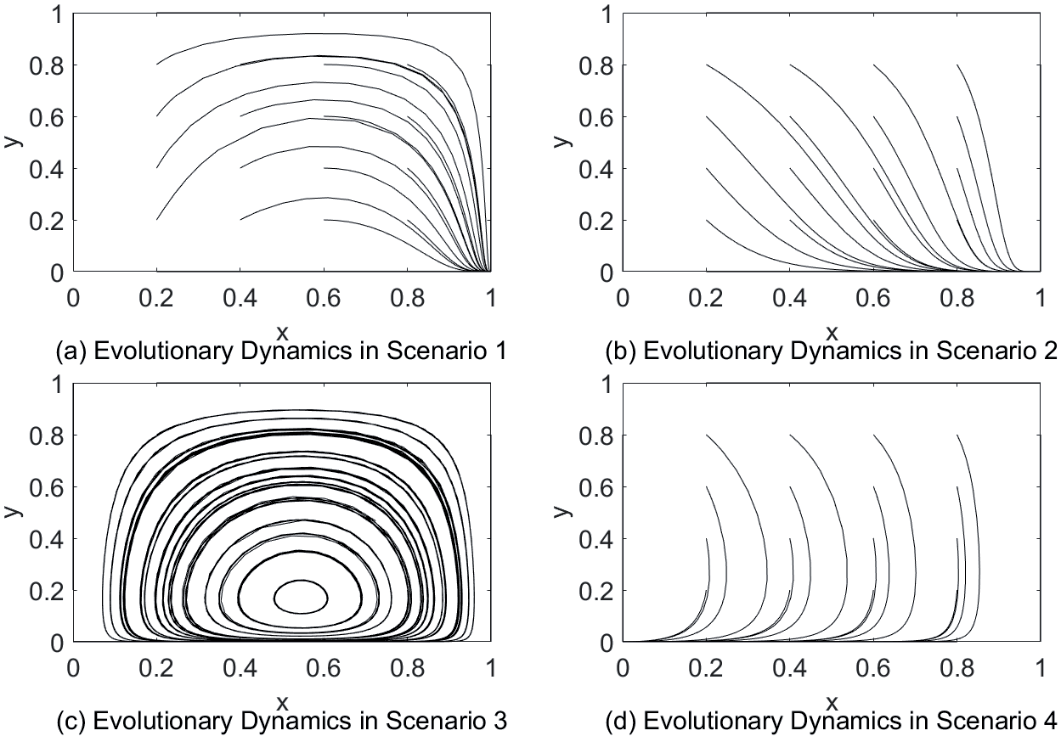
To validate the evolutionarily stable states under the four scenarios, we conducted simulation analyses using baseline values for selected parameters: C1 = 1, F2 = 3 and Rg = 1. To generate four distinct cases, we assigned two different values to the remaining parameters: C2 = {1,3}, F1 = {1.1,2}, G1 = {1,2} and P = {0.2,0.5}.
We conducted simulations using MATLAB for data analysis. The simulation results yielded four distinct scenarios, as depicted in Fig. 1. The validation process confirmed the consistency of these results with the theoretical analysis. In scenarios 1 and 2, the ESS equilibrium emerged at (1,0), indicating that enterprises adopted green emission strategies while governments implemented weak supervision. Scenario 3 exhibited no ESS equilibrium. In scenario 4, the ESS equilibrium stabilized at (0,0).
Table 2.
Values of detJ and trJ at each equilibrium point.
Optimization Analysis of the Game Model Considering Hidden Environmental Hazards and the Central Government’s Punishment Mechanism
By analyzing the simulation outcomes, we identified the presence of unstable evolutionary states. To enhance the model and ensure that all scenarios converge to a stable equilibrium, we propose the following improvement strategies:
(1) Building on the framework proposed by Ma et al. [25], we account for the hidden environmental hazards resulting from undetected pollution, which ultimately impacts the long-term development of enterprises and governments. To incorporate this factor into the model, we introduce a penalty term F3 in the payoffs of enterprises and governments. Furthermore, we consider the additional cost C3 associated with pollution mitigation, which primarily applies to the {Strong Supervision, Traditional Emission} and {Weak Supervision, Green Emission} strategies.
(2) Under the {Weak Supervision, Traditional Emission} strategy, pollution issues become more severe due to insufficient government oversight. To mitigate this problem, we introduce a central government entity and establish a penalty mechanism to incentivize local governments to adopt stricter regulatory measures. Specifically, we define a penalty parameter F4, where F4 denotes the intensity of the central government’s sanctions imposed on local governments for inadequate supervision. We assume F4>F1 and F4>F2, ensuring that the penalty is sufficiently stringent to deter weak supervision and promote effective environmental governance.
By incorporating these parameters in the above two cases at the same time, adding the new parameters to the original profit matrix, we refine the original payoff matrix, yielding the refined payoff matrix presented in Table 3.
Let J' denote the refined payoff matrix, which is expressed as follows:
Table 3.
The refined payoff matrix.
Table 5.
Signs of detJ and trJ at each equilibrium point.
| Equilibrium point | detJ | trJ | Results |
|---|---|---|---|
| P1(0,0) | ± | ± | Saddle point |
| P2(0,1) | + | ± | Saddle point |
| P3(1,0) | ± | ± | Saddle point |
| P4(1,1) | + | – | ESS |
We define φ1 = – C1 + PF2 and φ2 = – C2 + F1 + G1 + PG1 + F4. For the expression – C1 + Rg + F1 + (1 – P) F3 + (1 – P) C3, we assume F1>C1, such that – C1 + Rg + F1>0, implying that – C1 + Rg + F1 + (1 – P) F3 + (1 – P) C3>0. Regarding the equilibrium point (x*, y*), where detJ>0, this does not satisfy the stability conditions and will not be considered further. The detJ and trJ values of the Jacobian matrix are shown in Table 4.
For P4(1,1), considering – C1 + (1 – P) F3 + (1 – P) C3, when P satisfies 0≤P≤(F3 + C3 – C2)/(F3 + C3), we obtain – C2 + (1 – P) F3 + (1 – P) C3>0. Under this condition, P4(1,1) satisfies detJ>0 and trJ>0, indicating that it is a stable equilibrium, as shown in Table 5.
As indicated in Table 5, P4(1,1) constitutes a stable equilibrium of the evolutionary system, and there is no instability in the system. An increase in P enhances the probability of detecting pollution. Once the detection probability surpasses a critical threshold, the government is incentivized to adopt stricter regulatory measures, compelling enterprises to transition to a green emission strategy. To validate this hypothesis, we performed a simulation study, and the results are presented in Fig. 2. The results indicate that the stable solution is (1,1), where enterprises adopt the green emission strategy and government regulators select the strong supervision strategy, which aligns with the optimal strategic configuration.
Results and Discussion
Simulation Analysis
To analyze the dynamic evolution of the model, we change parameter values to represent different scenarios. We use the data analysis software MATLAB to simulate the parameters of the model. The additional costs of green emissions (C1) varies from 2 to 3.5, the additional costs of strict supervision (C2) varies from 2 to 4.1, the additional treatment cost (C3) varies from 1 to 2.5, the government punishment (F1) varies from 1 to 20, the public supervision (F2) varies from 2 to 4.5, and the central government punishment (F4) varies from 1 to 7. The values of the remaining parameters remain unchanged and are set as follows: Rg = 1, G1 = 1, P = 0.5, R1 = 1, R2 = 1, F3 = 1.2.
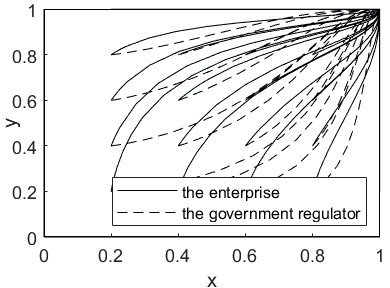
Table 4.
The values of detJ and trJ.
The Impact of Initial Probability
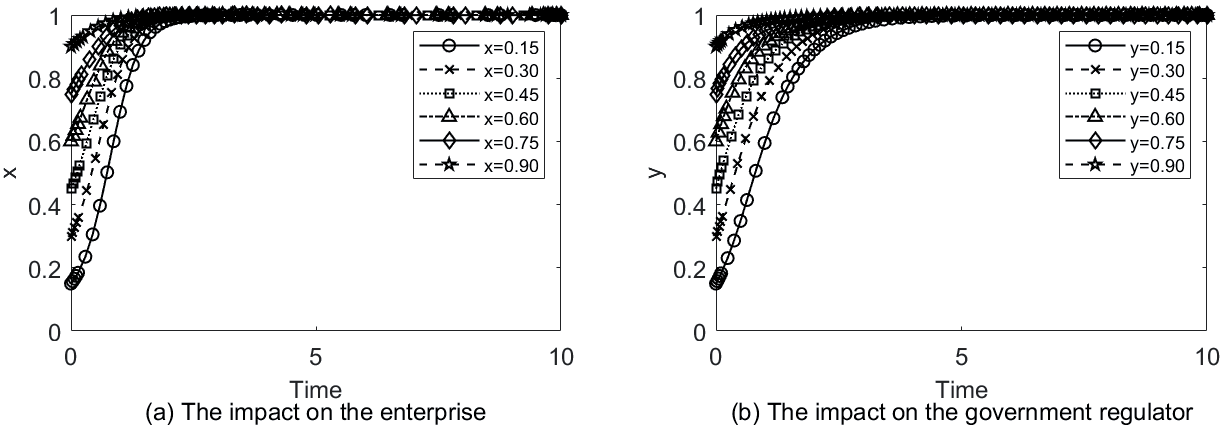
First, we analyzed the impact of initial probabilities on the strategy selection of the players. In this analysis, we take the stable equilibrium point (1,1) as the reference point. As shown in Fig. 3, changing the initial probabilities has no significant impact on the evolutionary outcome of the system. The system consistently converges to the equilibrium point (1,1), meaning that the enterprise adopts the green emission strategy and the government regulatory agency enforces strong supervision. This suggests that variations in initial probabilities do not alter the long-term evolutionary equilibrium. Based on this finding, we set the initial probabilities to x = 0.5 and y = 0.5 in the subsequent parameter sensitivity analysis.
Analysis of the Effects of Cost Parameters
C1 and C2
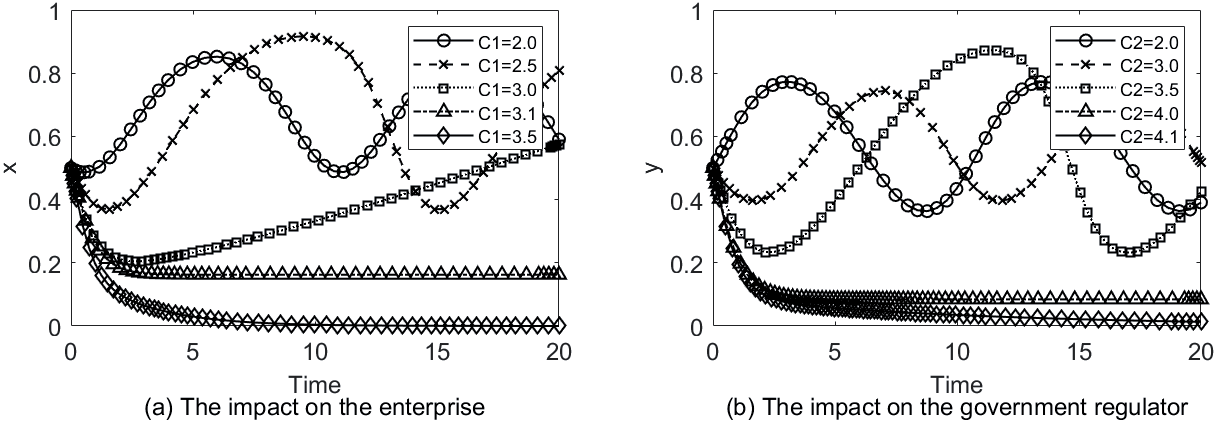
This section analyzes the impact of the additional costs of green emissions for enterprises C1 and the additional costs of strict supervision for the government C2 on the strategy selection of the game participants. Using the examples of {C1 = 2.0, C1 = 2.5, C1 = 3.0, C1 = 3.1, C1 = 3.5} and {C2 = 2.0, C2 = 3.0, C2 = 3.5, C2 = 4.0, C2 = 4.1}, the evolutionary results for the enterprise and government regulatory agency are presented, as shown in Fig. 4.
As shown in Fig. 4a), the additional cost of green emissions significantly influences enterprises’ decision-making. When the cost is low, the enterprise’s evolution exhibits a fluctuating trend, and as the cost increases, the cycle period gradually lengthens. When C1 = 3.1, the choice of the green emission strategy reaches a critical point, where the probability of choosing green emissions stabilizes around x = 0.2. As the cost continues to increase, the stable evolutionary state of the system changes. Once the threshold is exceeded, the system tends toward x = 0, indicating that the enterprise shifts to the traditional emission strategy. This indicates that under higher green emission cost pressure, enterprises are more likely to abandon green emissions in favor of the lower-cost traditional approach.
As shown in Fig. 4b), the additional cost of strict supervision for the government also significantly affects the choice of regulatory strategy. When the cost of strict supervision is low, the evolution of the government exhibits a fluctuating cycle without stabilization. When C2 = 4.0, the probability of the government choosing strict supervision stabilizes around y = 0.1. As the cost increases, the government’s evolutionary system tends toward stability. When C2 exceeds a certain threshold, the government shifts to a weaker regulatory strategy, and the evolutionary state tends toward y = 0. This suggests that in the early stages of higher strict supervision costs, the government’s willingness to enforce stringent policies declines, leading to a gradual shift toward more relaxed regulatory measures [31]. However, under a relaxed regulatory environment, enterprises may engage in opportunistic behavior, such as reverting to traditional emission strategies, worsening environmental issues. By distributing the cost of government regulation through public or social supervision, local governments can be incentivized to gradually reinstate stringent regulatory measures, curb traditional emissions, and mitigate cyclical fluctuations [32].
C3 Following Environmental Damage
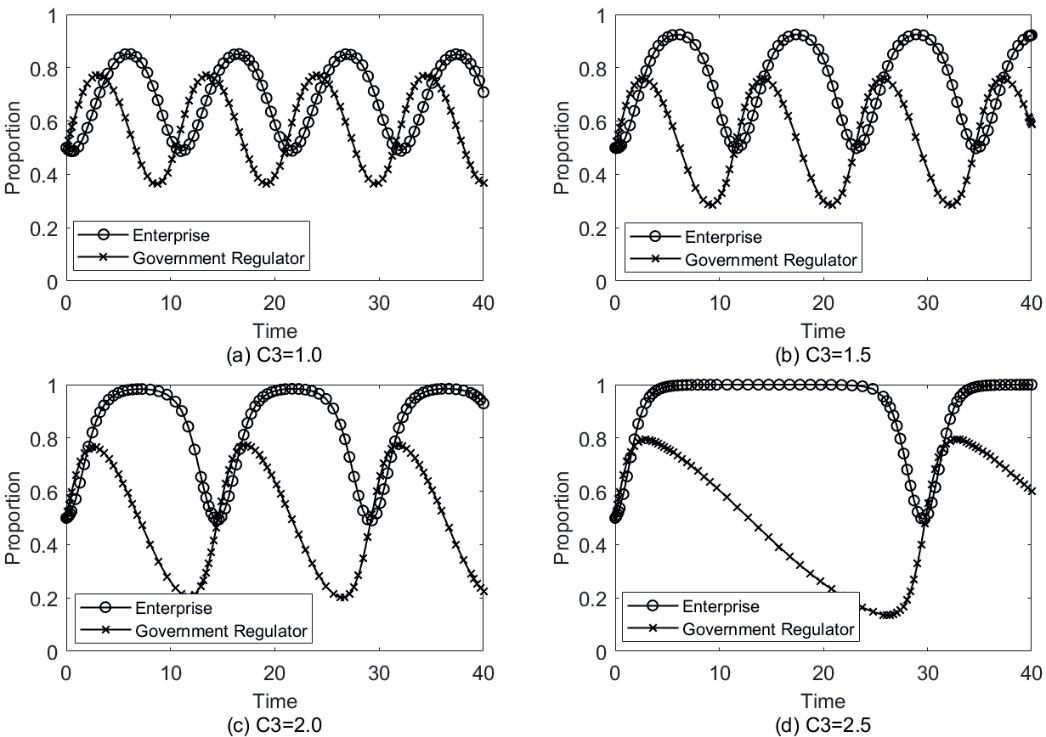
If environmental damage is not discovered in time, it will often cause long-term cumulative damage. Especially in the long-term development of enterprises and governments, if pollution cannot be effectively controlled, the consequences will be more serious. This section analyzes the impact of the additional treatment cost C3 after environmental damage on the strategy selection of the game participants and explores the changes in the behavior of enterprises and government regulatory agencies under different governance costs. Using the examples of {C3 = 1.0, C3 = 1.5, C3 = 2.0, C3 = 2.5}, the evolutionary results for the enterprise and government regulatory agency are presented, as shown in Fig. 5.
In cases of lower governance costs, the behavior of both the enterprise and government regulatory agencies exhibits strong volatility and remains in an uncertain cyclical state. At this point, the enterprise oscillates between green emission and traditional emission strategies, and the government’s regulatory strategy is also unclear. As the additional environmental treatment cost C3 increases, the enterprise, influenced by economic pressures, gradually tends to choose the green emission strategy to reduce future treatment costs and potential environmental risks. At this stage, the government does not need to implement strict regulatory measures; instead, it moves toward a more relaxed regulatory strategy, reducing intervention with the enterprise and lowering governance costs. In this case, the strategies of the enterprise and government gradually balance out. However, as the government’s regulatory intentions weaken, the enterprise may engage in opportunistic behavior, such as reverting to traditional emission strategies. When the government strengthens its supervision, the enterprise returns to the green emission strategy. Therefore, for the sustainable development of the environment, the government’s regulatory intensity should be consistent to prevent regulatory gaps from leading to opportunistic behavior of enterprises and ensure the long-term stability of environmental governance goals.
The Impact of Government Punishment F1
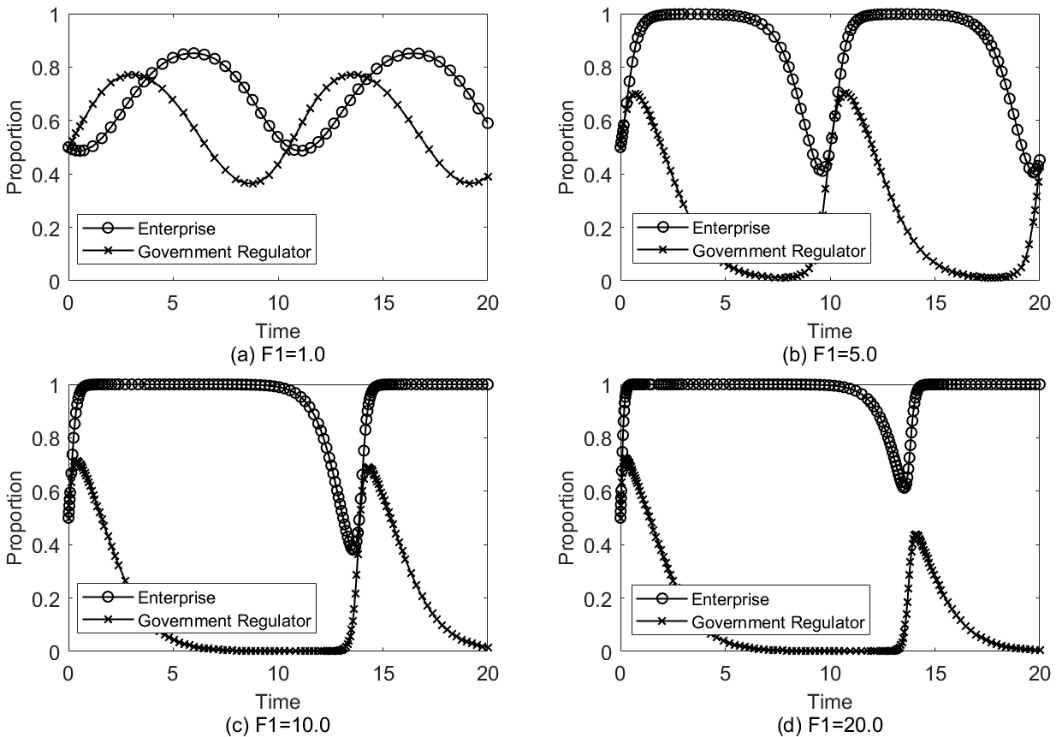
To ensure green emissions and prevent environmental pollution, local governments need to enforce strict supervision over enterprise production activities. This section analyzes the impact of the government’s penalty parameter F1 for traditional emissions on the strategy selection of the game participants. Using the examples of {F1 = 1.0, F1 = 5.0, F1 = 10.0, F1 = 20.0}, the evolutionary results for the enterprise and government regulatory agency are presented, as shown in Fig. 6.
As shown in Fig. 6a), when the government’s penalty for traditional emissions is low, enterprises do not fully adopt green emission strategies. The probability of choosing green emissions fluctuates between 0.5 and 0.8, without stabilizing at a specific value, and is in a fluctuating state. This indicates that the low penalty caused companies to respond slowly to regulatory pressure and still tended to maintain traditional emission strategies. As shown in Fig. 6a), as the government increases the penalty for traditional emissions, the enterprise’s green emission behavior begins to fluctuate within a smaller range, narrowing between 0.6 and 1.0. This suggests that a stronger penalty can effectively guide enterprises to gradually adopt green emission strategies and reduce their dependence on traditional emissions, leading to more stable behavior and green emission strategies gradually dominating the game.
The analysis in this section demonstrates that the government’s strategy can significantly influence the strategic choices of enterprises. Enterprises, in turn, make decisions that align with their own interests, contingent on the government’s policy actions. When government sanctions are relatively low, the likelihood of enterprises opting for green emission behaviors remains at a low range and fluctuates. However, as the severity of government punishment increases, the probability of enterprises adopting green emission behaviors rises and stabilizes within a higher range. Therefore, local governments should impose stringent regulatory constraints on enterprises to incentivize the adoption of green emission practices.
The Impact of Public Supervision F2
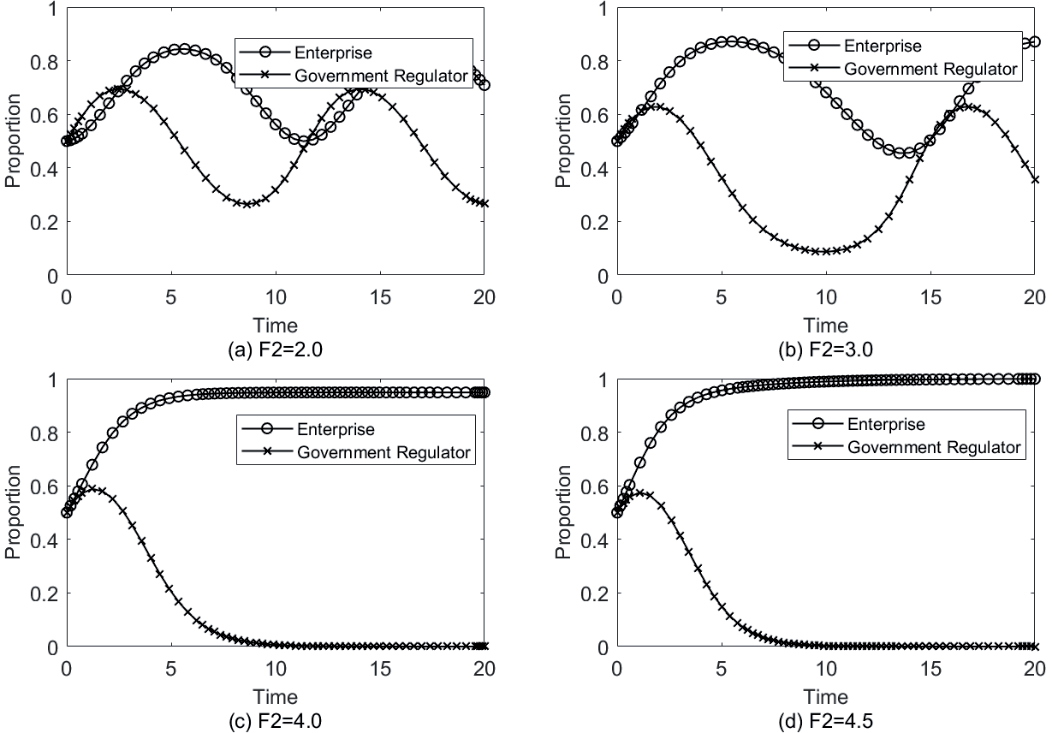
This section analyzes the impact of the public regulatory parameter F2 on the strategy selection of the game participants. Using the examples of {F2 = 2.0, F2 = 3.0, F2 = 4.0, F2 = 4.5}, the evolutionary results for the enterprise and government regulatory agency are presented, as shown in Fig. 7.
In this scenario, the public plays a supervisory role, assisting local governments in alleviating regulatory burdens [33]. The government can devote more energy and resources to supervising other industries or fields. Initially, when the regulatory penalties are light, enterprises’ green emission behaviors fail to stabilize, exhibiting significant volatility. However, as public supervision increases, especially with growing public concern and action on environmental issues, enterprises gradually begin to adopt green emission strategies. As supervision intensifies, enterprises’ green emission behavior begins to stabilize. Due to limited government resources, especially financial and material constraints, the government typically reallocates resources from enterprises that have achieved green emission targets and focuses more on companies that have not yet met the standards. Consequently, the government relaxes its regulatory measures on enterprises that have adopted green emissions, forming a lenient regulatory strategy for these green emission enterprises.
The analysis in this section demonstrates that while public supervision and government strategy adjustments help promote the stability of enterprises’ green emission behaviors, caution is needed regarding the risks posed by regulatory gaps and avoiding a regulatory vacuum. To ensure that companies maintain the sustainability of green emission behaviors, both the government and the public must maintain long-term monitoring and guidance to prevent enterprises from regressing due to lax supervision and ensure the continuous achievement of environmental protection goals.
The Impact of Central Government Punishment F4
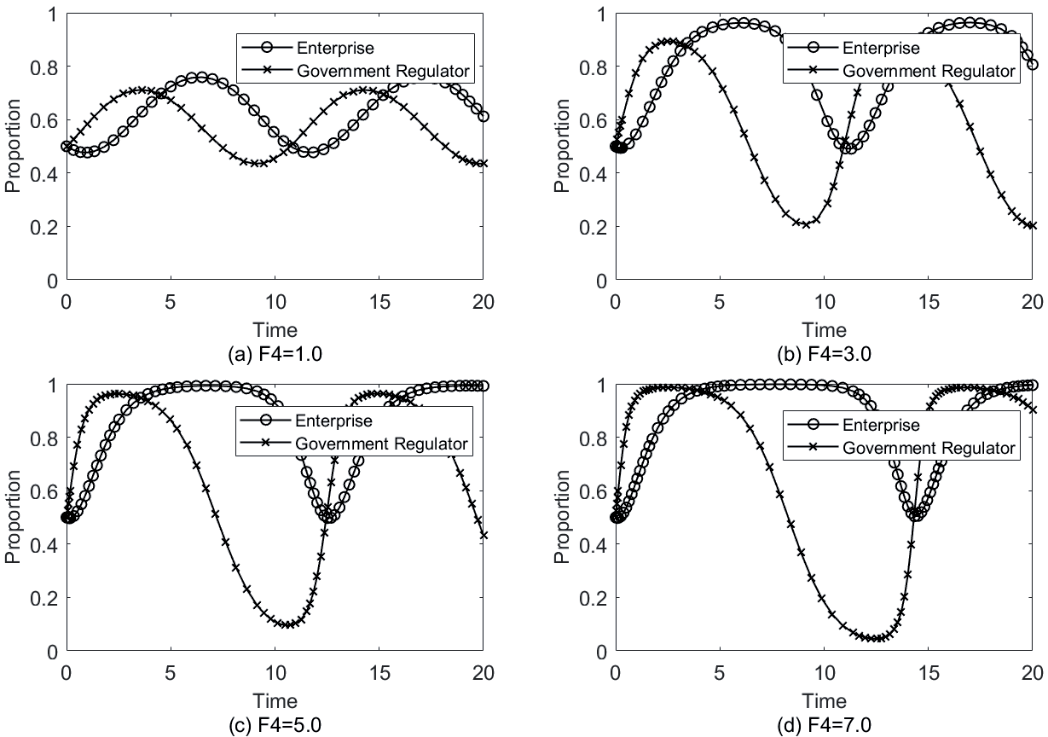
This section analyzes the impact of the central government’s punishment parameter F4 on the strategy selection of the evolutionary game participants when the (traditional emissions, weak supervision) scenario occurs. Using the examples {F4 = 1.0, F4 = 3.0, F4 = 5.0, F4 = 7.0}, the evolutionary results for enterprises and government regulatory agencies are presented, as shown in Fig. 8.
Under the guidance of central government supervision, local governments generally adopt more stringent supervision strategies. Against the backdrop of local governments’ implementation of strict supervision measures, the green emission behavior of enterprises has shown a certain convergence trend, but it has not yet been completely stabilized. To promote sustainable environmental development and encourage more enterprises to adopt green emission strategies, the central government further enhances its regulatory guidance to local governments, thereby facilitating the widespread adoption of green emissions and stabilizing enterprise behavior.
As the central government gradually increases the intensity of punishment on local governments, neither corporate nor local government strategies have achieved long-term stability. While enterprises maintain their green emission behavior for a longer period, the effect is still not ideal. This suggests that relying solely on the central government’s punishment measures to encourage local governments to strengthen supervision may yield some short-term results, but it is insufficient to ensure the long-term stability of enterprises’ green emission behavior. Therefore, when designing a punishment mechanism, it is necessary to carefully weigh the intensity of punishment to avoid unnecessary side effects caused by excessive punishment, and ensure a win-win situation among the government, enterprises, and the environment.
Conclusions
Green development is not only China’s development direction, but also a global development trend. Implementing green emissions is one of the key ways to control VOC emissions and promote green production among enterprises, aligning with China’s long-term strategic goals of carbon reduction and carbon neutrality. However, since green emissions often involve additional production costs, enterprises may be reluctant to adopt relevant measures voluntarily. In this context, this paper constructs an evolutionary game model between corporate green emissions and government supervision, and uses numerical simulations to analyze the impact of factors such as costs, local government penalties, public supervision penalties, and central government penalties on the strategy selection of both parties. Based on the above analysis, the following conclusions can be drawn:
(1) Local governments should formulate differentiated regulatory policies for VOC-emitting enterprises, implement financial incentives for those adopting green technologies, and impose moderate penalties on those that do not, thereby guiding the evolutionary trajectory of corporate strategies. With current national policies, for example, high-emission process equipment can be classified under elimination or restriction catalogs to facilitate industrial structure optimization. Simultaneously, VOC emissions can be incorporated into the scope of environmental protection tax collection to raise the environmental costs for high-emission enterprises.
(2) For the central government, when designing environmental protection assessment and incentive mechanisms for local governments, it is essential to take into account local economic development levels and regulatory capacities. This helps avoid overly punitive measures that may induce short-sighted regulatory behavior at the local level, thereby undermining the long-term stability and effectiveness of green policy implementation.
(3) For enterprises, the additional cost of adopting green emission strategies is a key factor influencing their strategic evolution. Enterprises should strengthen the research, development, and application of green technologies to reduce the cost of transformation. This not only enables them to actively respond to the “dual carbon” policy but also helps enhance their reputation, improve competitiveness, and achieve a coordinated balance between economic growth and environmental benefits.
(4) Public participation in environmental governance helps alleviate environmental pollution. In addition, empirical studies have shown that differences in public environmental awareness significantly influence the modes and effectiveness of such participation [34]. In order to raise public environmental awareness and enhance the role of public supervision, the government can establish and improve a mechanism for public participation in environmental governance, set up convenient ecological environment complaint platforms and complaint hotlines and other feedback channels, lower the threshold for public participation, and encourage the public to participate more actively in environmental governance.
Research Limitations
Although this paper explores the strategic evolution path of VOC emission enterprises under the government supervision situation by constructing an evolutionary game model between the government and enterprises, and provides a theoretical reference for the governance of high VOC emission enterprises, the model still has the following limitations:
(1) Simplification of theoretical assumptions. The theoretical basis of evolutionary game theory is based on simplified assumptions, such as assuming that the game subject is completely rational and the information is completely symmetrical. However, in real life, information asymmetry and irrational behavior are prevalent. Therefore, it is necessary to make timely adjustments based on limited rationality and imperfect information symmetry.
(2) Dynamics and uncertainty of the external environment. The evolutionary game model presented in this paper is designed for a relatively stable environment; however, reality is often characterized by uncertainty, including market fluctuations and government policy adjustments. These changes may alter the evolutionary dynamics and affect the stability of equilibrium strategies in the model. Therefore, in the future, andom evolutionary games can be combined to introduce external environmental uncertainty factors for research.
(3) Limitations of parameter setting and data basis. Game evolutionary models use simulated data for verification in parameter sensitivity analysis. Although it can reveal the impact of parameter changes on system evolution to a certain extent, it does not combine real enterprise behavior data. In future research, actual regulatory cases or real data from enterprises can be combined for empirical testing and simulation to enhance the application value of the model.

