

Introduction
Urban parks are the main outdoor activity places for urban residents, and as key green infrastructure, their environment significantly impacts people’s physical and mental health [1]. In constructing the park, the functions of scientific research, education, and recreation should be reasonably developed to fully reflect its comprehensive benefits in ecological experience, science popularization, and other aspects. In particular, realizing ecological recreation value has become an important way for urban parks to exert comprehensive benefits, which has been widely concerned by the academic community [2].
Domestic research on ecological recreation adaptability assessment is limited, and most stay in the theoretical framework. For example, Zhang Qian et al. took Baishanzu National Park as the research object, established an ecological recreation adaptability evaluation system with an analytic hierarchy process, and comprehensively evaluated various indicators through the GIS spatial analysis function [3]. Wang Fuyuan et al. further coordinated the construction and layout of ecological recreation space from the perspective of regional integrity, optimized the distribution of urban ecological recreation space, and promoted the optimization of urban territorial spatial structure and the improvement of residents’ well-being. Based on residents’ demand for ecological recreation services [4]. Zhu Miaoyuan et al. selected four indicators of ecological recreation space service radius coverage, residents’ transportation time, travel distance, and recreation satisfaction, and explored the rationality of ecological recreation space layout through GIS network analysis and questionnaire survey [5]. Zhang Chi et al. evaluated the carrying capacity of ecological recreation resources in Nanling National Park. Guided by public demand, global consensus, and management experience [6]. Research on ecological recreation function assessment, resource identification, and recreation suitability evaluation has been carried out in foreign countries. Graefe et al. took the lead in conducting exploratory research on environmental impact, resource assessment, and recreation carrying capacity of ecological recreation in national parks. Gramann et al. put forward the evaluation index of ecological recreation function and value of national parks. Woz’Niak et al. studied the relationship between ecological recreation functions and natural elements in national parks and revealed that natural resource endowment is a decisive factor in developing ecological recreation [7]. These research results provide an important reference for studying ecological recreation adaptability.
In general, domestic and foreign scholars have rich research results on ecological recreation and have initially formed a research system, but relatively few studies on its recreation suitability from the supply side. Therefore, this study takes Yangshan Park as an example, uses the GST method and AHP method to construct an evaluation model, qualitatively and quantitatively screens and calculates the ecological recreation adaptability, and aims to provide theoretical guidance for the planning, construction, and evaluation of ecological recreation activities.
Materials and Methods
Study Area
Yangshan Park is located in Xinyang Yangshan New District, west of New 24th Street, north of Nanjing Avenue, and south of New 11th Avenue, with a length of 465m from east to west and about 868m from north to south. The project covers a total area of 27.88hm2. Its geographical coordinates are 114°01’~114°06’ east and 31°46’~31°52’ north. Yangshan Park adheres to the design concept of “landscape in the city, park in the landscape”, makes full use of the existing landscape context, and divides the function into a number of areas, including a climbing observation area, an ecological protection area, a mountain culture area, a mountain fun area, an entertainment experience area, a leisure and fitness area, and a waterfront sightseeing area. It is committed to creating a comprehensive urban park that integrates fitness, leisure, and cultural activities [8].
Research Methods
Citespace Preliminary Screening Index
This study combined landscape and recreation space composition, landscape ecology, recreation opportunity spectrum, analytic hierarchy process, and other relevant theories to comprehensively screen evaluation indicators. First, through CNKI, search keywords such as “urban park, park green space, landscape ecology, recreation suitability, and evaluation research”, and screened literature consistent with the research direction of this paper. A total of 106 literature samples were selected. Then, using the keyword commonality analysis in Citespace software, we can see the high-frequency keywords appearing in a certain field during the statistical period and the correlation between them, revealing the current research hotspots. Finally, keywords with high frequency are preliminarily selected, such as “recreation landscape, recreation space, recreation behavior, cultural landscape, recreation facilities, recreation experience, ecological environment carrying capacity, landscape resources, geographical location, population density, external traffic, tourist source conditions, recreation facilities, location characteristics, species richness, vegetation cover, water density index” etc., as the evaluation of ecological recreation adaptability is made with reference to the price index.
GST Fine Sieve Index
Gray statistical method GST is a statistical method that uses the whitening function to perform function operations and statistics and can effectively deal with the model framework under the background of a large number of unknown values. The albinism function is the process of analyzing the albinism statistics of a given value, and the albinism value describes the degree of certainty about the object of study. When the grayscale is 1, the whiteness of the set is 0, that is, there is no knowledge about the object of study, and when the grayscale is 0, the whiteness is 1, that is, the object of study has been fully known [9].
The rationality of evaluation indicators directly impacts the scientificity, reliability, and accuracy of evaluation results. Based on previous studies, this paper comprehensively considers the individual’s adaptive feelings in ecological recreation. Further, it determines the index factors of the evaluation system in combination with expert consultation, expert scoring, field questionnaire surveys, and other methods, and finally forms four criterion layers of ecological recreation resources, ecological environment carrying capacity, ecological recreation behavior, and social and economic conditions. However, this primary index set is still imperfect and immature, which needs to be further analyzed and processed with a gray whitening function to improve its scientific accuracy.
Calculate The Gray Whitening Function
According to the GST method, we can construct gray whitening segmented functions based on the levels of “high,” “medium,” and “low” to obtain the preliminary indicator set for the evaluation of rehabilitation landscapes in forest parks. In this case, we assume that fk(ab) represents the whitening function value of the bth indicator with importance level a, where k represents the number of grayness levels (e.g., 1, 2, 3). We also assume h(ab) as the assigned value for the importance level a of the bth indicator. The specific segmented formula is: (a = 1, 2, 3…, 7; b = 1, 2, 3…, 33).
When k = 1, the formula for calculating the whitening function corresponding to “high importance level” is as follows.
When k = 2, the formula for calculating the whitening function corresponding to “high importance level” is as follows.
When k = 3, the formula for calculating the whitening function corresponding to “high importance level” is as follows.
Calculation Of Gray Decision Vector Screening Results
By applying the above formulas, we can determine the importance level and numerical values of gray whitening segmented functions for the corresponding indicators, thereby constructing the preliminary indicator set for evaluating rehabilitation landscapes in forest parks. This will serve as a basis for subsequent evaluation analysis and further research.
According to the above formula, fk(ab) is determined through corresponding segmented quantization. The overall gray decision coefficient is formed by multiplying it with L(ab), the number of experts corresponding to the bth index with a value of a, and then weighted accumulation. The formula is as follows:
ηk(b) = ∑ L(ab) × fk(ab)
The gray decision vector of each preliminary evaluation index consists of three categories: “high,” “medium,” and “low,” represented as {η1(b), η2(b), η3(b)}. The final screening result of the evaluation index can be obtained by comparing the weighted assignment results of each index’s gray decision vector. The gray statistical questionnaire was designed using the Likert scale method, and after data sorting and input, it was classified and statistically processed according to the gray correlation method [10].
At the same time, relevant experts and scholars in the field of ecological recreation adaptability were consulted for their suggestions on the importance of evaluation indicators. Finally, through screening, a total of 15 indicators of high importance in gray statistics were found, and the results are shown in Table 1.
As shown in the table above, the indicators selected by the survey show relatively large performance differences among indicators, which are widely distributed among different types of indicators and lack significant characteristics [11].
Among them, the importance of evaluating rainfall, air quality, and the proportion of the tertiary industry is low, which reflects that these indicators are significantly removed from the actual needs of ecological recreation adaptability evaluation. Their importance is relatively weak in the investigation system, and they cannot be applied to the usual rehabilitation landscape evaluation system. In particular, the proportion index of tertiary industry shows that the evaluation is significantly too low, indicating that most design links do not examine the specific performance of this feature in the ecological landscape for ecological recreation adaptability evaluation. On the other hand, most indicators of ecological recreation behavior were rated as medium and high, especially the index of recreation space layout, which was generally rated above medium, indicating that park visitors had higher requirements for ecological recreation space layout [12]. Therefore, the analysis results of gray statistics were in line with the overall trend of the survey results.
Table 1.
Gray statistical screening results of ecological recreation adaptability evaluation index in Yangshan Park.
However, based on the index layer corresponding to the same criterion layer, the respondents’ assessment results also showed similar differentiation characteristics, such as rainfall and air quality in the ecological environment carrying capacity, showing a lower degree of importance [13]. Considering that the overall scale of the index system involved in this paper is relatively large, indicators with medium-importance evaluation results are abandoned, and only some indicators with high-importance evaluation results are selected for the next stage [14].
Determine The Evaluation Index Factors
Based on the evaluation index screening results of the Citespace and GST methods, an evaluation system for Yangshan Park’s ecological recreation adaptability was formed, including 15 indexes. Specifically, the distribution density of recreational resources, the proportion of cultural and recreational resources, the proportion of natural and recreational resources, elevation, slope, species richness, vegetation coverage, water density index, types of recreational activities, density of recreational facilities, recreational space layout, and transportation accessibility. The rationality and geographical location of barrier-free access are further applied to the processing of AHP6.
The AHP Method Builds An Evaluation System
AHP is a multi-level decomposition method that can be used for qualitative and quantitative analysis of decision-related indicators, as well as weight calculation and ranking. The quantitative relationship between the elements of the same level and the previous level is determined by comparison to avoid the arbitrariness of subjective evaluation. This method is relatively simple and mathematically feasible, which can help build a more reasonable evaluation system for the ecological recreation adaptability of Yangshan Park. In this paper, the Citespace method and GST method are first used to select indicators. Then the AHP method is used to calculate the weight and ranking of indicators to construct a more reasonable evaluation system of ecological recreation adaptability.
The Analytic Hierarchy Process (AHP) was applied to evaluate ecological recreation adaptability in parks. From the four criteria of ecological environment carrying capacity, ecological recreation behavior, ecological recreation resources, and social and economic conditions, C1 recreation resource distribution density, C2 human recreation resource proportion, C3 natural recreation resource proportion, C4 elevation, C5 slope, C6 species richness, C7 vegetation coverage, C8 water density index, C9 recreation activity type, and C10 recreation facilities were respectively analyzed. There are 15 scheme layers, including application density, C11 recreation space layout, C12 traffic accessibility, C13 distance from nearby settlements, C14 accessibility rationality, and C15 geographical location, which finally constitute the evaluation index system of ecological recreation adaptability of Yangshan Park (see Table 2).
Data Acquisition
The study was conducted on a random sample of visitors to Yangshan Park from May to August 2024.
Table 2.
Evaluation index system of ecological recreation adaptability in Yangshan Park.
Sample Size: We provided specifics on questionnaire distribution and recovery. 400 questionnaires were distributed, 346 were returned, and 320 were valid, yielding an effective recovery rate of 92.49%. Statistical methods were used to verify the consistency and reliability of the sample data.
Demographic Characteristics: Information on participants’ gender (48.6% male, 51.4% female), age distribution (32.2% aged 18–30, 45.6% aged 31–50, 22.2% aged 51+), and occupation (25.3% students, 52.1% employed, 22.6% retirees) was included. Chi-square tests indicated that differences in indicator scores across different groups were statistically significant.
Data Analysis
In this study, 8 experts in landscape architecture and related fields were invited to evaluate the importance of each index factor. The importance of each indicator factor is assigned and scored according to the 1-9 scale method. The scale and meaning are shown in Table 3.
Calculate the index weights of each level and multiply the index weights of each level to get the overall weight. In operation, 1, 3, 5, 7, and 9 are usually selected as weights of relative importance, so the score of this evaluation can be followed in the following table:
Normalize the judgment matrix to obtain the weight coefficients of the evaluation indicators. Then, a consistency test will be performed by calculating the Consistency Ratio (CR) and Consistency Index (CI) values using formulas (1) and (2). To pass the consistency test, it is necessary to satisfy CR<0.10. If the calculated CR value is greater than 0.10, the judgment matrix needs to be adjusted until the CR value is less than 0.10.
The test coefficient for the consistency test is:
Where λmax represents the maximum eigenvalue, n represents the dimension of the judgment matrix, and RI represents the Random Index of Consistency.
Average Random Index (RI):
The RI is dependent on the order or size of the judgment matrix. Thus, a dimension table for RI can be obtained as shown in Table 4 below:
Questionnaires used by all experts to evaluate the importance of each indicator factor were subjected to a reliability and validity test using SPSS 22.0 software. The results showed that the overall Consistency Ratio (CR) value of the questionnaire was 0.85, which was less than 0.10. This indicates that the questionnaire has good internal consistency and reliability and is suitable for subsequent analysis.
Results and Analysis
Evaluation Index Weight Ranking
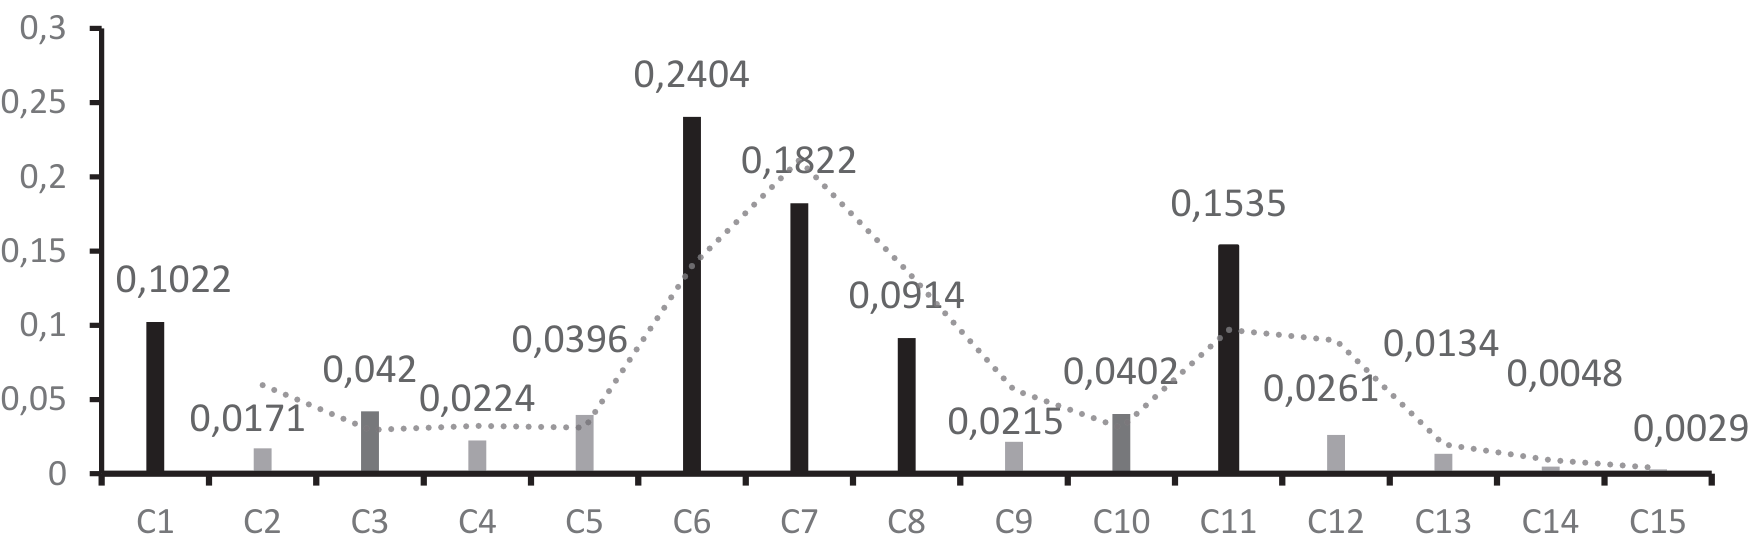
According to the analytic hierarchy process (AHP), the weights of each criterion layer, index layer, and total weight of the ecological recreation adaptability evaluation index of Yangshan Park were obtained (see Table 5). It can be seen that the highest weight value of ecological environment carrying capacity in the criterion layer is 0.5762, the highest value of ecological recreation behavior is 0.2152, the second value of ecological recreation resources is 0.1614, and the lowest value of socio-economic conditions is 0.0472. In the index layer, the top three factors were species richness, vegetation coverage, and recreational space layout, with total weights of 0.2404, 0.1822, and 0.1535, respectively. The results show that among the main factors in evaluating the ecological recreation adaptability of Yangshan Urban Park, ecological environment carrying capacity and ecological recreation behavior are more important than ecological recreation resources and social and economic conditions. The ranking of the scheme layer is basically the same as that of the standard layer, which further reflects the scientific evaluation weight of the ecological recreation adaptability of Yangshan Urban Park.
Table 3.
1-9 scale method.
Table 5.
Comprehensive evaluation of the weights of indicators at all levels.
According to the standards, the 15 evaluation factors are categorized into three groups: important factors (≥0.08), moderately important factors (0.04-0.08), and general factors (≤0.04) (as shown in Fig. 1).
As can be seen from Fig. 1, there are five important factors in the evaluation factors, with the weights from the highest to the lowest being species richness, vegetation coverage, recreational space layout, recreational resource distribution density, and water density index, with a total weight of 0.7697. There are two secondary important factors, the weights of which are in descending order: the proportion of natural recreational resources and the density of recreational facilities, with a total weight of 0.0822. There are 8 general factors, the weights of which are in descending order: slope, traffic accessibility, elevation, type of recreational activities, proportion of cultural and recreational resources, distance from nearby residential areas, accessibility rationality, and geographical location, with a total weight of 0.1481.
Fig. 1.
Classification of the importance degree of evaluation factors. C1 Distribution density of recreational resources; C2 The proportion of humanistic recreation resources is; C3 The proportion of natural recreational resources is; C4 Elevation; C5 Slope; C6 Species richness; C7 Vegetation coverage; C8 Drainage density index; C9 Recreational activity type; C10 Density of recreational facilities; C11 Recreation space layout; C12 Transportation accessibility; C13 Location; C14 Distance from nearby settlements; C15 Accessibility rationality
Survey Questionnaire Results
The Likert scale method was used to score each index element, with a total of 5 grades ranging from 1 to 5 points, namely “very poor 1 point, poor 2 points, average 3 points, good 4 points, and excellent 5 points”. Formula (3) is used to calculate the scores of each index factor and the comprehensive scores. The specific evaluation results are shown in Table 6.
Then, the difference method is used to divide the S-value of landscape effect into four grades: “excellent”, “good”, “medium” and “poor”. For details, see Table 7.
Among them, S represents the comprehensive score of ecological recreation adaptability of Yangshan Park, Wi represents the weight value of the i item evaluation factor, and Ci represents the average value of the i item evaluation factor.
The above data show that the comprehensive score of the ecological recreation adaptability evaluation of Yangshan Park is 3.7998 points, which is rated as good. Among them, the single index of ecological recreation resources was good, with a comprehensive score of 3.5431 points; the ecological environment carrying capacity was rated excellent, with a comprehensive score of 4.2364 points, which was the highest among the four dimensions. The ecological recreation behavior was rated as good, with a comprehensive score of 3.8563; socio-economic conditions were rated as good, with a combined score of 3.2695. This shows that Yangshan Park provides a good environment for the public in terms of ecological recreation adaptability and can meet the needs of the public for ecological leisure play.
Table 6.
Yangshan Park ecological recreation adaptability comprehensive score statistics.
Ecological Recreation Resources
The ecological and recreational resources were rated as good, with a comprehensive score of 3.5431. From the index level, tourists were more concerned about the distribution density of recreational resources in the park. Visitors’ attention to the distribution density of resources can reflect the rationality of the park’s spatial planning. Suppose the distribution of recreational resources is more uniform and reasonable. In that case, it is easier for visitors to find suitable places for their activities, which can provide more activities to meet the needs of different visitors. Conversely, if some areas of activity are too concentrated, it may lead to waste of resources or over-exploitation. At the same time, it shows that they want a good experience and service when they play. If certain areas of the park are overcrowded, it may reduce the satisfaction and experience of visitors. Tourists pay more attention to natural recreation resources than human recreation resources. This shows that in the current society, everyone desires the natural environment and needs to get close to nature and relax their body and mind. At the same time, it also reflects the high substitution of human resources, such as historical sites, museums, art exhibitions, etc. In a homogenized modern society, people may not be as interested in a single human resource as they are in a natural landscape.
Ecological Environment Carrying Capacity
The ecological environment’s carrying capacity was rated excellent, with a comprehensive score of 4.2364 points. From the index level, tourists paid more attention to the park’s species richness, vegetation coverage, and water density index. Visitors’ attention to species richness, vegetation coverage, and water density index reflects their emphasis on ecological health, leisure value, mental health, and nature education. With the improvement of people’s awareness of ecological environment protection, they have higher requirements for ecological experience in parks. Species richness, vegetation coverage, and water density index can directly reflect the ecological health status of a park, and visitors hope to experience a richer ecological landscape through these indicators. Compared to elevation and slope, species richness and vegetation cover can provide a richer visual and tactile experience, increasing the leisure value of visitors. It can be seen that the ecological carrying capacity should be fully considered in the planning and design of the park, the functional areas in the park should be rationally distributed, the vegetation, water system, and biodiversity should be restored, and the self-regulation ability of the ecosystem should be improved. Protect the original ecological structure.
Ecological Recreation Behavior
The ecological recreation behavior was rated as good, with a comprehensive score of 308563. From the index level, tourists paid more attention to the layout of recreational space in the park and paid less attention to the types of recreational activities and the density of recreational facilities. A reasonable layout of the recreation space can provide a comfortable and smooth tour experience. The layout of the recreation space directly affects the overall experience and space feeling of tourists and determines the flow and stay of tourists in the park. A good layout can naturally guide tourists to explore different park areas and increase their interaction and participation. Suppose the layout of the recreation space is not reasonable. In that case, even if there are rich and diverse types of recreation activities and dense facilities, tourists may feel inconvenienced or lost because they cannot find the appropriate path or area. At the same time, the layout of the recreation space is also related to tourists’s social needs and privacy. Some visitors want to socialize in a public space, while others want to be alone in a quiet, private environment. It can be seen that visitors pay more attention to the layout of the recreation space, which reflects their comprehensive needs for overall experience, convenience, psychological feelings (social and private), ecological environment integration, safety and comfort, diversity of needs, and visual esthetics. Layout not only determines how visitors use the space but also directly affects their satisfaction and happiness. Therefore, recreation space layout should be considered a key factor in park design and management, not just a simple accumulation of recreational activity types and facility density.
Socio-Economic Conditions
Social and economic conditions were rated good, and the comprehensive score was 3.2695. From the index level, tourists were more concerned about transportation accessibility and the distance from nearby residential areas. The pace of modern life is fast, and the time cost is high. Tourists tend to choose destinations with convenient transportation and easy access to save time and energy. The convenient public transport network will significantly enhance the travel experience of tourists. Visitors tend to have a stronger sense of belonging and closeness to parks that are closer to each other, and parks that are closer to each other are more likely to become centers of community activities, promoting interaction and social cohesion between neighbors. Therefore, parks with close proximity and convenient access can better meet their daily needs. This reflects a combination of convenience, meeting daily needs, emergency response, social services, financial burden, environmental impact, and psychological and emotional dimensions. Therefore, the design and layout of parks should fully consider these factors to enhance the visitor’s overall experience and efficiency.
Conclusions and Discussion
Ecological recreation adaptability evaluation can provide a scientific basis for urban parks to develop ecological recreation projects reasonably and give full play to their comprehensive benefits under the premise of maintaining the integrity and authenticity of the ecosystem. Based on Citespace software and the GST method, this paper constructs an evaluation system scientifically and objectively using the analytic hierarchy process (AHP). The 15 indicators under the four criteria layers are independent of each other, have clear objectives, are easy to measure and reasonably distribute weight, and realize multi-factor qualitative and quantitative research. After conducting a single-factor hierarchical evaluation and a comprehensive evaluation of the ecological recreation adaptability of Yangshan Urban Park, the following proposals are put forward based on the above research: (1) In the subsequent planning and development of ecological recreation projects in Yangshan Park, the differences in functional zoning and development intensity should be emphasized according to the evaluation grades of ecological recreation adaptability and the classification of recreation spaces to balance the relationship between ecological environment protection and recreational resource utilization. (2) The subjectivity of some indicators in the Analytic Hierarchy Process (AHP) may introduce biases, and exploring how to minimize these potential biases or mitigate their impacts in subsequent research is a critical consideration. To address the above issues, the following optimization strategies are proposed:
(1) In the layout design of recreational spaces: The internal environment should be considered according to local conditions, combined with natural topographical features, to enrich the spatial forms of the park and ensure the rationality and safety of recreational activities. Functional areas should be divided using a “core-periphery” structural framework based on the park’s area and surrounding environment to balance safety and ecological integrity. While ensuring overall openness, private spaces should be integrated to achieve a balance between public accessibility and privacy; in addition to common seating and fitness equipment, recreational facilities should be diversified according to the park’s unique features and the needs of the surrounding population. A reasonable recreational space layout provides a comfortable and smooth touring experience. This directly influences tourists’ overall perception and spatial experience, determines their movement patterns and stay duration within the park, and enhances their sense of interaction and participation. Design should cater to the needs of different age groups to improve spatial usage efficiency.
(2) In terms of traffic accessibility: Improve the road network structure, rationally distribute traffic routes, and ensure road connectivity and accessibility. Optimize public transportation systems by increasing bus routes to the park and setting up bus stops in close proximity to facilitate access via public transit; provide ample parking spaces around the park to meet the needs of visitors arriving by car. Plan safe, comfortable, and convenient walking and cycling routes to encourage non-motorized access to the park. Install clear and visible wayfinding signage inside and around the park to guide visitors to their destinations and enhance their travel experience.
(3) In vegetation design: Prioritize planting native tree species and rationally configure plant communities to enhance species richness, creating spatially diverse landscapes with rich seasonal variations and ornamental safety to enhance leisure enjoyment. Achieve layered, colorful, and seasonally distinct plant landscapes through the balanced arrangement of trees, shrubs, herbs, and flowers. Along water systems, create “ecological sponge zones” with sunken green spaces and rain gardens to integrate landscape esthetics with hydrological regulation functions.
(4) In the distribution of recreational resources: Ensure the integrity of the facility system, maintain a unified park style, and conduct regular maintenance and updates to guarantee safe usage. Plan different types of recreational resources rationally to ensure even distribution and avoid over-concentration or uneven allocation; leverage the park’s natural landscapes, history, and cultural heritage to create unique recreational projects that attract more visitors. Design diversified recreational activities tailored to different groups’ needs to provide a wide range of recreational experiences.
(5) Sources of Bias and Control Measures: The reliance of AHP on expert subjective judgments may lead to biases in indicator weights, such as differences in experts’ perceptions of the importance of criteria layers like “ecological recreation behavior” and “socio-economic conditions.” To address this, we will reduce bias through the following methods in the subsequent research process: (1) Multidisciplinary Expert Involvement: We invited experts from fields including landscape architecture, ecology, and sociology (not just a single discipline) to score the indicators, ensuring diversified evaluation perspectives. (2) Strict Consistency Testing: We calculated the CR value for each judgment matrix (requiring CR<0.1). If the criterion was not met, experts were asked to readjust their scores. All final matrices had CR values≤0.08, statistically ensuring the consistency of judgment logic. (3) Calibration with Objective Data: During the indicator screening phase, we cross-validated AHP’s subjective weights with quantitative results from the Gray System Theory (GST) method, minimizing the impact of subjectivity from a single approach.

