

Introduction
Organic waste is a category of organic materials that humans abandon throughout their daily living and producing activities [1]. The productivity of all sorts of organic waste in China is rising at a 5 to 10% yearly pace due to the ongoing improvement of people’s living conditions and the steady expansion of industry and agriculture [2]. The amount of organic waste created in China is enormous; in 2009, the amount of straw generated from main crops in China was over 700×106t [3]. In 2015, China created around 3.16×10⁷t of animal and poultry waste [4]. Furthermore, China generates around 9.00×10⁸ tons of kitchen waste and 6.00×10⁸ tons of sludge per year [5]. According to statistics, the globe presently generates roughly 2.01×10⁷t of residential garbage per year, and if current trends continue, the world will create about 3.40×10⁷t of domestic waste yearly by 2050 [6]. It has been demonstrated that agricultural surface pollution in the Yangtze River Basin accounts for more than 50% of nitrogen and phosphorus imports into Yangtze River waters [7]. Failure to properly dispose of the massive quantity of waste produced can substantially harm the environment, producing eutrophication of water bodies and acidification of soil [8], both of which have a negative impact on human health [9]. Among them, the complete management of straw and animal waste has emerged as a critical challenge for China’s agricultural growth. The output of livestock and poultry manure has grown year by year, particularly with the large-scale expansion of the farming sector, and the land carrying capacity index in local regions has exceeded the environmental danger threshold. Organic waste resource treatment can not only successfully avoid environmental pollution, but also achieve the recycling of nutritional resources in organic waste, which is critical to China’s agricultural green growth.
Because of expanding human food consumption, the usage of chemical fertilizers has increased significantly in recent years, and the phenomena of declining returns has been seen in some areas with high levels of fertilizer application [10, 11]. Excessive use of chemical fertilizers might add damage to environment [12]. Although China has decreased the use of chemical fertilizer by 10% as of 2019, the fertilizer situation remains stressful at this time due to the rapid growth in the price of chemical fertilizer and the expense of growing food in China [13]. It is critical to continue to promote the coordinated application of organic and inorganic fertilizers in order to reduce chemical fertilizer application by using organic fertilizers to nourish low and medium yielding fields and to improve fertilizer utilization efficiency [14]. Global research has proven that the resourceful use and harmless treatment of organic waste is an effective way to reduce the application of chemical fertilizers, improve the utilization rate of chemical fertilizers, control agricultural environmental pollution, and thus achieve agricultural sustainability [15]. Clarifying the potential of China’s organic waste resource utilization promotes further rational allocation and use of various types of organic waste resources in China, while also providing theoretical data for the formulation of scientific and standardized development planning and a sound development system [15, 16]. In order to promote the use of organic waste resources, the amount of typical organic waste (straw, livestock and poultry manure, rural human urine, sludge, and domestic organic waste) generated in China in 2021 was estimated, and its potential for use and land carrying capacity were assessed.
Research Methods and Data Sources
Research Target
The production of straw, livestock and poultry manure, rural human faces and urine, sludge and domestic organic waste in China in 2021 was studied. Based on the China Statistical Yearbook, rice, wheat, maize, beans, potatoes, cotton, peanuts, oilseed rape, and sugarcane were selected as straw crops, and cattle (beef, dairy, and service cattle), horses, donkeys, mules, sheep, pigs, poultry, and rabbits were selected as livestock species. Crop straw coefficient, livestock and poultry rearing period, single head daily excretion, domestic sludge yield coefficient, average annual human excretion, rural per capita daily rubbish production, rural domestic waste organic ratio, urban per capita daily rubbish production, urban domestic waste organic ratio, organic waste nutrient content, water content, and other parameters were determined with reference to domestic and international research results [17-19], as shown in Table 1, Table 2 and Table 3.
Methods for Estimating Total Organic Waste Generation and Crop Nutrient Requirements
Straw from Major Crops in China
Straw yield is computed by dividing economic crop yield by straw yield (grain-to-straw ratio). Straw nutrient resources are determined using the following method based on the link between straw yield and straw nutrient content:
Where Ft-dry is the straw yield (t) (dry basis); Ci is the economic yield of the ith crop (t); Ri is the straw coefficient of the ith crop (Table 1); FtN, FtP2O5, and FtK2O denote the N, P, and K nutrient resources of the crop straws (t), respectively; and Ni, Pi, and Ki denote the ith straw N, P, and K nutrient contents (dry basis), respectively; 2.29 is the coefficient for the conversion of monomorphic phosphorus to P2O5, and 1.2 is the coefficient for the conversion of monomorphic potassium to K2O.
Table 1.
Straw coefficients and nutrient contents of major crops in China (dry basis).
Table 2.
Feeding cycle, daily excretion of manure, nutrient content (fresh basis) and moisture content of various types of livestock and poultry [17, 18, 20].
Table 3.
Nutrient content (fresh basis) and water content of rural human farces, sludge and domestic organic waste [18].
| Waste species | N/% | P/% | K/% | Water content/% |
|---|---|---|---|---|
| Human manure | 0.64 | 0.11 | 0.19 | 90.3 |
| Sludge | 0.13 | 0.05 | 0.02 | 96.2 |
| Domestic organic waste | 0.28 | 0.12 | 1.07 | 28.9 |
Livestock and Poultry Manure
Livestock and poultry manure production and its nutrient resources are calculated with reference to the following formulae:
Where, Fm-fresh is the livestock and poultry manure production (t) (fresh basis); Fm-dry is the livestock and poultry manure production (t) (dry basis); Cdi is the number of livestock and poultry of the ith species (10×103); di is the daily excretion of livestock and poultry manure in the ith (kg/d); hi is the feeding cycle of the ith species (d); Wi is the water content of the ith species of livestock and poultry manure; MmN, MmP2O5, MmK2O denote the amount of N, P and K nutrient resources of livestock and poultry manure (t), respectively; Ni, Pi and Ki denote the N, P and K nutrient content of the ith species of livestock and poultry manure (fresh basis), respectively; 2.29 is the coefficient of conversion of monomorphic phosphorus to P2O5, and 1.2 is the coefficient of conversion of monomorphic potassium to K2O.
Rural Human Farces and Urine
The volume of rural human farces and urine and its nutrient resources are calculated with reference to the following formula:
Where Fu-fresh is the volume of human farces and urine (t) (fresh basis); Fu-dry is the volume of human farces and urine (t) (dry basis); Y is the size of the rural population aged 14 years or older; A is the annual faucal and urinary excretion of adults (in terms of age greater than 14 years); W is the water content of rural human farces and urine; and FuN, FuP2O5, and FuK2O denote the volume of the N, P, and K nutrient resources of human farces and urine (t), respectively; 2.29 is the coefficient of conversion of monomorphic phosphorus to P2O5, and 1.2 is the coefficient of conversion of monomorphic potassium to K2O.
Sludge
Sludge production is in a proportional relationship with sewage treatment volume. Therefore, the empirical coefficient method was used in this study to estimate the domestic sludge production. The formula for calculating sludge production and its nutrient resources is as follows:
Where Fs-fresh is the amount of urban sludge generated (t, fresh basis); Fs-dry is the amount of urban sludge generated (t, dry basis); Z is the amount of urban domestic wastewater discharged; J is the urban domestic wastewater treatment rate (%); 0.02% is the coefficient of the domestic sludge generation rate; W is the sludge moisture content; FsN, FsP2O5, and FsK2O denote the sludge’s N, P, and K nutrient resources (t); 2.29 is the coefficient of conversion of monomorphic phosphorus to P2O5, and 1.2 is the coefficient of conversion of monomorphic potassium to K2O.
Domestic Organic Waste
Domestic organic waste mainly consists of food waste, fruit peels, grasses and other easily decayed organic matter in the physical composition of domestic waste. In this study, the amount of organic waste and its nutrient content were estimated by the following equations:
Where Fg-fresh is the amount of domestic organic waste generated (t, fresh basis); Fg-dry is the amount of domestic organic waste generated (t, dry basis); PT is the number of people in the city (person), 1.03 is the urban per capita waste production rate [kg/(person·d)], and 0.41% is the organic content in urban waste (%); Pv is the number of people in the countryside (person), 0.3 is the rural per capita Pv is the rural population (people), 0.3 is the rural per capita waste production rate [kg/(person·d)], and 0.15% is the organic matter content in rural waste (%); W is the water content of domestic waste; FgN, FgP2O5, and FgK2O denote the amount of N, P, and K nutrient resources in domestic waste (t), respectively; 2.29 is the coefficient of conversion of monomorphic phosphorus to P2O5, and 1.2 is the coefficient of conversion of monomorphic potassium to K2O.
Table 4.
Total organic waste resources (dry basis) and their total nutrient resources (×104 t4).
Crop Nutrient Requirements
The formula is as follows:
Where FgN, FgP2O5, and FgK2O are the crop N, P, K nutrient requirements (10×103 t); Q is the sown area of the crop (×103 hm2); NiN, NiP2O5, NiK2O are the recommended application of N, P, K for the crop (kg/hm2).
Estimation of Land Carrying Capacity for Livestock and Poultry Manure
Land carrying capacity is the maximum amount of livestock and poultry raised in the region based on crop nutrient demand, which is calculated from the maximum amount of livestock and poultry raised per unit area of different crops in relation to the planted area. Livestock and poultry manure nutrient requirements for different crops and maximum livestock and poultry farming per unit area for different crops were calculated as follows:
Where Ff is the nutrient demand for livestock and poultry manure compost for different crops (t); Ri is the maximum amount of livestock and poultry breeding per unit area for different crops (pig equivalent/hm2), i.e., the total amount of various types of livestock and poultry reared per unit area converted into pig equivalent. Pig equivalent: 100 pigs are equivalent to 15 dairy cows, 30 beef cows, 250 sheep and 2500 poultry. q is the nutrient supply per unit of pig equivalent (nitrogen nutrient supply of 7.0 kg and phosphorus supply of 1.2 kg) in the case that all manure produced by livestock and poultry is utilized on-site; Fi is the nitrogen and phosphorus nutrient requirement of different crops (t); FP is the proportion of nutrients supplied by fertilizer to the total nutrient requirement of the crop (%). The proportion of nutrients supplied by fertilizer varies according to soil geography and was set at 45%; MP is the proportion of nutrients supplied by livestock and poultry manure to the total amount of fertilizer applied (%), which was calculated at 50%; MR is the seasonal utilization efficiency of livestock and poultry manure (%), and the seasonal utilization rate of nitrogen and phosphorus from livestock and poultry manure was calculated at 25% and 30%, respectively.
Data Sources
Data on crop production, sown area, rural population size, and urban population size were obtained from China Statistical Yearbook 2022 [21]; data on livestock and poultry output and stock were obtained from China Rural Statistical Yearbook 2022 [22]; data on wastewater discharge were obtained from China Environmental Statistical Yearbook 2022 [23]; and fertilizer application was obtained from China Statistical Yearbook 2023 [21].
Results
Total Organic Waste and Nutrient Resources
After removing the water from various organic wastes, it can be seen that straw and livestock and poultry manure are still the main components of organic waste in China at present, accounting for 65.36% and 30.41% of the total organic waste resources, respectively. Correspondingly, their total nutrients are also higher among all organic wastes, accounting for 53.30% and 35.76%, respectively. In terms of the content of different nutrients, the total amount of N and K of straw were among the highest values of all types of organic wastes. Especially, the total K of straw was as high as 1247.47×104 t, which was nearly three times of the total K of livestock and poultry manure. The total P of livestock and poultry manure was higher than that of straw, reaching 405.69×10⁴ t. In terms of the ratio of total nutrients to total resources, straw is 2.86%, livestock and poultry manure is 4.13%, rural human urine is 11.55%, municipal sludge is 7.06% and domestic organic waste is 0.21%. It is clear that rural human farces and urine and municipal sludge have the highest percentage of nutrients available in them, although the total amount of resources is relatively small.
Table 5.
Planted area, optimal fertilizer application and nutrient requirement [24] of major crops in China in 2021.
Potential for Organic Waste to Replace Chemical Fertilizers
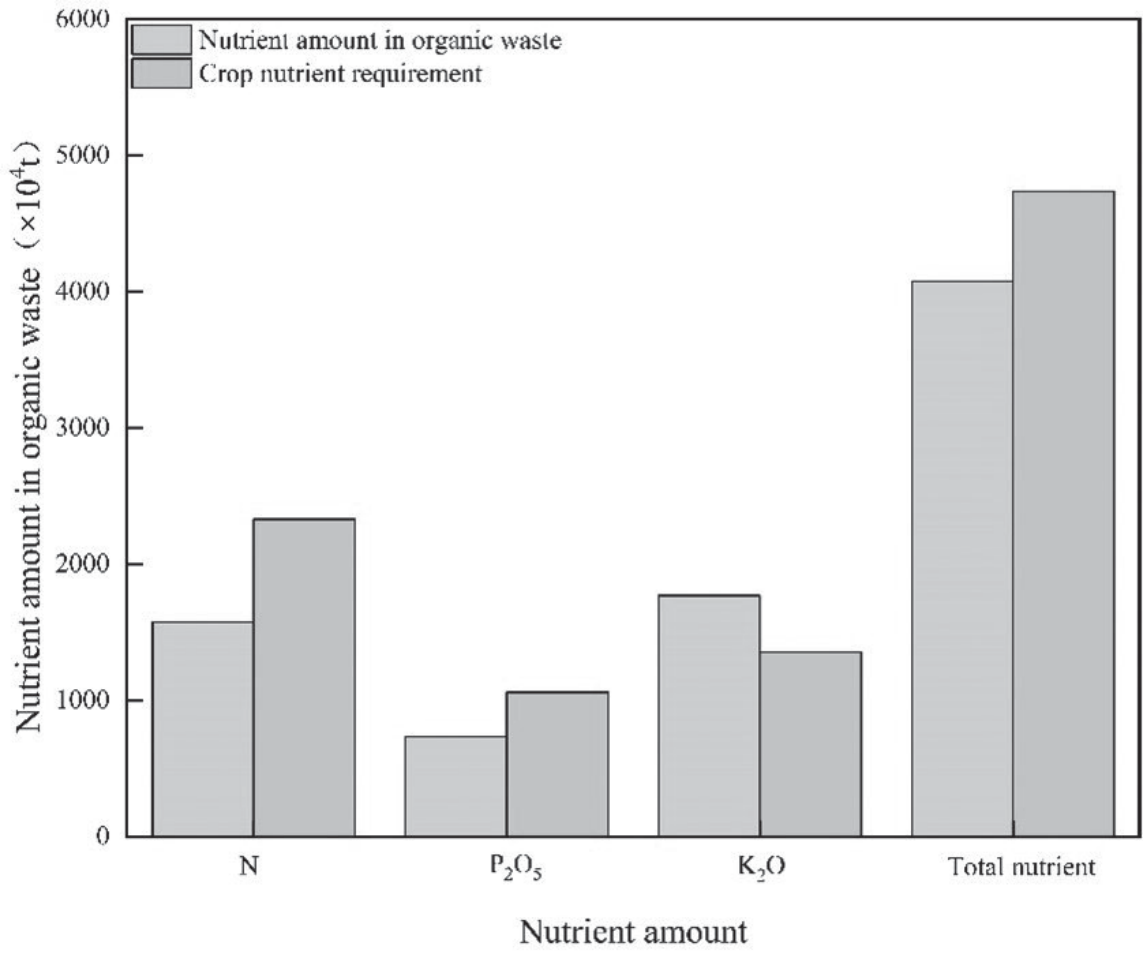
Table 5 lists the planted area, optimal fertilizer application and nutrient requirement for major crops in China in 2021. It can be seen that the current demand for nitrogen fertilizer for major crops in China is still the highest, followed by potash and phosphate fertilizers. The relationship between the total amount of nutrients provided by organic waste and the total crop nutrient requirement in China can be seen more directly in Fig. 1. In general, the total amount of nutrients that can be provided by organic waste in China is 4075.24×104t, which is lower than the nutrient requirement of China’s major crops, which is 4737.88×104t, and there is still a 113.99% shortfall in relation to the requirement. In terms of specific nutrients, the N content and P content available from organic waste in China are both significantly lower than the N and P requirements of major crops, but are sufficient to meet the K requirement.
Land Carrying Capacity for Livestock and Poultry Manure
The current amount of livestock and poultry breeding in China converted to pig equivalent is 11.19×10⁸ pig equivalent. When calculating the land carrying capacity based on nitrogen, the scale of livestock and poultry breeding that China can accommodate is 48.92×10⁸ t pig equivalent. When calculating the land carrying capacity based on phosphorus, the scale of livestock and poultry breeding that can be accommodated in China is 20.84×10⁸ t pig equivalent. At the regional scale, China has a large space for carrying and consuming livestock and poultry manure. When calculating land carrying capacity based on nitrogen, China’s land carrying capacity index is 0.23, while when calculating land carrying capacity based on phosphorus, China’s land carrying capacity index is 0.54.
Discussion
At present, there have been more studies on the estimation of the amount of organic waste generated and nutrients in China, but there are some gaps in the calculation results between different researchers. However, all of them proved that the amount of organic waste production and nutrients in China is huge. The main reason for the difference is the different forms of dry and wet weight presentation of the total amount of waste in the estimation of each researcher, as well as the different scope of the selected research object and the difference in the selection of coefficients, such as: the coefficient of straw, the coefficient of livestock and poultry excreta, the feeding cycle, the content of nutrients, etc., which led to the large differences in the estimation of the amount of straw, livestock and poultry farces, and other organic wastes and nutrients produced by the researcher.
Organic waste is rich in nitrogen, phosphorus, potassium and other nutrient resources, if it can be reasonably returned to the field for resource use, it will greatly reduce the application of chemical fertilizer. If livestock and poultry manure can completely achieve fertilizer use, the fertilizer replacement rate of nutrients in livestock and poultry manure will be more than 60% [25]. At present, different types of organic waste in China have different potential and contribution to return to the field [26]. The fertilization of straw is divided into two forms: direct return to the field and processing of commercial organic fertilizer [27, 28]. According to data, the rate of direct straw return to the field in China in 2016 was 61.27%, with the nutrient amounts of straw directly returned to the field being 7.06×10⁷ t of N, 8.70×10⁵ t of P2O5, and 9.09×10⁷ t of K2O [24]. Methods of fertilizing livestock and poultry manure mostly include direct return to the field, composting return to the field, manufacturing of bio-organic fertilizers, and ash return to the field following burning [29]. The return of livestock and poultry dung to the field delivers a significant amount of nitrogen, phosphorous, and potassium nutrients to the agriculture [29, 30]. The amount of sludge created in China’s sewage treatment sector is increasing year by year, yet the current state of sludge use is concerning [31]. According to statistics, the land utilization rate of sludge in China is only 44.8%, and there is still a lot of sludge being piled up randomly, resulting in resource waste, and due to the high content of heavy metals in the sludge itself, it is currently primarily used for gardening and greening applications [24]. Prior to 1980, the combination of farming and raising was relatively close in China, and most rural human feces and urine were returned to the field for use, but as urbanization and population transfer to cities and towns accelerated, the amount of human feces and urine returned to the field gradually decreased. The Measures for the Management of Rural Toilet Conversion (Trial) improved the amount of human feces and urine collected, the degree of harmlessness, and the possibility for returning human feces and urine to the field. The total amount of nitrogen, phosphorus, and potassium nutrients in organic waste can satisfy 71.8% of the N, 75.9% of the P2O5, and 100% of the K2O for each type of nutrient requirement of the crop, according to this study, if the nutrient resource structure of organic waste in China remains unchanged and the full amount of organic waste is returned to the field. Although organic waste has a high nutritional potential, the nitrogen, phosphorus, and potassium nutrients in organic waste cannot be entirely absorbed by crops. At the same time, some nutrient losses (such as NH3 volatilization, etc.) will occur during the process of organic waste fertilizer treatment, and it is still not possible to achieve the complete cycle of nutrients between organic waste and crops by relying solely on the return of organic waste to the field. As a result, as long as the soil nutrient level remains constant, chemical fertilizers must be used in conjunction with organic fertilizers. Only 38% of the nutrients in our farmland are now derived from organic fertilizers [32], and when compared to Denmark, where 70% of the nitrogen nutrients in farmland are derived from organic fertilizers [33], China’s level of organic waste utilization remains low. Ji et al. [34] shown that composting organic waste into organic fertilizer reduces the global warming potential, eutrophication potential, and environmental acidification potential by 17.5%, 52.9%, and 62.6%, respectively. Furthermore, increasing the use of organic fertilizer can indirectly reduce carbon emissions caused by the production and application of chemical fertilizers. It is estimated that the average carbon emission coefficients of Nitrogen, Phosphorus, and Potassium fertilizers in China are 2.116 t CE/t (N), 0.636 t CE/t (P2O5), and 0.180 t CE/t (K2O), which are 1.6 times the average level of foreign countries (N), 3.2 times the average level of P2O5, and 1.2 times the average level of K2O [35]. Furthermore, long-term organic fertilizer application not only sustains crop yields, but also enhances soil carbon sequestration and increases soil organic carbon content [36]. As a result, increasing the rate of organic waste utilization and minimizing fertilizer application are significant implementation pathways to attain carbon peak and carbon neutrality. However, China currently lacks scientific guidance on the structure and quantity of fertilizer applied to farmland, chemical and organic fertilizer application is disjointed, and in some areas, problems such as high fertilizer application, low fertilizer efficiency, improper fertilizer rationing and layout limit the efficient use of nutrient resources [32]. Simultaneously, issues such as long-distance shipping raise the expense of applying organic fertilizer and diminish the incentive to use organic fertilizer in the plantation business. To address the issue of increased organic fertilizer application costs owing to disparities in geographical and temporal dispersion of commercial organic fertilizer, the industrial layout should be optimized to support the process of resourceful use of organic waste.
Conclusions
The overall amount of organic waste materials and nutrients available in China is enormous, with ample room for usage, and the current size of farming places less strain on the soil carrying capacity of animal manure. If the nutrient resource structure of China’s organic waste remains unchanged and the entire amount is returned to the field, the N, P2O5, and K2O nutrients in organic waste can satisfy 67.48%, 69.30%, and 100% of the nutrient requirements of various types of crops, respectively.

