

Introduction
Since 2011, when Hoff first proposed to consider water, energy, and food as an integrated system for resource security [1], the study of the “water-energy-food” (W-E-F) nexus has gradually entered the vision of resource and environmental researchers, and the research on the W-E-F nexus has gradually been deepened and enriched [2-5]. Water is the source of life, the key to production, and the foundation of ecology, and water resources have always been at the core of the W-E-F system, while the energy and food subsystems are subordinate. As an important strategic material reserve in China, energy and food security are related to the overall situation and stability of socio-economic development, especially in the face of the domestic and international impact of COVID-19. The Political Conference of the CPC Central Committee has repeatedly emphasized that food and energy security are fundamental to the “six guarantees” and are a bottom line that cannot be breached. At the same time, the nexus between the two also affects the resilience and security level of the industrial chain and supply chain to a certain extent. Energy plays an important role in the development process of the food industry, and the production, processing, and transportation of food require a lot of energy support. An adequate food supply also provides the necessary material information for the development of the energy industry, and the biodegradation of crop residues can be directly transformed into biomass energy. Therefore, it is necessary to incorporate linkage thinking into the management behavior of energy and food and promote the sustainable development of the regional economy through the linkage path [6]. Based on these realistic considerations, it is particularly important to analyze the coupling between energy-food (E-F) from a multiregional industrial perspective.
At present, research on the nexus of the Yellow River basin has made great progress [7, 8], while research on the Yangtze River basin is relatively lacking [9]. The Yangtze River basin is a multifaceted and interacting ecosystem including water sources, water quality, water systems, water banks, and water ecology with rivers as the carriers, and its existence provides a variety of material conditions for human economic activities. The Yangtze River basin spans the eastern, central, and western regions of China, with excellent resource endowment conditions, convenient transportation, and a good economic base. On the one hand, benefiting from favorable climate and geographic conditions, the Yangtze River Basin has always been an important grain production base in China, of which the middle and lower reaches of the Yangtze River have commodity grain bases such as the Jianghuai area, Taihu Lake Plain, Poyang Lake Plain, Jianghan Plain, and Dongting Lake Plain. However, with the adjustment of industrial structure and changes in the spatial structure of food production, the proportion of the Yangtze River basin in the national food production has decreased from 47.94% in 1978 to 36.35% in 2018 [10], the production capacity of food is lower than the national average, and the supply and demand of food in the basin are in a tight balance, with structural contradictions becoming more and more prominent. Meanwhile, there are problems in the basin, such as the decline of water quality and the degradation of ecological functions in the basin, which have, toa certain extent, restricted the sustainability of agricultural and economic development. On the other hand, the fossil energy in the basin is relatively small, and the supply tends to decrease from upstream to downstream; meanwhile, the development of industrial structure in the basin varies greatly, and the industrialization process in the downstream areas is significantly faster than that in the middle and upper regions, resulting in the energy demand in the lower reaches of the Yangtze River Basin significantly exceeding that in the upper reaches, which causes the obvious spatial heterogeneity and mismatch between energy demand and supply. Moreover, the main grain-producing areas in the basin are mainly concentrated in the middle and lower reaches of the Yangtze River, and there are differences in the total amount and structure of energy consumption in the production, processing, and transportation of grain. Some of the main grain-producing areas need to mobilize energy to meet the needs of daily production and distribution, and the amount of mobilized energy is on a general trend of increasing. It can be seen that the spatial combination of energy-food coupling in the Yangtze River Basin is poorly adapted, and the rapid development of industries and large population concentration have led to increasing pressure on the E-F system in the basin. Driven by the “double carbon” target and high-quality development strategy, the urgency of industrial structure upgrading and low-carbon energy transition further increases the pressure on industrial development in the basin. It is necessary to investigate the flow characteristics of energy and food between industries in the Yangtze River basin, to study the nexus between energy and food from a multi-regional industrial perspective, and to identify the key industrial chains affecting E-F coupling in the Yangtze River basin to promote efficient and synergistic energy-food management and ensure synergistic energy-food security in the basin.
Literature Review
A bibliometric study of resource linkage research found that increasingly strong resource linkages have growing implications for sustainable development and that there are both synergies and conflicts between sustainable development goals [11]. In this regard, Wang Hongrui et al. pointed out that finding important nodes and pathways of resource consumption while studying network risks is one of the future concerns [12]. Relatively few studies on the energy-food coupling have been conducted, mainly concerning the energy consumption during food production and the biomass provided by the agricultural sector. For example, Dong Ying et al. studied the production efficiency of grain from an energy perspective, stating that the total energy consumption of grain production in China has risen, but the corresponding energy efficiency has shown a cyclical downward trend [13]. As modern agriculture is an energy-intensive industry, energy consumption is spread across all aspects of grain production, so how to innovate agricultural production patterns and improve technology to better energy utilization in grain production has become a hot research topic for scholars [14, 15]. In particular, under the dual-control targets for carbon emissions, the emissions caused by the energy consumption of agricultural machinery will become the biggest uncertainty of the agricultural carbon peak, so how to implement the “low carbon-driven green transformation of agriculture” and accelerate the integration of digital technologies and agriculture have become important explorations for the agricultural sector to practice the new development concept [16, 17]. Du Xiangbei et al. assessed the environmental footprint, energy balance, and cost-benefit analysis for wheat after rice production and pointed out that raised bed planting increases economic efficiency and energy use efficiency while reducing the environmental footprint for wheat after rice production and was shown to be an effective measure to achieve sustainable agricultural development and ensure national food security [18]. At the same time, due to the dual pressure of energy shortages and environmental pollution, accelerating the development and utilization of renewable energy sources such as biomass has become a major strategic initiative to cope with the global energy transition and climate change [19]. Cantarella et al. discussed the potential of biofuels to contribute to a significant market supply, thus replacing fossil fuels and mitigating global warming, and it underscores the challenges in expanding biofuel production and replicating successful models between countries and regions [20]. In addition, for energy food security considerations, Liu Yinglin et al. constructed a cross-market “food-energy-finance” tri-sector system and studied the risk contagion within the system and risk shocks outside the system, pointing out that there is a significant cross-sector risk contagion effect between food-energy-finance after an epidemic [21].
In the quantitative assessment of nexus, the methods mainly involve bottom-up and top-down approaches. The bottom-up approach has the advantage of high data availability and can better quantify resource consumption in different production systems [22]. Mainly, there are specific methods such as energy flow, material flow analysis [23], footprint analysis [24], and the life-cycle method [25], but these methods cannot distinguish between intermediate users and end users and cannot describe the impact of the supply chain on nexus relationships. Top-down methods can be used to systematically assess the overall consumption of resources. Input-output analysis, as a typical top-down method, accounts for the flow characteristics of resources between different sectors based on the number of inputs and outputs, correlates producers and consumers in the whole economic activity, and is effective in assessing the interactions between various sectors of the socio-economic system [26]. The multiregional input-output (MRIO) model is an improvement of the traditional input-output model. By spanning multiple industries in different regions, the MRIO model can examine the inter-regional spillover effects and resource linkages of bilateral trade, capturing the effects of inter-industry and inter-regional trade on resource consumption relationships [27]. Qian XY et al. used a multi-regional input-output model to identify the key points of WEF nexus management in “One Belt and One Road” in terms of WEF utilization efficiency, final demand behavior, and trade inequality [28]. Yating Liu et al. constructed a coupled W-E-F accounting framework based on the MRIO model and conducted a statistical study on different energy and water consumption of different energy and food types. The energy consumption of each stage of water use and the production of different types of food in each region were counted [29].
A review of the literature reveals that the existing studies on the nexus have increasingly diversified in terms of research methods and research perspectives, which have greatly expanded the breadth and depth of research on the energy-food coupling. However, few studies have quantitatively analyzed the energy-food coupling from an industrial perspective, and there is a lack of identification and analysis of the main energy-food coupling sectors and key industrial chains among the industries in the Yangtze River Basin provinces. Clarifying the energy-food coupling among multiregional industries can effectively promote efficient and synergistic management of energy and food in the Yangtze River basin and improve the risk management of energy and food at the basin-wide level. Therefore, this study quantifies the coupled energy-food flows within the Yangtze River basin through an extended multi-regional input-output model. The main ideas are as follows: firstly, the main energy-food coupling nodes in the Yangtze River basin are defined using the integrated nexus strength metric; secondly, the main energy-food coupling sectors are evaluated through linkage analysis to dissect their resource consumption or supply behaviors in the energy-food coupling relationship; and finally, the net flows between the main energy and food coupling sectors are quantified to reveal the key chains of E-F coupling in the Yangtze River basin.
Methodology and Data Sources
Based on the basic requirements of the multiregional input-output model, this study assumes that 1) The production management techniques of different industries belonging to the same economic sector are consistent within a given region, i.e., they carry out homogeneous activities, and 2) only trade flows within the Yangtze River basin are considered, excluding import and export trade flows that interact with other regions at regional borders
Multi-Regional Input-Output Analysis
Based on the standard IO analytical framework, without considering exports, the monetary input-output balance of the basic MRIO model can be determined as:
Where xir is the total output of sector i in region r, which is an mn×1 matrix. Zijrs denotes the intermediate input from sector i in region r to sector j in region s, which is an mn×mn matrix. yirs is the final input of sector i in region r to sector i in region s, which is an mn×m matrix. m is the total number of regions, and n is the number of sectors in each region.
The intermediate consumption matrix A, which represents the industrial input of domestic products and can be expressed as:
Where aijrs is the direct consumption of sector i in region r to meet the direct consumption of unit product production of sector j in region s. xsj is the total output of sector j in region s, which is a 1×mn matrix.
Consequently, let X = (xis), and, Y = (yirs), and the MRIO model can be written as:
Where (I–A)–1 is the Leontief inverse matrix.
Taking into account the intensity of resource consumption, the revised MRIO model can be defined as:
Where eir is the resource consumption coefficient of the per-unit economic output of sector i in region r, that is the embodied resource consumption intensity. dir is the resource consumption of region r to fulfill the needs of sector i, which is an mn×1 matrix.
Let E = (eis), D = (dis), and Z = (Zijrs), then, the resource consumption intensity is obtained by the following formula:
Integrated Nexus Strength Metric
To better quantify the linkages between sectors in the economic system and to identify coupled energy-food sectors, we use the Integrated Nexus Strength (hereafter referred to as "INS"), which is a composite indicator that takes into account the intensity of resource consumption and provides a more intuitive picture of implied resource consumption and its corresponding intensity level, to identify strongly coupled energy-food sectors. This can be used to identify strongly coupled energy-food sectors. By comparing the size of the INS value of each sector, and the strength of the sector's role in the resource [23].
The Nexus Strength (NS) of sector i that considers T kinds of resource consumption is expressed as follows:
Where t is the type of resource consumption, ωt (t = 1, 2, 3, ..., T) is the importance weight, Σωt = 1. i refers to the sector and N is the total number of sectors. dit is the direct consumption of resource t in sector i. Considering the intensity of resource consumption, the revised Integrated Nexus Strength (INS) is formulated as:
Where ei(t) is the identity of resource consumption t (resource consumption per unit of economic output). IDi(t) is the relative contribution of sector i to the intensity of resource consumption relative to resource consumption t.
It should be noted that when considering the nexus of two resources, ωt is preset to be 0.5.
Linkage Analysis
Linkage analysis is derived from input-output analysis and demonstrates the specific flows of indicators within the socioeconomic system by illustrating the in-effects, net forward effects, and net backward effects. This paper evaluates the main coupling nodes of E-F and characterizes the economic behavior of the main coupling sectors through linkage analysis, without considering the vertical integration effects that include direct and indirect consumption and considering only three sub-indicators IE, NBL, and NFL. The main equations are as follows:
Where s and -s indicate the target sector and the rest sectors, and the matrices A, L, and Y are divided into four sub-matrices respectively.
IE, the in-effect, the resource consumption triggered by its final demand, represents the degree of self-circulation of the resource, expressed as:
Where Es is the resource consumption intensity of sector s.
NBL, or Net Backward Linkage, considers the resource consumption contained in the products consumed by external production and the current sector to meet its final demand, that is, the external resources consumed by the current sector to meet the final demand. NFL, or Net Forward Linkage, considers the resource consumption contained in the products produced by the current sector and used by other sectors, that is, the resource consumption of the current sector to satisfy the final demands of other sectors. If the NBL is greater than the NFL, then this sector is a resource consumer. If NBL is less than NFL, the sector is a resource supplier [30, 31]. Expressed as:
where E–s refers to the resource consumption intensity matrix of sectors other than s. The relationship between NBL and NFL is expressed as follows:
where NL (net linkage) refers to the total resource consumption links of all sectors in the target region.
Net Implied Flows
The flows of resources contained between nodes are the basis for identifying key chains. The implied input and output flows of the target sectors are calculated separately, and the input and output flows of the paired sectors are subsequently aggregated to obtain the net flows between sectors. The network analysis of the implied net flows provides clues for the identification of the key chains, and the paired sectors sharing a large number of implied flows are the key links of E-F coupling. The intersectoral implied flow matrix is expressed as follows:
where Ê is the diagonal matrix of E, F is the matrix of implied flows whose elements fij represent the implied resource flows from sector i to sector j, F’ is the transformation matrix of F, and NF is the net flow matrix whose elements nfij represent the net implied flows between sector i and sector j.
Data Sources
The input-output table in China is compiled every five years, and the latest multi-regional input-output table is updated to 2017, so only data matching the corresponding year can be used to conduct the study. The carbon emission data involved are obtained from the China Carbon Accounting Database; the energy consumption data are obtained from the China Energy Statistical Yearbook, the provincial statistical yearbooks, and the China multi-regional input-output tables of the corresponding years; and the food consumption data are obtained from the China Rural Statistical Yearbook, the China Statistical Yearbook, and the China multi-regional input-output tables of the corresponding years. Analysis of the MRIO tables revealed the existence of five sectors with no or less economic interaction with economic sectors in other regions. Combining the characteristics of each of the 10 provinces, this paper divides the regional economic system involving energy and food into 37 sectors to maintain consistency. Table 1 summarizes the details of each sector.
Referring to the calculation method on resource consumption data for each sector by relevant scholars [32]and considering the availability of data, the energy consumption (10,000 tons of standard coal) referred to in this paper refers only to the data of energy used to generate heat by combustion, i.e., it is calculated from the energy consumption data after removing the fossil fuel is used as an input for industrial raw materials. According to the MRIO table, the energy consumption data for each sector in each region is calculated from the ratio of the input in the sector to the total input in all sectors in the sector related to energy supply in the region. Food consumption (10000 tons) is calculated in a similar way to energy consumption.
Results and Discussion
Energy-Food Coupling Sector Identification
Though each sector plays a role in the energy-food coupling, only those sectors that fulfill the corresponding set conditions are considered energy-food coupling nodes. In this section, the energy consumption intensity and food consumption intensity are accounted for separately by the extended MRIO model, and the energy-food coupling nodes in each province of the Yangtze River basin are defined using Equation (9), to identify the sectors that have a prominent impact on the energy-food coupling in the economic system of the Yangtze River basin.
Table 1.
Details of aggregated sectors.
[i] Note: Among the 10 provinces involved in the study, for ease of description and unification, Shanghai’s (01) Agriculture, Forestry, Animal Husbandry and Fishery is referred to as A01, and the same sector in Jiangsu is referred to as B01, and Anhui’s is called C01, Jiangxi’s is called D01, Hunan’s is called E01, Hubei’s is called F01, Chongqing’s is called G01, Sichuan’s is called H01, and Yunnan’s is called H01, and the sector in Qinghai is called J01. And so on for other coupling sectors.
In terms of sectoral differences, as shown in Fig. 1. the Production and Distribution of Electric Power and Heat Power (20) has the largest INS in the basin with 10.50%, indicating that this sector plays an important role in the energy-food coupling relationship in the Yangtze River basin as a key supply sector of energy. It is followed by 03 Food and Tobacco Processing and 04 Textile Industry with INS of 9.60% and 6.03% respectively, both of which belong to typical food or energy consuming sectors and directly affect the stability and balance of food or energy demand in the basin. In addition, 01 Agriculture, Forestry, Animal Husbandry and Fishery sector, 09 Manufacture of Chemical Products, 21 Production and Distribution of Gas sector, and 26 Accommodation and Catering sector also have significant energy and food consumption intensity, and the INS of the four sectors in the basin are 4.32%, 4.98%, 4.39%, and 4.00%, respectively. The combined INS values of the above seven sectors account for about 43.81% of the total INS in the region and are important segments of energy and food consumption in the basin.
In terms of provincial differences, the INS of each sector has significant spatial variability. For example, Shanghai’s Accommodation and Catering sector (A26) has the highest INS value of 0.3989. As one of the most well-developed cities in China, Shanghai has a strong radiative influence on Jiangsu, Zhejiang, and Shanghai, and its consuming market is stable and strong, and the intensity and development of its Accommodation and Catering sector is much higher than those of other regions, hence, this sector in Shanghai plays a significant role in the energy-food coupling in the Yangtze River basin with a resource, and the contribution to energy consumption is obvious. For Jiangsu, the Production and Distribution of Electric Power and Heat Power (B20) has the highest INS value of 0.6462. As one of the six high-energy-consuming industries, the Production and Distribution of Electric Power and Heat Power have a high intensity of energy consumption, and Jiangsu, as the second-strongest province in China, has a relatively strong demand for energy itself. Sichuan’s Food and Tobacco Processing (H03) has an INS value of 0.6221, ranking first among all economic sectors in the province. As one of the leading industries in Sichuan, Food and Tobacco Processing both consume large amounts of energy and food in the production and development processes; thus, the sector has outstanding resource consumption performance in the Yangtze River basin and is an important energy-food coupling node.
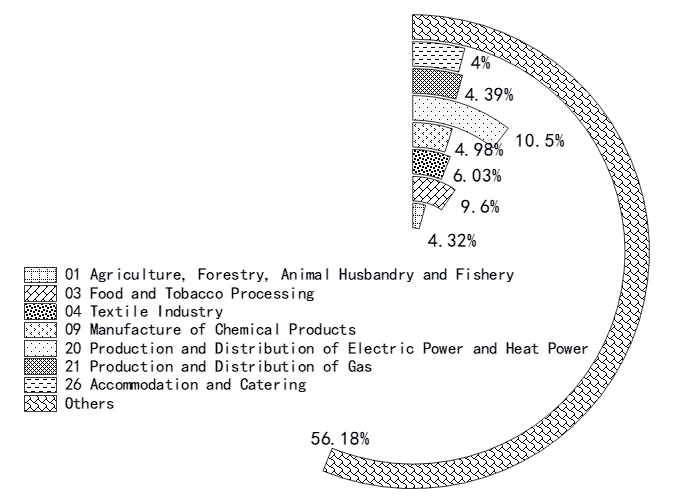
Based on the above analysis, the 37 sectors ranked in the top 10% of INS values from 370 sectors in all 10 provinces were selected as the main coupling nodes of E-F, as shown in Table 2.
Energy-Food Major Coupled Sector Linkage Analysis
The 37 E-F coupled sectors selected for linkage analysis were used to derive the in-effect (IE), net backward effect (NBL), and net forward effect (NFL) in energy consumption and food consumption for each sector using equations (14), (15) and (16), and further examine the sectors with more prominent consumption or supply behavior in the energy-food coupling.
Linkage Analysis of Energy Consumption in the Major Coupling Sectors
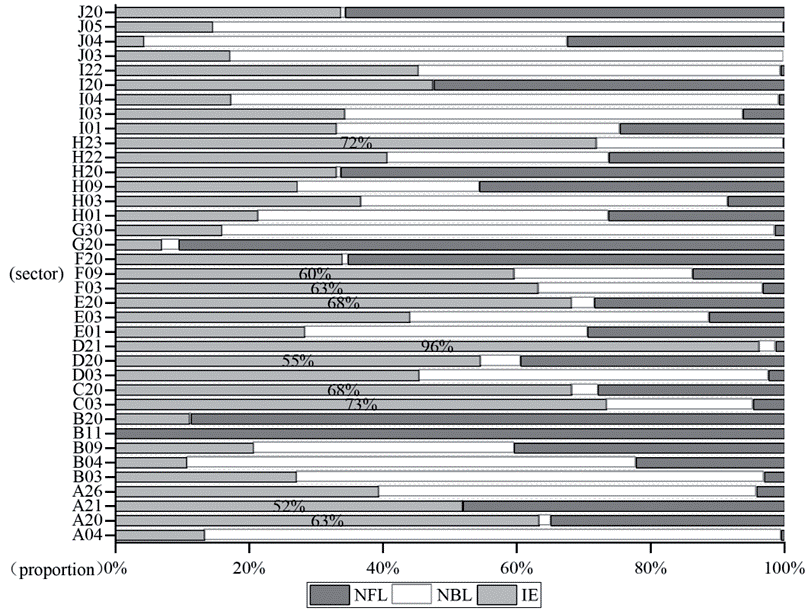
In terms of energy consumption, among the sectors in the Yangtze River Basin, 09 the Manufacture of Chemical Products, 20 Production and Distribution of Electric Power and Heat Power, consume energy to meet their own needs while transferring a large amount of implied energy to other sectors for use, whereas the remaining sectors consume energy mainly to meet their own production and development needs. Fig. 2 shows the results of the energy consumption linkage analysis for the coupled energy-food sectors, showing the share of the three indicators IE, NBL, and NFL within the three indicators in the energy consumption process of each coupled sector, which visualizes the economic role of each coupled sector in energy consumption. Specifically, in the 09 Manufacture of Chemical Products, the NBL and NFL of the B09 sector account for 39.03% and 40.36%, respectively, as well as 17.15% and 17.13% of the NL, indicating that Jiangsu’s Manufacture of Chemical Products in the Yangtze River Basin consumes a large amount of implied energy that is transferred to other sectors for use in addition to the final product needs of the sector. 20 the Production and Distribution of Electric Power and Heat Power, the proportion of NFL to NL in this sector is large in all regions except C20, implying that within the Yangtze River basin, this sector exists in the majority of provinces as an implied energy supplier. Among them, the percentages of IE each of IE, NBL, and NFL in four sectors, A20, C20, D20, and E20, are above 50%, while the percentages of NFL in these sectors are all above 25%, with the highest being 39.36% in sector D20, indicating that the Production and Distribution of Electric Power and Heat Power in Shanghai, Anhui, Jiangxi, and Hunan consume large amounts of energy while actively transferring large amounts of implied energy to other sectors in the basin. Furthermore, the NFL of the B20 and G20 sectors is 59.92 mtce and 8.18 mtce, respectively, accounting for 88.67% and 90.47% of the total of their respective three indicators, and the NFL of B20 accounts for 25.49% of the NL, indicating that the energy consumption of the production and supply sectors of electricity and heat in Jiangsu and Chongqing mainly comes from the demand of other sectors.
Table 2.
E-F coupling nodes.
Except for the Manufacture of Chemical Products and the Production and Distribution of Electric Power and Heat Power, the rest of the sectors in the Yangtze River Basin consume energy mainly to meet their own production needs, and the ratio of their IE and NBL to the total of the three indicators is above 50%. For example, the ratio of IE in the H01 sector of Sichuan to the total of the three indicators is 21.30%, and the ratio of NBL is 53.44%, indicating that the Agriculture, Forestry, Animal Husbandry, and Fishery sectors in Sichuan has been developed rapidly during the study period, which has put higher demands on the stable supply of energy. Additionally, it can be seen that the proportions of both IE and NBL in the 03 Food and Tobacco Processing, 04 Textile Industry, and 05 Manufacture of Leather, Fur, Feather, and Related Products and their products are large, indicating that the energy consumed in these sectors is used to meet their demand while also being influenced by the final demand of other sectors, and the proportions of NBL in the B03 and B04 in NL are 11.76% and 12.97%, respectively, implying that the two sectors of Food and Tobacco Processing and Textile Industry in Jiangsu are both important end users of energy and are influenced by the consumption demand of other sectors in the basin.
Linkage Analysis of Food Consumption in the Major Coupling Sectors
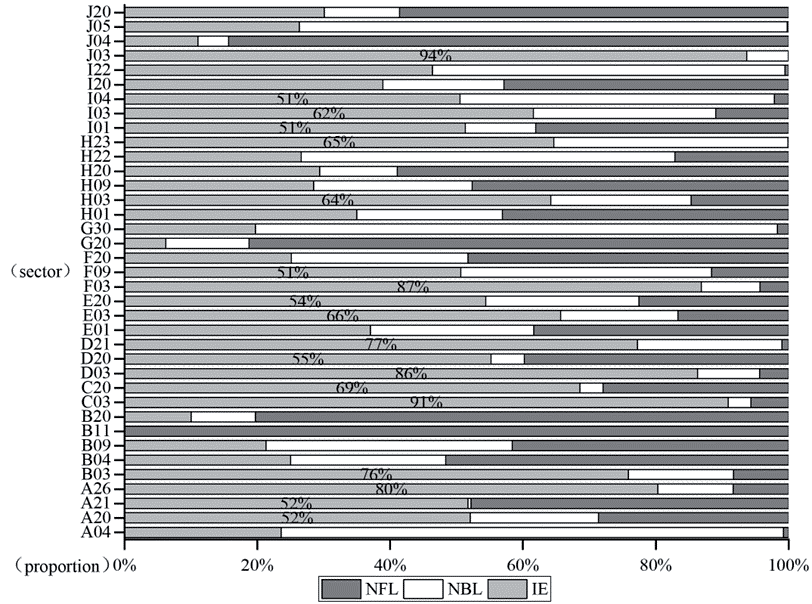
In terms of food consumption, except for the 01 Agriculture, Forestry, Animal Husbandry, and Fishery, 04 Textile Industry, 09 Manufacture of Chemical Products, 11 Smelting and Processing of Metals, and 20 Production and Distribution of Electric Power and Heat Power, where food consumption is mainly derived from the final demand of other sectors, the food consumption of the remaining sectors in the basin is mainly used to meet their own product development needs. Fig. 3 shows the results of the food consumption linkage analysis for the coupled energy-food sectors, showing the share of the three indicators IE, NBL, and NFL within the three indicators in the food consumption process of each coupled sector and visualizing the economic role of each coupled sector in food consumption. Specifically, the percentages of both IE and NFL in the 01 Agriculture, Forestry, Animal Husbandry, and Fishery are all above 30%, and the proportion of NFL to NL is all above 8%, with the highest being 16.74% in the H01, indicating that the food consumption of the Agriculture, Forestry, Animal Husbandry, and Fishery, while meeting its demand, also transfers a large number of implied food resources to other sectors for use and is also in the basin as a whole important food supply entity. In the Textile Industry, the B04 and J04 have a relatively large proportion of NFL at 51.67% and 84.32%, respectively, implying that food consumption in the Textile Industry in Jiangsu and Qinghai mainly originates from the final demand of other sectors. 09 the Manufacture of Chemical Products, 11 the Smelting and Processing of Metals, and the 20 Production and Distribution of Electric Power and Heat Power are similar to the previous analysis in that food consumption in these sectors is mainly driven by other upstream and downstream sectors.
Except for five sectors such as 01 Agriculture, Forestry, Animal Husbandry, and Fishery, the rest of the sectors consume food mainly to meet their own production needs, and their IE and NBL are above 50% of the total of their respective three indicators, and most of them are above 90%. As an example, the proportion of IE and NBL in the 03 Food and Tobacco Processing is above 83% of the total of the three indicators, indicating that the sector's food consumption is mainly derived from its demand. Among the provinces in the Yangtze River basin, the NBL and NFL of B03, E03, and H03 all account for a larger proportion of NL, with the NBL and NFL of E03 accounting for 10.87% and 10.27% of NL, respectively, indicating that Food and Tobacco Processing in Hunan are important food-consuming entities in the basin and export some of the implied food to other sectors while consuming food themselves. This also verifies the scale of development of Food and Tobacco Processing in Hunan, with 2,685 food enterprises (excluding tobacco) above the scale in Hunan Province in 2020, with a business income of 527.41 billion yuan, and the total economic volume of the food industry ranked seventh in the country.
Net Intersectoral Flow Analysis
The results of the energy-food linkage analysis for 37 sectors in 10 provinces of the Yangtze River Basin illustrate the supply and demand for energy and food in the course of economic development in the relevant sectors. To further track the net implied energy and food flows among selected energy-food coupling nodes between regions, the intersectoral interactions can be clearly shown by flow mapping. Using Equation (19), the net flows between sectors can be derived, and the study selects the top 10% of sectors in terms of net flows of resources between sectors to make net flow maps for energy and food, respectively, as shown in Figs 4 and 5, where the width of the flows can reflect the magnitude of the flows between sectors and the direction of the flows can indicate the role of sectors in the energy-food coupling.
The net energy flow patterns among the coupled sectors are shown in Fig. 4, which shows that the Manufacture of Chemical Products (B09) and the Production and Distribution of Electric Power and Heat Power in Jiangsu (B20) are the main net implied energy export sectors in the Yangtze River basin, with implied energy exports to other sectors in the basin of 222,9.38 mtce and 198,0.02 mtce, respectively, and account for 32.18% and 28.58% of the implied energy output of the basin, which is related to the higher energy NFL value of Jiangsu. Among them, the implied energy output of B09 mainly goes to 03 Food and Tobacco Processing, 20 Production and Distribution of Electric Power and Heat Power, which exported 522.62 mtce and 627.74 mtce to these two sectors, respectively, accounting for 23.44% and 24.98% of the implied energy output of B09. The implied energy flowing from the B20 to other regional 20 Production and Distribution of Electric Power and Heat Power is about 24.80%, and the implied energy flowing to 03 Food and Tobacco Processing is 23.43%. And the implied energy exported from the Sichuan Construction sector (H23) to other sectors in the basin is 2013.57 mtce, accounting for 29.06% of the implied energy output in the Yangtze River basin, and the implied energy from this sector mainly goes to 03 Food and Tobacco Processing and 20 Production and Distribution of Electric Power and Heat Power, accounting for 26.47% and 24.82% of the implied energy output from this sector, respectively. However, the H23’s NBL of 11.32% of NL in the linked analysis implies that the H23 consumes a significant amount of energy driven by the final demand of other sectors, making it stand out in the implied net energy output.
The net food flow patterns among the coupled sectors are shown in Fig. 5. It can be seen that the three sectors of Food and Tobacco Processing (C03, E03, and H03) in Jiangxi, Hunan, and Sichuan export a large amount of implied food to other related sectors, exporting 179.75 mt, 193.27 mt, and 252.32 mt of implied food to other sectors in the basin, respectively, accounting for 20.89%, 22.46%, and 29.31%, and mainly flow to the production and supply sectors of 20 Production and Distribution of Electric Power and Heat Power in each region. Among them, the implied food in C03 flows to the Production and Distribution of Electric Power and Heat Power in each region was about 68.22 mt, accounting for 37.95% of its total implied food output, and the implied food in this sector flowed more evenly to the Production and Distribution of Electric Power and Heat Power in each province. B03 and F03 export 13.63% and 13.23% of the implied food in the basin, and the implied food exported from B03 and F03 mainly go to 20 Production and Distribution of Electric Power and Heat Power, accounting for 43.81% and 48.22% of the total implied food exported from this sector, respectively. In addition, Agriculture, Forestry, Animal Husbandry, and Fishery in Sichuan (H01) export 4.08 mt of implied food to the Production and Distribution of Tap Water in Yunnan (I22), which is consistent with the NFL highlighted in H01 above.
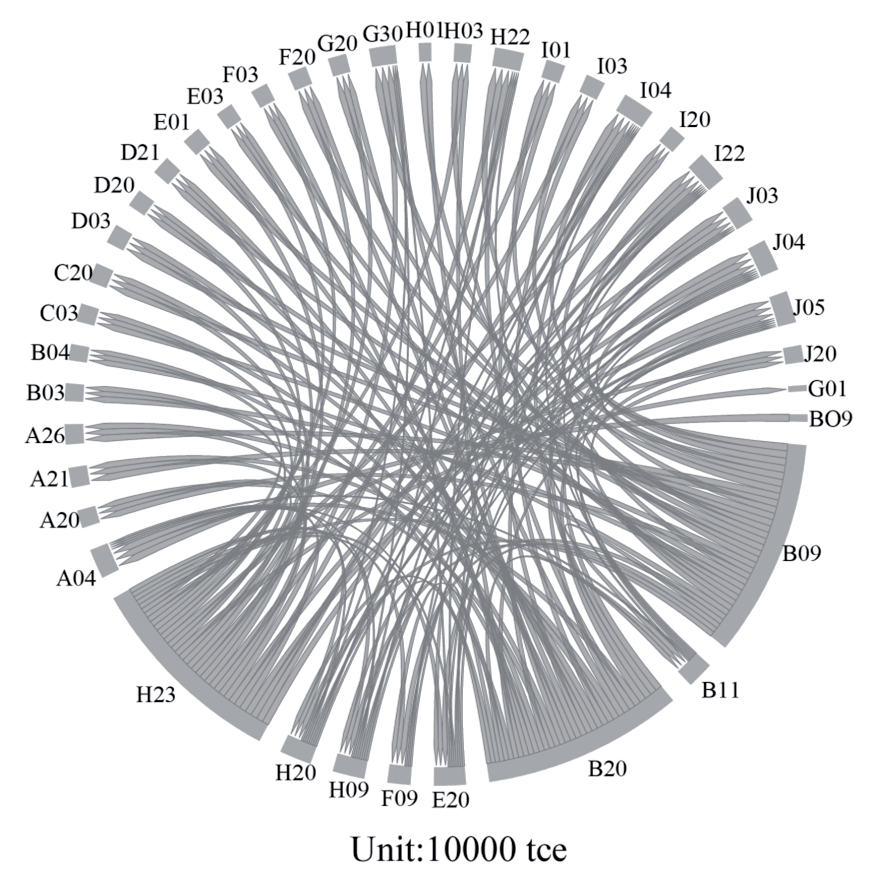
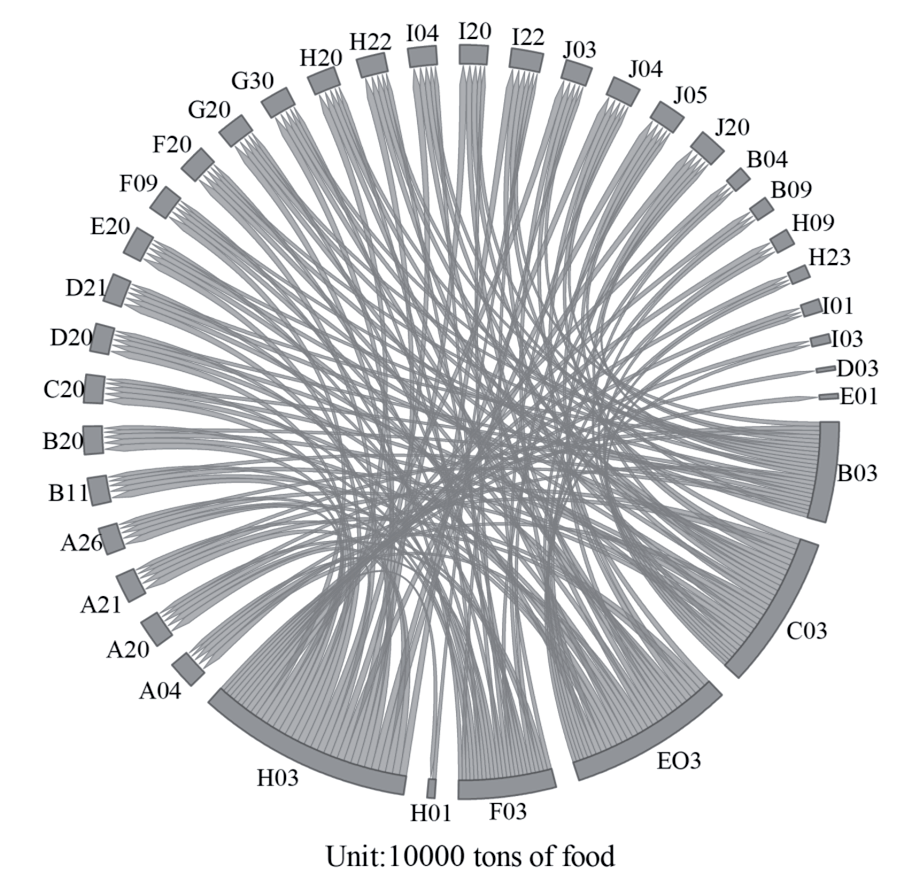
From the above analysis, it can be seen that four sectors, the Manufacture of Chemical Products in Jiangsu (B09), the Construction Sector in Sichuan (H23), the Food and Tobacco Processing in Jiangxi, Hunan, and Sichuan (C03, E03, H03), and 20 the Production and Distribution of Electric Power and Heat Power in each province outline the key chain of E-F coupling in the Yangtze River basin. The Yangtze River basin is densely populated, with a high level of economic development and a well-established industrial base, and the demand and supply of energy and food between sectors are closely related and flow frequently. Among them, the Manufacture of Chemical Products in Jiangsu (B09), as a technology-intensive industry, needs energy as power input and energy as raw material input for the production of its products, and also needs food as raw material input for the production of chemical products, so the B09 plays a prominent role in the E-F coupling in the Yangtze River basin, which strengthens the position of the Jiangsu chemical industry as a key national base for the industry. Meanwhile, the 03 Food and Tobacco Processing in the basin stands out in the energy-food coupling, where the sector requires a large amount of food as raw material input in the production process and consumes energy to power the production activities and further ensure the normal operation of the sector's economic activities. Further, 20 the Production and Distribution of Electric Power and Heat Power exported a large amount of implied energy to other sectors by providing power to them, while at the same time, the sector received a large amount of implied food input from the sector of 03 Food and Tobacco Processing.
Conclusions and Suggestions
By constructing an MRIO combining energy and food consumption, introducing an integrated nexus strength metric (INS) to identify the main energy-food coupling nodes, characterizing the resource behavior of the main energy-food coupling sectors based on linkage analysis, and finally quantifying the net flows between the main coupling sectors, the key industrial chain of energy-food coupling in the Yangtze River basin is revealed. The study finds that:
From the perspective of energy consumption, most sectors in the Yangtze River Basin play the role of consumers in energy consumption, and their energy consumption is mainly to meet their own production and development needs, whereas the 09 Manufacture of Chemical Products, the 20 Production and Distribution of Electric Power and Heat Power mainly to meet the needs of other upstream and downstream sectors in the basin, and they play the role of energy suppliers in the basin.
In terms of food consumption, the 01 Agriculture, Forestry, Animal Husbandry, and Fishery, the 04 Textile Industry, the 09 Manufacture of Chemical Products, the 11 Smelting and Processing of Metals, and the 20 Production and Distribution of Electric Power and Heat Power play the role of suppliers in the Yangtze River Basin's food consumption, which is mainly driven by the final demand of the other sectors, and the rest of the sectors, which are mainly used to satisfy their own production and development needs, are the main consumers of food in the Basin.
The Manufacture of Chemical Products in Jiangsu (B09), the Construction Sector in Sichuan (H23), the Food and Tobacco Processing in Jiangxi, Hunan, and Sichuan (C03, E03, and H03), as well as the 20 Production and Distribution of Electric Power and Heat Power in each region, together outline the key industrial chain of energy-food coupling in the Yangtze River Basin, which should be emphasized to mitigate the risks of industrial development due to external shocks such as epidemics or trade frictions.
In response to the above findings, the following suggestions are made:
Dynamically identify the economic roles of the major coupled energy-food sectors in the Yangtze River Basin in terms of resource consumption, accurately locate resource suppliers and consumers, and optimize the efficiency of resource utilization. Differentiated analysis and management of consumers and suppliers of different types of resources will be carried out, and changes in the major coupled energy-food sectors and their economic roles will be monitored in real-time according to the current state of economic development and industrial restructuring to ensure the timely supply of resources to avoid inefficiency and confusion.
Strengthening resource resilience in key industry sectors in key industrial chains to ensure that energy and food in the Yangtze River Basin are matched between industry supply and demand. Pay full attention to key industrial sectors such as the Manufacture of Chemical Products in Jiangsu (B09), the Construction Sector in Sichuan (H23), the Food and Tobacco Processing in Jiangxi, Hunan, and Sichuan (C03, E03, and H03), as well as the 20 Production and Distribution of Electric Power and Heat Power in each region. Strengthen the links between the leading sectors to ensure the quality and quantity of energy and food supply and to make industrial development resource-resilient and more risk-resilient. and strong risk resilience to reduce the risks associated with the interconnectedness of energy and food.
Taking into account regional resource endowments, establish cross-regional coordination structures and corresponding coordination mechanisms to ensure efficient intersectoral energy and food interoperability on demand. From the perspective of sustainable and high-quality development objectives, strengthen the links between the same and related sectors in different regions of the basin to improve the efficiency of the use of energy and food; further develop integrated energy-food management efforts; realize the sharing of data and information resources; and promote efficient intersectoral interconnections and synergistic development of energy and food in the basin.
Finally, it should be noted that since the Yangtze River basin under study involves three regions, east, central, and west, the economic development varies greatly among regions, and the industrial structure and industrial development levels vary, resulting in different roles and contributions of the same sector to the coupled energy-food coupling in different regions. In this paper, the resource consumption of each sector in each province within the Yangtze River basin is derived by indirect calculation, which may not fully reflect the resource utilization in reality. In addition, the research process aggregates 42 sectors into 37 sectors, and this mapping process may lead to the loss of some information. The above deficiencies will be further analyzed in the future by combining environmental factors and other effective models to more clearly portray the energy-food coupling of various economic activities in the Yangtze River basin.

