

Introduction
Habitat ecological environment (HSEE for short) can be interpreted as the living settlement of human beings, which is a significant foundation for economic development[1]. In the context of the transformation of China’s economy[2], speeding up the establishment of ecological civilization and building a good human habitat have become the focus and difficulty of current economic development in China, The province of Anhui is an essential component of the Yangtze River Basin, with a wide range of radiation from north to south and is located in the docking zone of several economic plates, and it is an important environmental governance area in China[3][4]. However, water quality decline[5], environmental pollution[6], ecological deterioration[7] and other problems derived from high-quality development are increasing, and environmental quality is seriously threatened[8][9], Exploring the spatio-temporal differentiation in the development of habitat ecosystems, and their drivers will help to clarify the current status of habitat development between provinces[10]. In anticipation of the rational use of provincial resources to speed up the civilization of ecosystem[11], it also provides scientific guidance to address the relationship between ecological safeguard and high-quality economic development.
In 1954, the Greek scholar Doxiadis first proposed anthroposophy and published several works on the subject[12]. Subsequently, some scholars began to study the ecological environment of human settlements from different perspectives. It can be summarised as the innovation of the application of research methods, the specific discussion of the research object, the construction of the evaluation index system, and the temporal and spatial distribution. The research objects come mainly for the sustainable progression of a local biological ecosystem and habitat[13][14], regional differences and spatial influencing factors[15], and ecological security evaluation[16]. The research methods focus on The projection pursuit (PP) method[17], GIS and remote sensing[18]-[20], hierarchical analysis[21][22], entropy value method[23][24], Monte Carlo method[25], Topsis[26]-[28]. Of these, GIS and remote sensing are the most widely used. On the methodology for constructing the indicator system, there are four main types: directly based on research needs and data availability, on the basis of PSR model[29][30], the DPSIR model[31][32], and based on the SFPHD framework[33]. The study area is mainly concentrated in the upper Minjiang River basin[34][35], the Yellow River’s middle and lower reaches[36]-[38], the Yangtze River basin[39][42], and Beijing Municipality in China[43].
Through literature combing, it is found that in China, there is still room for in-depth exploration of researching the ecological environment of populated areas. In contrast, there are fewer studies on integrated analyses of ecosystem quality in various provinces and cities. In terms of the construction of the evaluation indicator system, it lacks comprehensiveness, ignores political factors, economic factors and other aspects, and the indicator system has yet to be enriched. In the selection of evaluation models, PSR and DPSIR models are mainly used, and PESTEL models are less frequently applied. Finally, in the comprehensive evaluation of human ecological environment by various scholars, GIS and remote sensing, TOPSIS, entropy weight and other methods are mostly used to carry out research. Among them, the TOPSIS method has advantages of truthful, logical, and trustworthy. Consequently, the research integrates the entropy weight method and TOPSIS on both sides, and applies the entropy weight-TOPSIS method for evaluating the multi-dimensional and multi-indicator research object. This is also conducive to reflecting the systematic process of human ecological environment evaluation.
Therefore, Anhui Province, which is located in China, is used as the research subject in this study. On this basis, it establishes the comprehensive evaluation indexes of the degree of human habitat ecosystem, and mainly concentrates on the comprehensive evaluation of the quality of human ecological environment and the geographic and chronological distribution of the two aspects of the study. The time frame of the study is from 2012 to 2021, and the PESTEL model is the basis for establishing the model of the evaluation, and the entropy weight-TOPSIS methodology is utilized to compute and rank the weights of the indicators, and measure the human habitat ecosystem in Anhui Province. Thereby, correlation is calculated with the grey correlation to analyse vertical time dimensional and horizontal space dimensional evolution of the indicators from multiple dimensions, and to clarify the temporal evolution of the indicators and their influence mechanisms. This will provide suggestions for the optimisation and improvement of the level of human environment and the formulation of ecological compensation policies in Anhui Province.
Materials and Methods
Study Areas
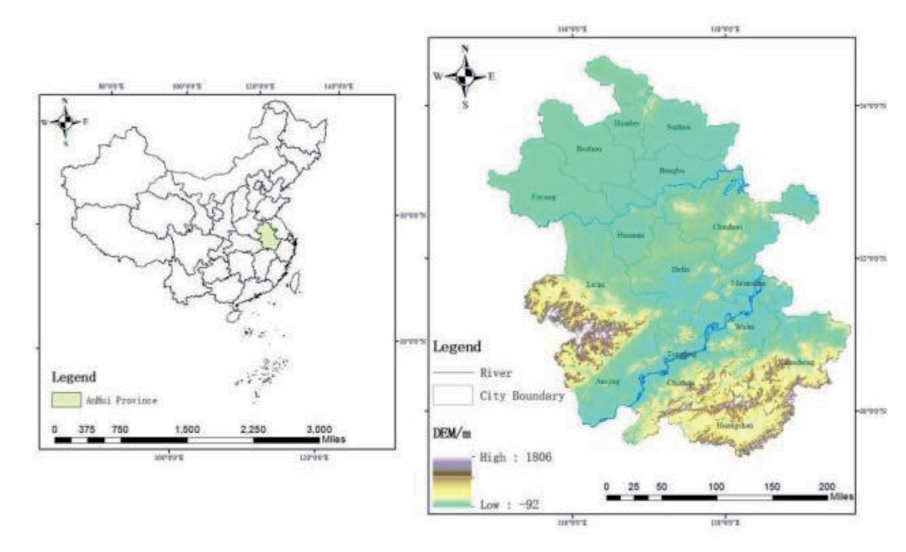
Anhui (114°54′E-119°37′E, 29°41′N-34°38′N) is located in East China (Figure 1). Economically, it belongs to the eastern economic region of China; it is situated in the lower and middle sections of the Huaihe and Yangtze rivers, and in the Yangtze River Delta’s hinterland. It is centred in the middle and leaning to the east, exposed to the sea and along the large number of water systems, with an east-west breadth of 450 kilometres and a north-south length of 570 kilometres. It has a jurisdiction area of 140,100 square kilometres, which is the 22nd largest in China, accounting for 1.45% of the national total. It is also rich in rivers and topographical variations.
Since 2022, the environmental conditions of soil and groundwater in the province have remained stable; the quality of the radiation environment is at a normal level; the quality of the acoustic environment has remained stable; and the natural environment is normally of high quality, but there are still problems. The concentration of pollutants in the atmospheric environment of Anhui Province shows obvious seasonal change characteristics, the average frequency of acid rain in the province is 9.2%, and the annual fine particulate matter in the province’s ambient air (PM,5), respirable particulate matter (PM), sulphur dioxide (SO), and nitrogen dioxide (NO) in the ambient air of the province have not been significantly reduced. The Yangtze River Basin, Huaihe River Basin, Xin’an River Basin and other regions of the surface water appeared a number of light and moderate pollution. Excessive fluoride and sodium levels exist in centralised drinking water sources. Overall, although the ecological level of human settlements in Anhui Province has partially improved, there is still much room for progress.
Research Method and Process
Research Process
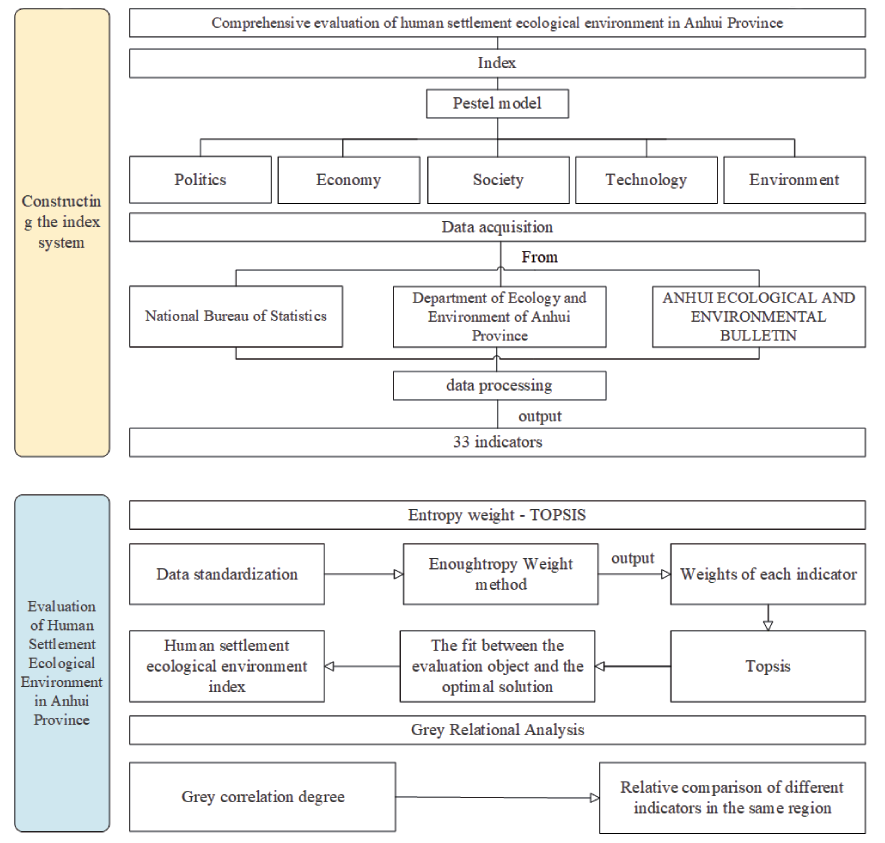
By combing through the extensive literature, a system of evaluation indexes was established on the basis of the PESTEL model, entropy weight-TOPSIS and grey correlation analysis were chosen to evaluate the aggregate condition of ecological development of human habitat in Anhui Province. The specific method flow (Fig. 2.) is as follows: first, including the indicators in the PESTEL model indicator system, five dimensions were established: political, economic, social, technical, and environmental. Second, preprocessing the data. The data was obtained from the National Bureau of Statistics (2012-2021), the Department of Ecology and Environment (2012-2021), the Ecological and Environmental Bulletin(2012-2022) and Department of Ecology and Environment(2012-2021). Excluding missing years and missing data indicators, 33 indicators were acquired. Thirdly, systematically assessing the ecosystems of human settlements in Anhui Province through entropy weight TOPSIS. It analyses the alteration in the aggregate condition of the human habitat ecosystems in the time dimension, and the changes in the development of each region in the horizontal spatial dimension. Fourthly, applying grey relational analysis methodology, comparing the intensity of influence of different indexes in the same region, and finding the degree of correlation between the aggregate condition of the human habitat ecosystems in Anhui Province and each indicator.
Entropy Weights – TOPSIS
The entropy weight-TOPSIS approach is applied in this study to carry out a thorough evaluation of the condition of human habitat ecosystem in Anhui province. This method is a comprehensive evaluation method integrating the TOPSIS method and the entropy value method, with the objectivity of the entropy value method as well as the characteristics of the TOPSIS method of arranging the indicators according to the degree of superiority or inferiority. The weights and relative proximity of the indicators for the evaluation of the state of the human ecosystem will be calculated using SPSSAU. The research steps are presented below:
Each indicator is separated into positive aspect and negative aspect, and the positive (negative) direction indicates the positive (negative) influence of the indicator on the human ecological environment. The greater the degree of the positive indicator or the smaller the price of the negative indicator, the better the situation of the human habitat ecosystem in Anhui. Positive and negative indicators are standardised in a dimensionless way to make the indicators comparable to each other, and the values of the processed indicators are in the range of [0,1], and the standardised calculation method is as follows:
Positive indicators:
Negative indicators:
In the formula, Yij represents the standard value of indicator j in year with name i; Xij represents the initial value of indicator j in year with name i; Xmax and Xmin are the maximum and minimum price of indicator j, separately.
Determine the weight of each assessment indicator using the more objective entropy method:
In the formula, represents the information entropy of each indicator, and the weight (Wj) of various indicators is calculated based on Ej; Wj is the weights of indicators ranked in item j; and n is the number of years of assessment.
In the formula:
(5) In the formula, the Euclidean distances
The maximum price is
In the formula: the value of is in the limitations of [0, 1], and the larger the value, the more excellent the ecological status of human settlements in the research area.
Grey Relation Analysis
Grey Relational Analysis (GRA) is based on how similar or distinct the trends of the elements are to one another; this degree is the “grey correlation”. It is used as a method to assess the strength of the connection between the variables.
(1) Identification of reference sequence reflecting the behavioural characteristics of the system and comparative sequence that influence system behaviour.
Let its comparison sequence be
Let its reference sequence be 1. The column of data consisting of the reference sequence is the following column of formulas:
(2) Processing of reference and comparison series without dimensions
Owing to the various physical significance of the factors in the evaluation system, the resulting data may (although not always) have the same dimension, which is difficult to cross-reference, or it is challenging to get the right decision when comparing. For this reason, the data are commonly processed without dimension.
Based on the size of the correlation degree, the correlation coefficients are ranked, summed and the average value is found, which represents how closely the reference series and comparative series are correlated.
In the above formula, can be expressed as the resolution factor; is the minimal difference between the two scales; and is the maximum of difference between the two scales.
Construction of Evaluation Index System
This investigate establishes an indicator setup based on the PESTEL pattern, which is further known as investigation of the larger environment. It is developed from the PEST model, which American academics Johnson. G. and Scholes. K. presented in 1999, which is an extremely effective instrument for analysing the macro-environment and a method for examining how external factors affect an organization. Each letter stands for a different element, which can be categorised into 6 factors. The research team adapted the model to 5 factors, taking into account the actual situation of the study region and the study population; these are politics, economy, society, technology, and environment. A total of 33 evaluation indicators were selected based on these five dimensions. Through the top-down multilevel method, the indicator system (Table 1), which contains a three-tier system. Goal, guideline, and indicator layers are constructed clearly and unambiguously. The model can reflect the pulling effect between the various factors and contribute to analyse the influencing factors of the habitat ecological environment.
Political factors (PO): refers to the political forces and relevant policies that have impact on the present and the future on the human ecological environment, such as government policies, foreign trade policies, tax policies and other factors. A total of six positive indicators are set up: local fiscal expenditure on preservation of environment (PO1), local financial expenditure on agriculture, forestry, and water affairs (PO2), the value of completed investment in the treatment of industrial pollution (PO3), local financial expenditure on general public services (PO4), the completion of investment in treatment of wastewater projects (PO5), and the completion of investment in treatment of waste gas projects (PO6) to reflect the impact of the human habitat ecological environment. Among them, PO1, PO2, PO3, PO5 and PO6 reflect the status of policy support for management and protecting of the human habitat ecosystem in Anhui Province; P4 reflects the status of legal and service support for the human habitat ecological environment in Anhui Province.
Economic factors (EC): describes the economic system, industrial design, availability of resources, and degree of economic development, that drive the development of the human habitat ecosystem, and is progressive from policy factors. The study reflects the influence brought by the growth of regional economic and social development on the ecosystems of the study area from six indicators. They are the primary sector VAT (EC6), the Secondary sector VAT (EC1) the Tertiary VAT (EC2), the tax revenue of the local finances (EC3), the disposable income per capita of all the inhabitants (EC4), and the per capita GDP of the region (EC5), which, EC6 will constrain the government’s financial assistance for the eco-construction of human settlements, and EC4 and EC5 can reflect the level of the economic growth of the cities and districts in the province of Anhui.
Social factors (SO): refers to factors such as national demographics, population employment patterns, and living standards. The pressure on the habitat and ecological environment is expressed through 2 inverse indicators: urban population density (SO3) and urban registered unemployment rate (SO5). SO3 reflects the density of population activities and the ecological security bearing; the higher the population density index, the more powerful the interference of the population in urban life, representing the social pressure in the area of study. SO5 reflects the percentage of the actual number of unemployed people among the number of people who can participate in the social labour in a certain period of time; the larger the proportion, the higher the pressure on the labour and social security departments. In addition, there are five positive indicators: water, environment, and public facilities management industry urban units of employment (SO1), animal husbandry, forestry, and agriculture and fisheries urban units of employment (SO4), public management, social security, and social organisations urban units of employment (SO6), reflecting the scale of the management of services and technical support for the human ecological environment. The per capita water resources (SO2) and park and green space area per capita (SO7) reflect the abundance of socially accessible water resources and green spaces in the study area.
Table 1.
Comprehensive Evaluation Indicator System for Habitat Ecosystems
Technical factors (TE): directly impact on the improvement and progression of habitat ecosystems, referring to technological innovation, conserving energy and reducing emissions. The study selects the total amount of wastewater discharge (TE1), the main pollutant emissions in exhaust gas (TE2), the daily treatment capacity of urban sewage (TE3), the rate of harmless treatment of domestic rubbish (TE4), the total area of afforestation (TE5), the area of road sweeping and cleaning (TE6), and the amount of domestic rubbish removal (TE7) to construct the indicators of technological factors in terms of the treatment of pollutants and the protection of the environment. Among them, three positive indicators (TE3, TE4, and TE7), and two negative indicators (TE1 and TE2) reflect the pollutant treatment capacity. TE5 and TE6 reflect the efficiency of prevention and the preservation of the natural environment, the treatment capacity, and the cost of pollution treatment invested.
Environmental factors (EN): refers to ecological impacts, elements that interact with the environment, such as weather conditions, pollution, natural disasters, etc., which can reflect the ecological carrying capability of the research area as of this point. Among them, the total water resources (EN5), urban green space area (EN7), and forest area (EN6) can reflect the level of ecological health and sustainable development in Anhui Province. In addition, the four negative indicators, namely, the area affected by floods, geological disasters, and typhoons (EN1), the area affected by wind and hailstorms (EN2), the population affected by natural disasters (EN3), and the number of forest fires (EN4), reflect the extent to which ecosystems are threatened or damaged, which negatively affects the ecological environment of human settlements.
Results and Discussion
Longitudinal Comparison of Anhui Province
Using the entropy weight-TOPSIS methodology and SPSSAU software, a comprehensive evaluation of the condition of the human habitat ecosystem in Anhui Province was computed. The computational data is displayed in (Table 2), from 2012 to 2021, the quality score of the human habitat ecosystems increased from 0.228 to 0.636. The relative stickiness of Anhui Province from 2012 to 2021 were 0.228, 0.327, 0.296, 0.337, 0.466, 0.451, 0.494, 0.613, 0.629, and 0.636. The Greater value for relative closeness is, the more excellent the performance of the evaluation object. On the contrary, the smaller the values of relative proximity is, the worse the performance of the evaluation object. Therefore, based on the order of the the performance of the evaluation object’s size in Anhui Province annually, it can be obtained that the ecological environment index in 2021 is the highest, followed by 2020, and the third position is 2019. Accordingly, it shows that over the past three years, Anhui Province has had the greatest human ecological environment index. Among them, 2013- 2014 showed a slight decline. In terms of indicators, the positive indicators: the value of completed investment in industrial pollution control (PO3), general public service expenditures of local finance (PO4), completed investment in wastewater treatment projects (PO6), and the total area of afforestation (TE5) have declined. There was also a brief decline in 2016-2017, with indicators showing a decline in the value of investment completed in industrial pollution control (PO3), investment completed in projects to treat wastewater (PO5), and water resources per capita (SO2). The main reason is that the decline in financial support under the economic slowdown has led to a weakening of investment in environmental governance, and the lack of investment in industrial pollution control around the world has had a detrimental effect on the ecological and social environment. Among them, 2013-2014 showed a slight decline. In terms of indicators, the beneficial indicators: the numerical value of completed investment in industrial pollution control (PO3), general public service expenditures of local finance (PO4), completed investment in wastewater treatment projects (PO6) and the total area of afforestation (TE5) have declined. There was also a brief decline in 2016-2017, with indicators showing a decline in the value of investment completed in industrial pollution control (PO3), investment completed in projects to treat wastewater (PO5), and water resources per capita (SO2). According to the 2012-2022 data, China’s GDP growth rate (annual per cent) declined from 7.9 to 3. This shows that the slowdown in the nation’s economic growth has led to a reduction in financial support, and therefore weakened investment in environmental governance, and the lack of investment in the treatment of industrial pollution across the country has had a negative impact.
Overall, the quality of the human being habitat ecosystems shows an upward trend under small fluctuations. This is mainly due to the fact that since 2012, China has implemented a number of key ecological policies in the area of habitat ecology. Major measures for ecological forestry construction, such as the overall promotion programme for the construction of the Yangtze Golden Waterway in “12th Five-Year Plan” and the Comprehensive Plan for the Yangtze River Basin (2012-2030), have been introduced one after another. Investment in industrial environmental maintenance and pollution prevention increased relatively, and the area of afforestation, the area of nature reserves, and the number of natural forests increased significantly. Natural disasters and the affected population declined significantly.
The results of the evaluation of year-to-year alters HEEI index in the province of Anhui show that the overall distribution pattern of the HEEI index has improved over time. This has relation to economic progressive performance and environmental management of Anhui Province. Anhui Province’s per capita GDP, local financial environmental protection expenditure, and forest and green space area have been increasing over time, while negative indicators such as the number of natural disasters and industrial waste discharge have been decreasing. It can be seen that in the time dimension, the state of the natural human habitat ecosystems has been on an upward trend over time. Horizontal Comparison of Regions in Anhui Province
Table 2.
Relative proximity of human habitat ecological environment quality in Anhui Province, 2012-2021
In order to improve data precision and availability, 2012, 2017 and 2021 were selected as representative years to analyse the evolutionary trend of the suitability of ecosystems for human habitation in Anhui Province, China. Combined with the entropy weight-TOPSIS outcome, the grey correlation coefficient of each region in Anhui Province in 2012, 2017 and 2021 was calculated (Fig.3). Through a software called ArcGIS, the relative proximity index of human habitat ecological environment in Anhui Province was split into five grades, and the profile of grades for each region’s evaluation in Anhui Province in 2012, 2017 and 2021 was drawn (Fig.4). It can be seen that the quality of human habitat ecosystems as a whole presents the horizontal spatial distribution. It is characterised by “high in the south and centre, low in the north”. Most cities in Anhui have improved, but there are differences in the development of each region. Huangshan City, Hefei City and Maanshan City have higher ecological quality of human habitat as a whole. Fuyang City, Huainan City, Tongling City and Chizhou City have gradually increased in ecological environment index. Suzhou City, Huaibei City and Haozhou City have been in the low rank, facing the highlighted issues of a shortage of total ecological resources, low quality, and increased management pressure. Consequently, Anhui Province can be divided into three parts: the south, the centre and the north for discussion:
Firstly, the overall ecological level of the southern regions of Anhui Province has been steadily increasing. Among them, Huangshan, Maanshan and Tongling have consistently maintained a high level of ecological quality. The forest area and urban green space index of these three cities are on the high side, and among them, Huangshan City which is rich in humanistic landscapes and is the centre of culture and tourism in Anhui Province, has a long history, has a temperate climate, and has sufficient rainfall, so the natural environmental conditions are relatively good. As industrial cities, Maanshan City and Tongling City have a high index of value of investment completed in industrial pollution control, investment in wastewater treatment projects completed, and completed investment in exhaust gas control projects. Thus, it demonstrates that based on the advantages of their rich forest resources, industrial Pollution Control and the construction of “no-waste cities” have led to the concentration of high-quality cities in the southern part of Anhui Province.
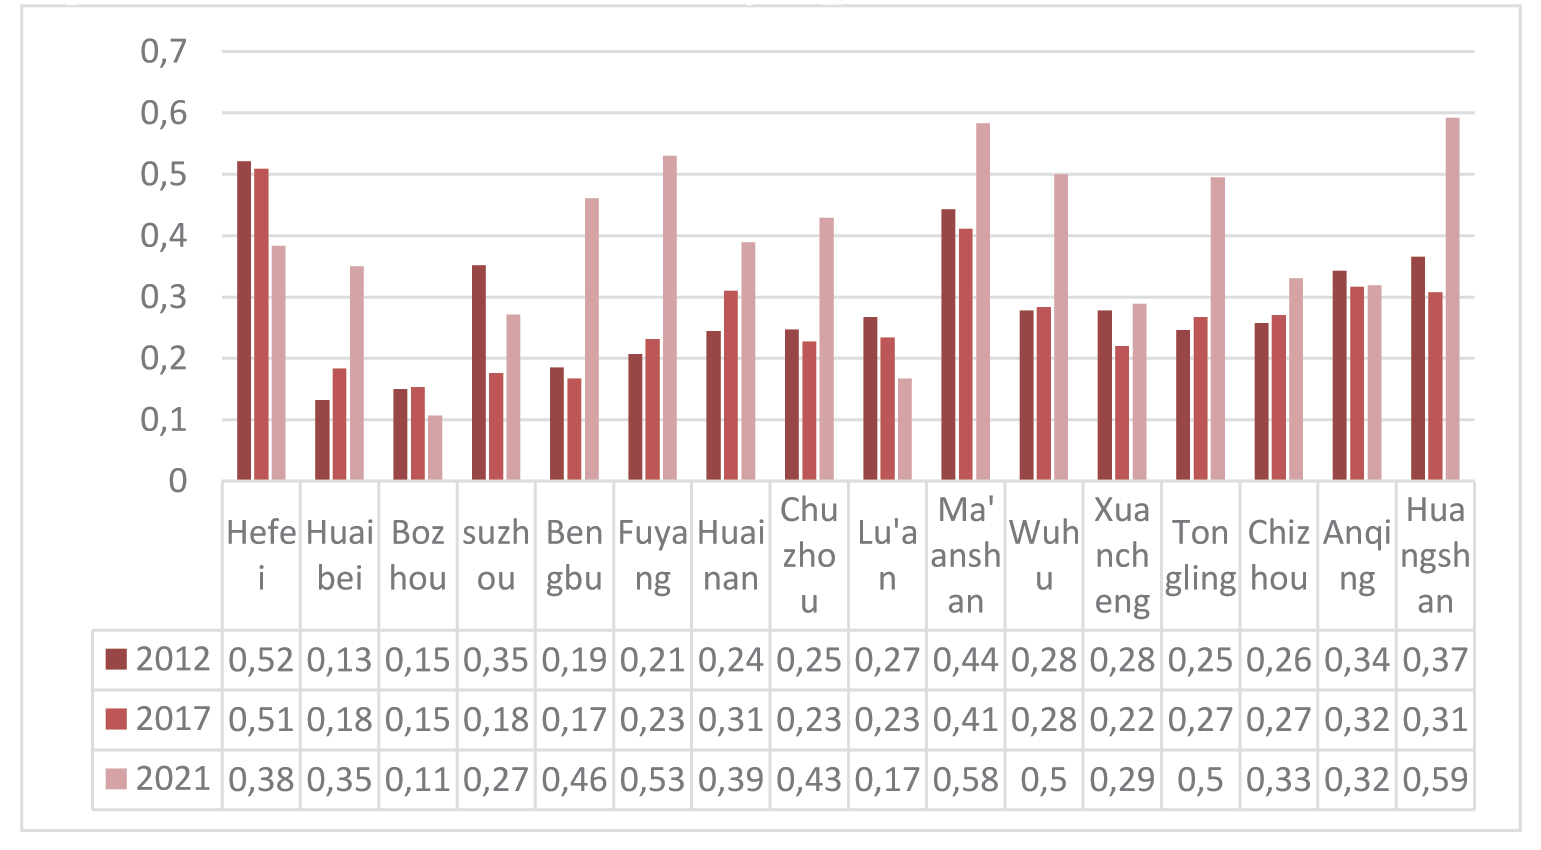
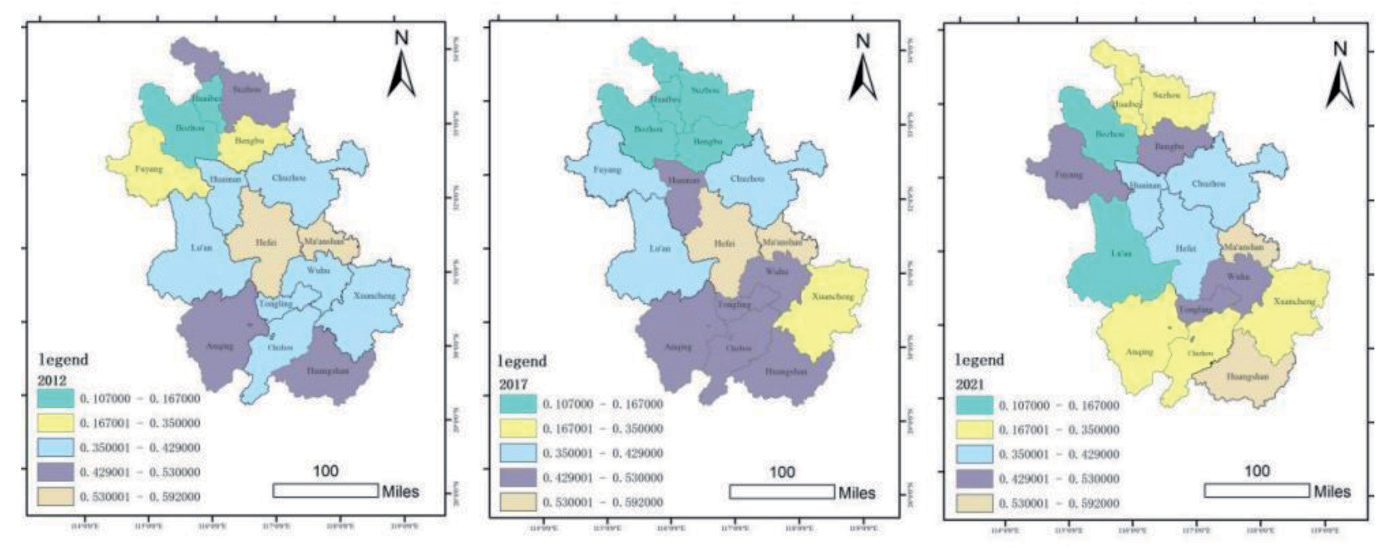
Secondly, among the cities in central Anhui, including Hefei, Lu’an and Chuzhou, only Hefei has a higher overall quality of ecological environment, with the highest GDP per capita, primary, secondary, and tertiary value-added indices. As the capital city of the province, Hefei is faced with the problems of high population pressure and insufficient resources per capita, but based on the advantages of high human intervention and its economic resources, Hefei has formed a productive partnership between the local economy and outside environmental protection that is both harmonic and stable. Lu’an and Chuzhou are at a disadvantage in terms of ecological economy and should concentrate on coordinating environmental conservation and economic growth.
Finally, the cities in northern Anhui Province, except for Huainan, are overall in a low rank, with low overall economic dimension (EC) and environmental dimension (EN) indices. This is mainly due to the complex climatic conditions in northern Anhui, with many low lakes and depressions that are prone to flooding, which lasts for a long time and causes heavy disasters, and the fact that cities such as Suzhou and Huaibei are far away from the economic centre and lack the radiation driven by large cities. According to the characteristics of the cities themselves, the internal spatial structure of the towns should be optimised, the green covering area of the built-up areas should be increased, the management of natural resources should be significantly ramped up, and the resources of woodland and green space should be effectively supplemented, so as to improve the environmental quality of the dwelling area of the residents. Overall, the relative proximity of the regions in Anhui Province indicates that there are some degrees of differences in the suitability of ecosystems for human habitation among the cities in Anhui, China. These differences reveal the importance of habitat ecological management and the urgent need to take appropriate measures to improve low-index areas and promote their high-quality development.
Relative Comparison of Different Indicators
Regional Total Grey Correlation Analysis in Anhui Province
Due to the large number of correlations, the combined data of 33 indicators for 2012-2021 were selected to rank the correlation values (Table 3). The next five indicators were TE1 (0.688), EN1 (0.695), EN4 (0.699), EN7 (0.710) and EC6 (0.710), indicating that these five indicators have a relatively small effects of less on the level of the human habitat and ecosystem in Anhui Province. The top five indicators and grey scale correlation are in the following order:PO5 (0.746) > TE2 (0.739) > PO3 (0.737) > SO4 (0.736) > EN2 (0.725). Among them, the completed investment in the project of treating wastewater (PO5) has the most remarkable effects on the condition of the human habitat ecosystems in Anhui Province. Followed by the main pollutant emissions in waste gas (TE2), and industrial pollution management completed investment value (SO4), so investment channels should be broadened, urban pollutant management planning should be incorporated into the relevant planning, the development of relevant technical policies and standards. In addition, urban unit employment of fishing, forestry, animal husbandry, and agriculture(SO4) and the area affected by wind and hail disasters (EN2) are also the main indicators affecting the ecological environment of Anhui’s human settlements. The results show that mobilising the enthusiasm of employed people in urban units of agriculture, forestry, animal husbandry and fishery, constructing a fair income distribution system, and improving the precision of the prevention and control of wind and hail disasters can make a positive influence on the human habitat ecosystems.
Table 3.
Overall grey correlation of indicators in Anhui Province
Grey Correlation Analysis of Annual Indicators in Anhui Province
In the grey correlation ranking of the indicators from 2012-2021 (Figure 5), the first ranked indicator for two consecutive years is the number of forest fires (EN4), the first time in first place in 2015 and the second time in 2016, with corresponding grey correlations of 0.97 and 0.838. The value of completed investment in industrial pollution control (PO3) in 2021, the main pollutants in exhaust gas emissions (TE2) in 2020, water resources per capita (SO2) in 2019, natural disaster-affected population (EN3) in 2018, flood, geological disaster and typhoon affected area (EN1) in 2017, wind and hail disaster-affected area (EN2) in 2014, added value of tertiary industry (EC2) in 2013, and total afforestation area (TE5) in 2012 ranked first, respectively.
Among the top five indicators in 2012-2021, the tertiary VAT (EC2) and the local financial expenditure on environmental protection (PO1) appear most frequently, five times each, in 2012, 2013, 2014, 2015 and 2016. This shows that before 2016, the investment in the tertiary industry and environmental protection was an important guarantee and driving force for the ecological quality of the human habitat in Anhui, so the government should also urge the localities to strengthen the investment of financial funds, and guide the localities to use the funds reasonably, and to improve the accuracy and efficiency of the allocation of funds. The number of forest fires (EN4) has appeared four times, ranking in the top five in 2015, 2016, 2018, and 2019, with grey correlations of 0.97, 0.838, 0.853, and 0.912, respectively. It shows that lowering the number of forest fires has a positive effect on the human habitat ecosystems of Anhui, and that Anhui province has a large forested area, and that the cities should effectively do all the emergency disposal of heavy and large forest fires, and correctly deal with emergency affairs caused by forest fires. Natural disaster-affected population (EN3) appeared four times consecutively in 2017, 2018, 2019, and 2020, and is a key indicator hindering the improvement of human habitat and ecological level in Anhui, with grey correlations of 0.894, 0.925, 0.97, and 0.841, respectively. Cities need to strengthen the infrastructure construction, scientific early warning, and improve people’s awareness of safety and self-rescue ability. Total wastewater discharge (TE1) appears consecutively in 2017, 2018 and 2019, with a grey correlation of 0.801, 0.883 and 0.952, respectively, and is one of the main indicators. Improved treatment facilities should be established, regulation and enforcement should be strengthened, water-saving production methods should be promoted, and technological research and development and innovation should be enhanced. In terms of the top five, high impact indicators over the years, there is a certain difference in the main impact indicators before and after 2016, shifting from EC2 and PO1 to EN4 and EN3, which indicates that with the continuous development of the economy, equal emphasis should be placed on the construction of ecological civilisation and the maintenance of ecological and economic balance.
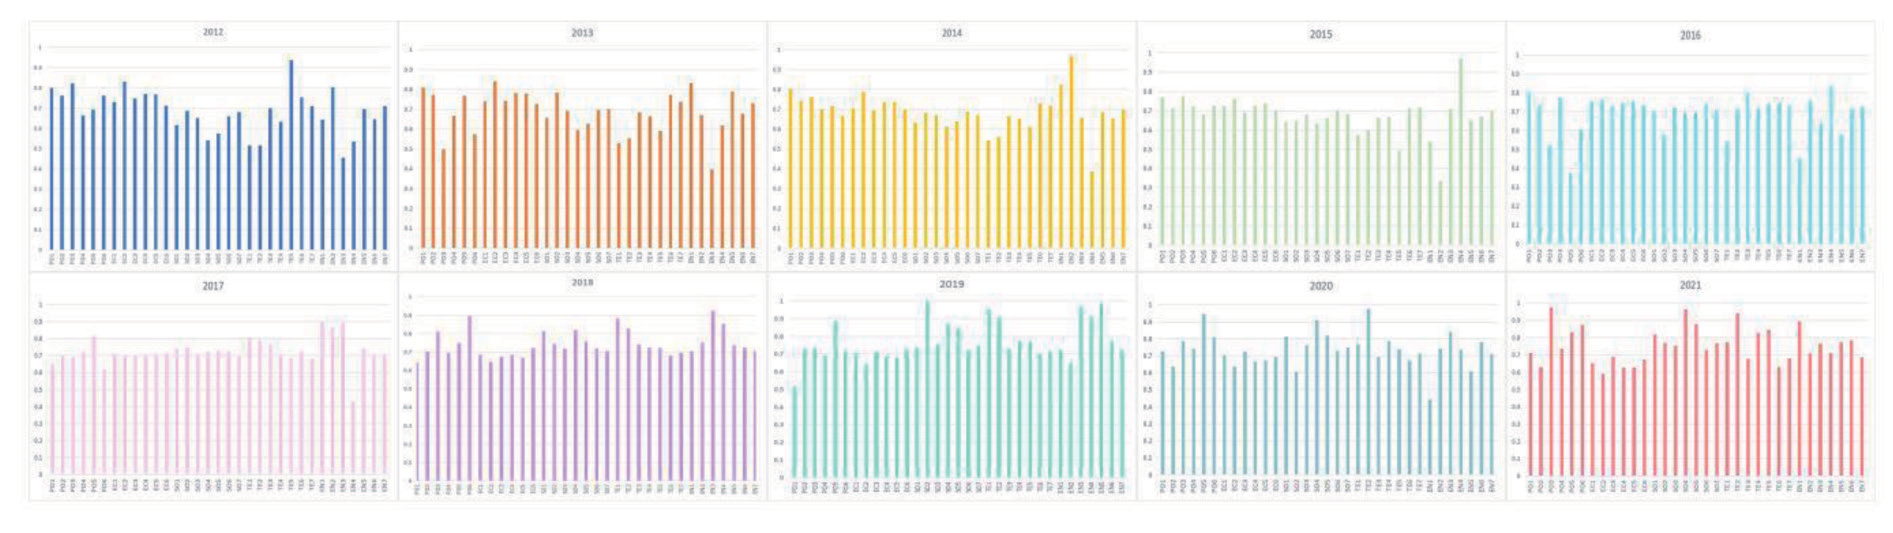
Among the indicators that ranked in the bottom five respectively from 2012 to 2021, total wastewater emissions (TE1) ranked in the bottom five for five consecutive years (2012-2016), with grey correlations of 0.517, 0.529, 0.543, 0.573, 0.541, respectively. followed by emissions of major pollutants in the wastewater gas (TE2) ranked in the bottom five for four consecutive years(2012-2015), with grey correlations of 0.515, 0.553, 0.561, and 0.597, with low correlation with the level of human ecology. Finally, the number of forest fires (EN4) appeared in the bottom five in years 12, 14 and 17, with grey correlations of 0.534, 0.387 and 0.435, respectively. Combined with the previous data, it illustrates that the influence of the two indicators, TE1 and EN4, on the quality of the Habitat ecosystem has evolved from a feeble to a powerful one since 2017.
Fig.5 .Grey correlation coefficient of indicators in Anhui Province, 2012-2021.
Conclusion
This research uses the province of Anhui as its study object, constructs a comprehensive evaluation index system scientifically based on the PESTEL model, measures and evaluates the quality of the human habitat ecological environment in Anhui by using multivariate statistical methods, such as entropy weight, TOPSIS, and grey correlation analysis, and explores its vertical time dimensional and horizontal space dimensional evolution and development characteristics. The findings of the study are divided into three points:
(1) On vertical comparison, the relative closeness rises from 0.228 to 0.636 during the period of 2012- 2021, indicating that the condition of the human habitat ecosystem in Anhui Province as a whole improves significantly and shows a rise under small fluctuations. Among them, 2019, 2020 and 2021 show a continuous and stable rise, and the best performance in ten years. The data of all indicators are steadily rising. indicating that the condition of human habitat ecosystem has significantly improved in the past three years, and the effect of protection and governance is remarkable, which can inform future high-quality growth of the human habitat ecological environment. The short decline in 2014 and 2017 indicates that attention should be paid to the coordinated increase
of the economy, and the strength of the investment in pollution need to remain stable. Overall, the habitat ecological environment index in Anhui Province has been improving over time. It is therefore important to continue to improve the regional environment, steer the economy towards sustainable development and continually strengthen the ecological civilisation of Anhui Province.
(2) In terms of horizontal comparison, the overall quality of the human habitat and ecological environment in Anhui Province has improved significantly, but there are large differences among cities. The overall spatial distribution is characterised by “high in the centre, high in the south-east and low in the north”; there are divergences in the quality of the human ecological environment among cities, which indicates the need to adopt targeted policies and measures to adjust and improve the specific situation. First, for the southern region of Anhui, the cities in southern Anhui represented by Huangshan City and Maanshan City, the habitat ecological index has always remained above 0.22, and the overall ecological environment is good. The share of the tertiary sector is clearly high., tourism and agriculture are well developed, forest coverage and water availability per capita are relatively high, and both low-carbon, urban, and ecosystem development are relatively good. Chizhou City, Xuancheng City, and Anqing City should build a co-operation mechanism to protect natural ecological resources. Secondly, Hefei City in central Anhui Province, the quality of human ecological environment is significantly higher than other cities. Lu’an and Chuzhou to improve the space, the ecological and economic aspects of its disadvantage, it needs to increase the capital investment in environmental protection, and pay close attention to how environmental conservation and economic growth are coordinated. Thirdly, for the northern Anhui region, such as Bozhou and Huaibei, where the ecological status of human settlements is lagging behind, the economic dimension (EC) and the environmental dimension (EN) index are the major indicators affecting the condition of the human habitat ecosystem. Therefore, special support from the central financial authorities should be sought to enhance the carrying capacity of infrastructure in northern Anhui, encourage the modernization and restructuring of historic industries, control pollution in important river basins, and carry out projects such as returning ploughland to wetlands, restoring natural vegetation, and protecting and restoring wetlands.
(3) On the relative comparison of different indicators, the completed investment in wastewater treatment projects (PO5), the emission of major pollutants in exhaust gases (TE2), the value of the completed investment in industrial pollution treatment (SO4), the total amount of wastewater discharged (TE1), the amount of people in employment in units of urban area of the agriculture, forestry, animal husbandry
and fishery industry (SO4) and the area affected
by wind and hailstorms (EN2) are the principal
indicators affecting the ecological environment of the
human habitat in Anhui. Therefore, in the economic,
technological and social dimensions, the government
should promote high-level preservation of the natural
environment and excellent economic growth, as well
as employment for the people concerned. In terms of
policy, it should initiate reforms in emissions trading,
promote project governance, focus on environmental
protection industries and strengthen the integration of
infrastructure, public services, ecological protection,
and industrial development projects.
In the face of the trend of vertical and horizontal evolution of the habitat ecological environment, all regions of Anhui Province should increase their efforts to manage the habitat ecological environment. As a result of changes in the overall quality of the habitat ecological environment in Anhui Province and the role of regional proximity, agglomeration and regional differences in the habitat ecological environment are unavoidable. However, based on the above results, targeted adjustments and improvements can be made to the more influential indicators and areas with lower overall ecological levels to promote the coordinated development of regional habitat ecosystems.

