Introduction
Water-fractured sandstone is a common phenomenon in China, which is most likely resultant of the origins of the water supply, mineral exploitation, water conservation activities, hydropower construction, urban and industrial projects, road construction, and the daily life activities of human beings. In particular, sandstone aquifers pose a water inrush threat to coal seams [1, 2]. For instance, the coal seams in coal mines that are found in the sandstone strata in cities or provinces in East China face the risk of water inrush from sandstone aquifers. Thus, the control and management of water inrush from sandstone aquifers should be taken into account for the safety of the mine workers. Water from sandstone aquifers, which is an important source of groundwater, can be used as a water supply for the urban population. The spatial and temporal variations of the characteristics of water from sandstone aquifers and the management of water in underground mining areas are important factors to be considered in order to better develop and utilize such water and facilitate environmental improvements in water management measures [3-5].
In 1975, international research on leached groundwater began to develop vigorously, which focused on the spatial-temporal evolution of groundwater hydrochemistry [6-8]. In recent years, the spatial-temporal evolution of groundwater has been a popular topic and widely studied, and studies have focused on the dynamic groundwater resources, groundwater hydrochemistry, and the quality of groundwater. Here, we focus on the chemical composition of groundwater, which is influenced by the long-term effects of human activities and natural effects [9-11]. Gourdol et al. [12] proposed a new statistical method called Partial Triadic Analysis to characterize the spatial and temporal variations of the hydrochemistry of groundwater due to natural causes and human activities. Descriptive statistics of the spatial and temporal changes of the hydrochemical characteristics of groundwater are usually applied through two means: the use of ratios of major ions and piper diagrams [13, 14]. The principal component analysis is a common multivariable analysis method that can be used to verify the principal chemical factors [15-17].
The evaluation of water quality is not only an important component of research work on the water environment, but also an important basic task for environmental risk analyses, ensuring water environmental protection, and controlling pollution. Water quality is a generic term to denote the amount of physical, chemical, bacterial, and other harmful substances in groundwater [18-20]. Horton [21] was the first to propose an index number system to evaluate water quality. Today, the quality of groundwater has become a global concern due to its effects on all life forms and the environment [18]. Sheikhy Narany et al. [22] used a geostatistical analysis to evaluate the spatial and temporal variations in the quality of groundwater. The above studies have identified the main factors affecting groundwater pollution and found that different natural processes and human activities are the main sources that contribute to the salinity as well as hardness and microbial contamination of the groundwater. Masoud et al. [23] examined the spatial-temporal trends and factors of change in groundwater quality by studying the temporal and spatial variations of pollutants that originate from the degradation of organic matter, whether they are from peat deposits in natural aquifers or due to improper protection of wellheads from contamination in urban areas or through agricultural drainage in areas with low relief topography.
Geographic information systems (GIS), which collect, access, integrate, process, analyze, and display all kinds of characteristic information and carry out spatial analysis, have been widely used to characterize and assess the spatial-temporal changes in groundwater quality [24, 25]. Machiwal et al. [26] analyzed the spatial-temporal changes in the parameters of groundwater quality by using a GIS-based index. However, there is limited research work to determine spatial-temporal trends by monitoring groundwater quality, and even if so, it is a challenging task because the meteorological, hydrological, and anthropological effects on groundwater can be isolated or coupled, and these effects have different intensities. At the same time, it is also a very significant work to judge the spatial-temporal evolution of groundwater quality in the whole region.
Therefore, spatial statistical interpolation and multivariate statistical analysis based on GIS are carried out in this study to extract the spatial and temporal variations of the characteristics of water from sandstone aquifers, including the hydrochemistry and quality in an underground mine area. Moreover, the factors that contribute to the variations are analyzed. The objectives of this research are to therefore:
(1) analyze the spatial and temporal changes of the hydrochemistry of sandstone aquifers in an underground mine called the Chensilou coal mine in Henan Province, China, from 2001 to 2016, and (2) quantitatively evaluate the quality of groundwater with a GIS. This study is expected to provide the theoretical basis for exploring the relationship between the quality of water in sandstone aquifers and mining activities and finding a hydrological balance in the mining area.
Method
The multi-criteria decision-making (MCDM) method was used to confirm the optimal water quality index for evaluating the quality of water in the sandstone aquifers of the Chensilou coal mine. The weighted linear combination was used as an analysis method [27] and therefore used as the decision model to generate composite maps in a GIS [28, 29]. The maximum deviation approach was used to compute the weight vectors.
(1) Building a decision matrix (DM) for water quality
A DM A = (aij)nm, which includes the primary criteria that control the water quality, was constructed in accordance with the GBT14848-93: National Standard of the People’s Republic of China: Quality Standard for Groundwater, in which aij is the ith value of the jth criteria and m and n are the rows and columns of the DM, respectively. Meanwhile, the GIS layer of the main criteria was built by applying the kriging method in ArcGIS, which is mapping software.
(2) Normalizing the GIS layer and DM
Usually, some of the criteria in MCDM have clear proportional relations with the evaluated objects, which are known as benefit type criteria. The other criteria are called cost type criteria. Different types of evaluation criteria will have different dimensional units. Therefore, this will have effects on the data analysis results. To remove the influences of dimension between different indexes, normalizing the data is necessary to allow comparability of different criteria. After the data are normalized, they can then be used for careful decisions. Consequently, each criteria value aij undergoes normalization, and normalization on thematic maps is implemented with the use of the following formulas below:
where A1 is the positive type of evaluation criteria and A2 is the negative type of evaluation criteria. Subsequently, a normalized matrix for water quality R = (rij)nm and thematic maps for decision-making with no dimensions are created.
(3) Establishment of weight vectors based on variance
Variance is the most important and commonly used index to measure the degree of variability of data. It is generally believed that if there is no discrepancy in the indicators of each level of the evaluated object, the criteria are irrelevant to the ranking of the different levels of the evaluated object in MCDM. For the factor uj, σij (w) represents the deviation between the discrepancy levels of the evaluated object xi and all the discrepancy levels of the evaluated object:
The weight vector w is obtained, and the total deviation of all the discrepancy ranked levels of the evaluated object with respect to all the criteria is maximized. Next, the objective function is:
The optimization model below is used to derive the weight vector w:
A Lagrange function is constructed to solve Equation (5):
Solving partial derivative:
from which we have:
Then, the λ and wi can be obtained:
(4) Water quality index of sandstone aquifers based on ordered weight average operator
Ordered weighted averaging (OWA) generalizes and extends the weighted linear combination method [30-32] and has now been extended to GIS applications. The OWA family uses two sets of weights, which are criteria of importance and order. When an ordered weight average operator is used, the set of criterion importance weights is defined as: V={v1, v2, …, vi}and the set of order weights is: W={w1, w2, …, wj; 0≤wn≤1,
n and ∑ v j = 1 }. The set of attribute values is defined
i=1 as: A = {ai1, ai2, …, ain}, where ain is at the ith site of n criterion maps set denoted by using raster:
The attribute values ai1, ai2, …, ain are reordered by ranking weights in ascending order, and then the sequence zi1, zi2, …, zin is obtained. The criterion weight vn is not affected by the attribute value ain; however, vn is related to the certain ordered position of an aggregated value. When the reordered weights determined by the attribute value are combined with a set of order weights, then aggregation by the ordered weight average operator is realized.
The Boolean overlay operations of intersection (AND) and union (OR) are included in OWA in GIS applications, which are the two extremes that are used to describe the minimum and maximum operators; that is, the circumstances in which every criterion is satisfied and only one criterion is satisfied, respectively (Table 1).
The degree of ORness and trade-off can be used to describe the ordered weight average operator behaviors. The order weights determine the level of trade-off among the criteria. The continuous aggregation procedure is affected by changes in the order weights. Then, ORness can be defined as:
where n denotes the number of criteria, wk denotes the weight of the criterion in the kth order, and k denotes the order of the criteria. The degree of similarity between the ordered weight average and AND is determined by the ANDness, and that between the ordered weight average and OR is determined by the ORness. Compensation is measured by the level of TRADE-OFF, which is determined by the degree of the dispersion of the weights. Then, the water quality index of the sandstone aquifers (SWQI) can be defined as:
where wj is the criterion weight, vj is the order weight, zi1≤zi2≤…≤zin is the sequence obtained by reordering the weighted attribute values ai1.
Case Study
Hydrogeological Background
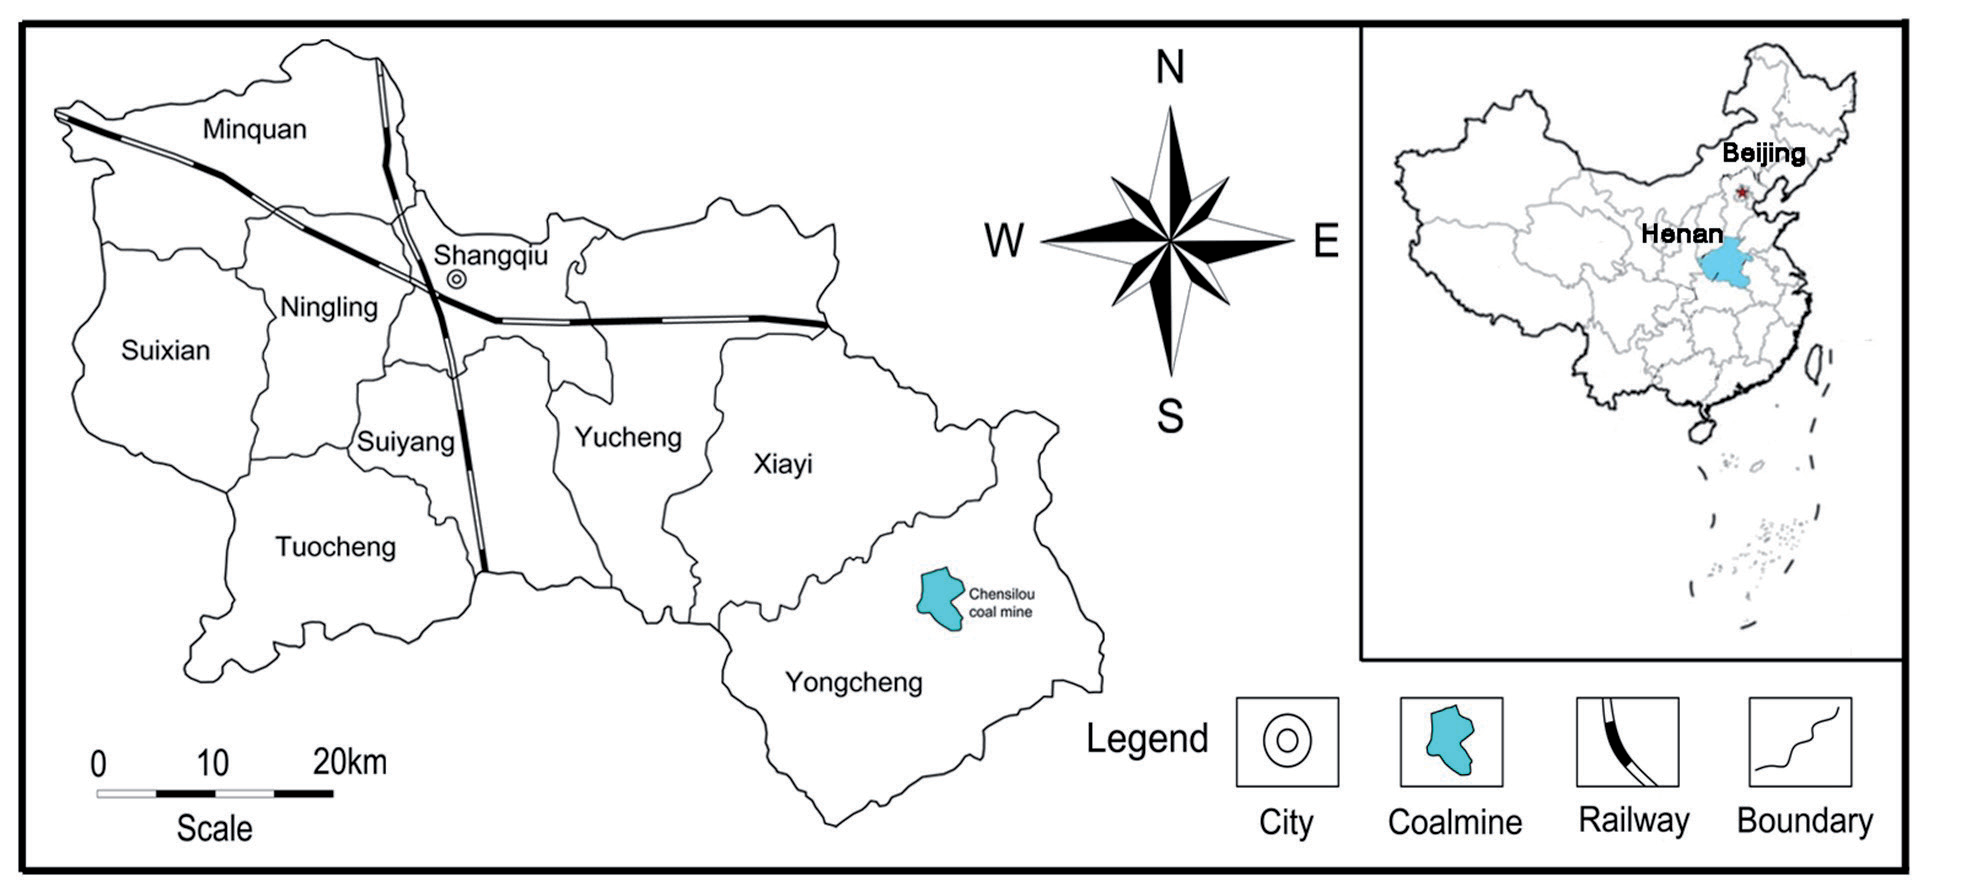
The Chensilou coalmine is in the Chensilou county, which is 10 km north of Yongcheng city in Henan, a province in China (Fig. 1). The study area is a well-sealed, independent hydrogeological unit. Due to the closed independence of hydrogeological units and the loss of normal hydraulic connection with regional aquifers, the possibility of regional groundwater recharge is reduced. The distribution and burial conditions of deep water are related to ancient topography, the landforms, and the subsidence of tectonic movement. The fractured water in the sandstone is directly recharged by precipitation, diving, and surface water in the exposed area. In the cover area, the bottom loose pore pressure water may supply groundwater along the wind oxidation zone or the later coal mining subsidence zone, and the long-term drainage of the production mine is the main discharge channel of the fractured water. The fractured water of sandstone is covered by the cover layer, and the groundwater is in a closed environment. In the natural state, the dynamic changes are not great, and the water level decline is mainly affected by the drainage of the production mine. The geological structure in the studied area is a monocline that strikes north-north-west (NNW) with a slight dip to the south-west-west (SWW). The geological structure of the deposits that run E-W and N-S is significantly different. In the former, the faults dominate the geological structure, and in the latter, the folds are dominant while the faults are secondary. A single horizontal coal seam in the north and south zones was mined by longwall caving with a longwall retreat system.
Table 1.
Typical linguistic quantifying operators corresponding to operator factors.
| Quantifier operator | At least one | Few | Some | Half | Many | Most | All |
|---|---|---|---|---|---|---|---|
| A | 0.0001 | 0.1 | 0.5 | 1 | 2 | 10 | 1000 |
| OWA weight (vj) | v1 = 1, vj = 0 | a | a | vj=1/n | a | a | vn = 1, vj = 0 |
| ORness | 1 | a | a | 0.5 | a | a | 0 |
| Tradeoff | 0 | a | a | 1 | a | a | 0 |
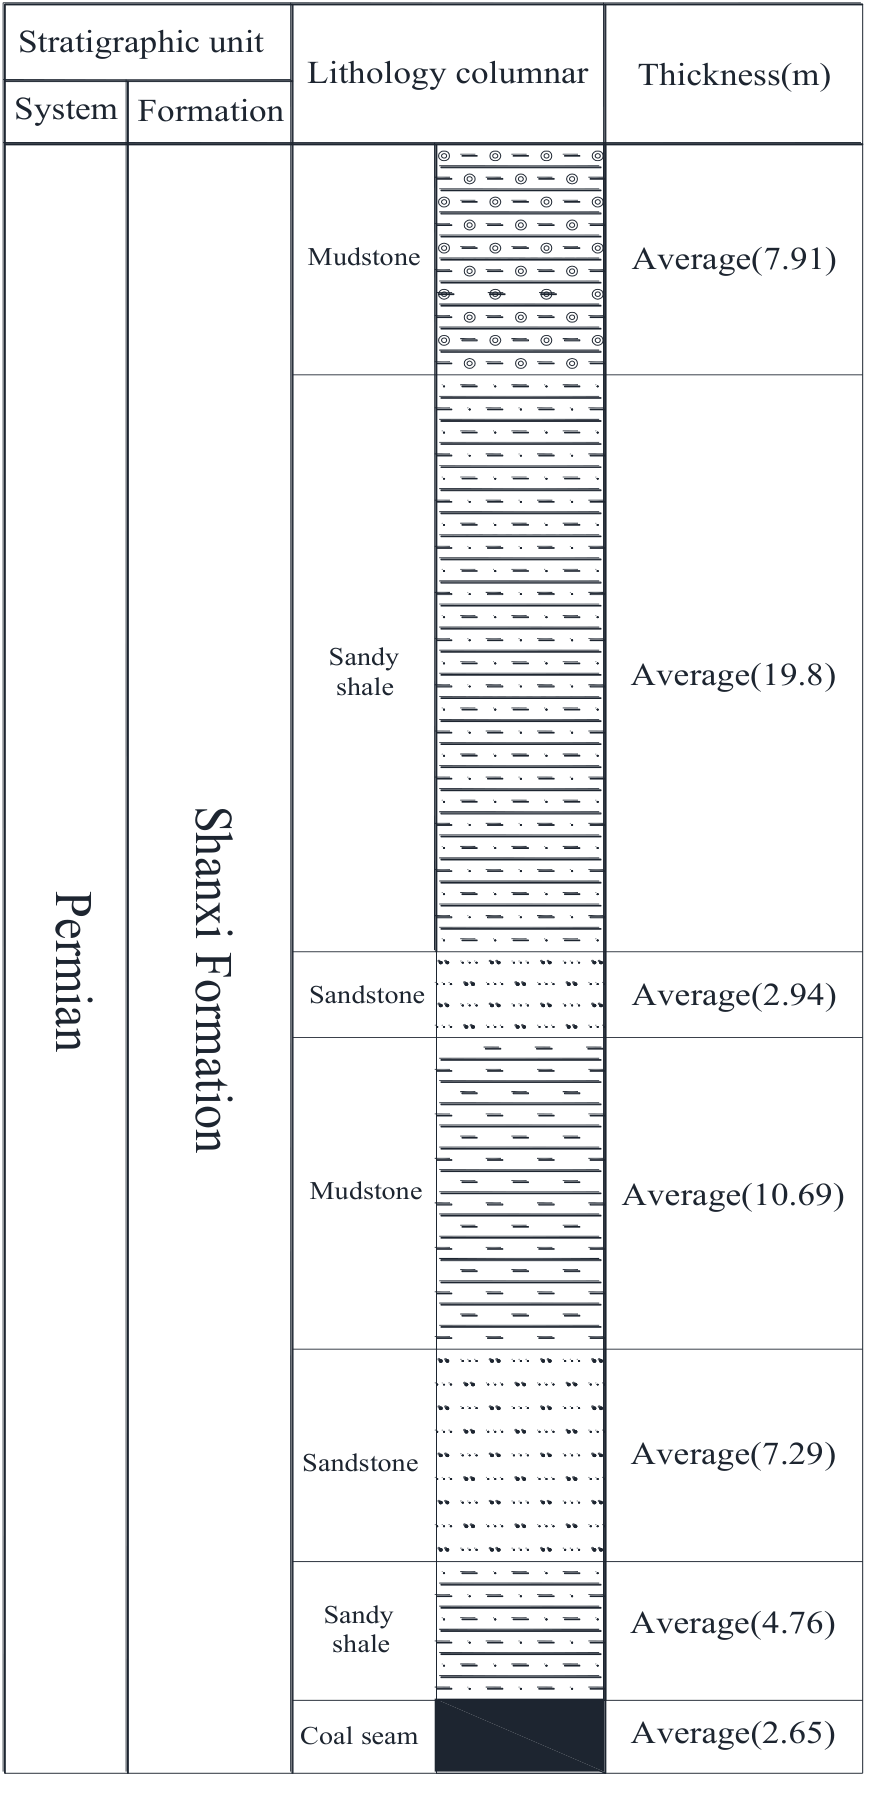
Three sandstone aquifers are found above Coal Seam Ⅱ2: the upper Shihezi, lower Shihezi, and Shanxi aquifers (Fig. 2). The Shanxi aquifer flows directly into the coal mine. Fractures in the sandstone have not yet developed. Before mining, both recharge and discharge predominantly occur in the lateral horizontal direction.
Groundwater Sampling
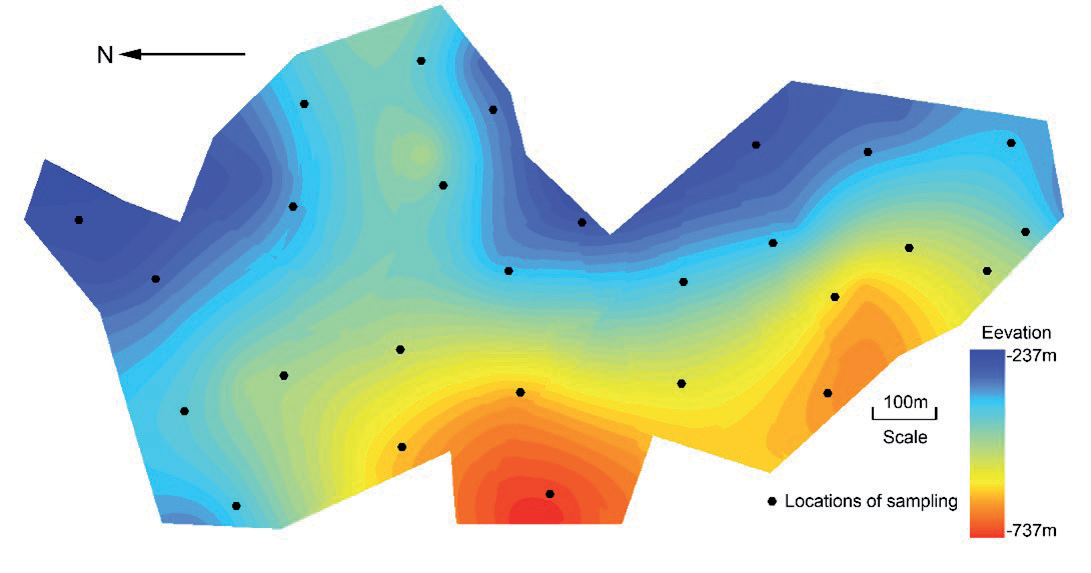
The groundwater samples were collected from panels or through drilled boreholes for hydrological monitoring two to three times in February or April and December of 2001, 2006, 2011, and 2016 to carry out hydrochemistry analyses. Ninety-eight groundwater samples were collected in total. The geographical location of each sample was recorded and pinpointed on a GIS map as shown in Fig. 3. A standard laboratory procedure was used to analyze the hydrochemical concentration of the collected groundwater samples. The amount of anions and cations were examined, including potassium (K+), sodium (Na+), calcium (Ca2+), magnesium (Mg2+), chloride (Cl-), sulfate (SO42-), bicarbonate (HCO3-), carbonate (CO32-), iron II (Fe2+), iron III (Fe3+), ammonium (NH4+), nitronium (NO2-), and nitrate (NO3-) ions, and the total dissolved solids, total hardness, and pH were also tested in the laboratory.
Results and Discussion
Real dynamic monitored data are used in this study, in which the characteristics of the groundwater environment in the studied area are taken into consideration. Nine indicators are used as the criteria to assess the water quality in the sandstone aquifers: Na+, Ca2+, Mg2+, Cl-, SO42-, HCO3-, total hardness, pH, and total dissolved solids. Na+, Ca2+, Mg2+, Cl-, SO42- , and HCO3- are the most common chemical elements in groundwater. The total hardness refers to the concentration of total calcium and magnesium ions in water, the pH value is the meaning of the pH of water, and the total dissolved solids refer to the total amount of solid matter that can be dissolved in water. These indicators are interrelated to reflect the chemical characteristics and potential impacts of water quality. The tradeoff range is 0 to 1. A value of 0 indicates that there is no tradeoff between standards, whereas a value of 1 means that there is a complete compromise. In other words, this measure is the degree of the dispersion of the weights of the OWA. In the weighted linear combination model, the average decision risks a = 1, so that, for example, the weight coefficient has an appropriate evaluation result from the change in weight, which will meet the needs of the decision-makers (Table 2).
First, the factor that is used to assess the water quality in sandstone aquifers is normalized in accordance with Eq (1). Then the map of each factor that affects the water quality is obtained by using GIS as shown in Figs. 4, 5, 6, and 7.
The distribution map of the water quality index of the sandstone aquifers for 2001, 2006, 2011, and 2016 is drawn with ArcGIS based on the ordered weight average operator, as shown in Figs. 8a1, 8a2, 8a3, and 8a4, respectively. The water quality is categorized into five different levels in accordance with the water quality index of the sandstone aquifers and natural breaks method [33], which clusters data into different arrangements with reference to the natural breaks found in the data, as shown in Table 3.
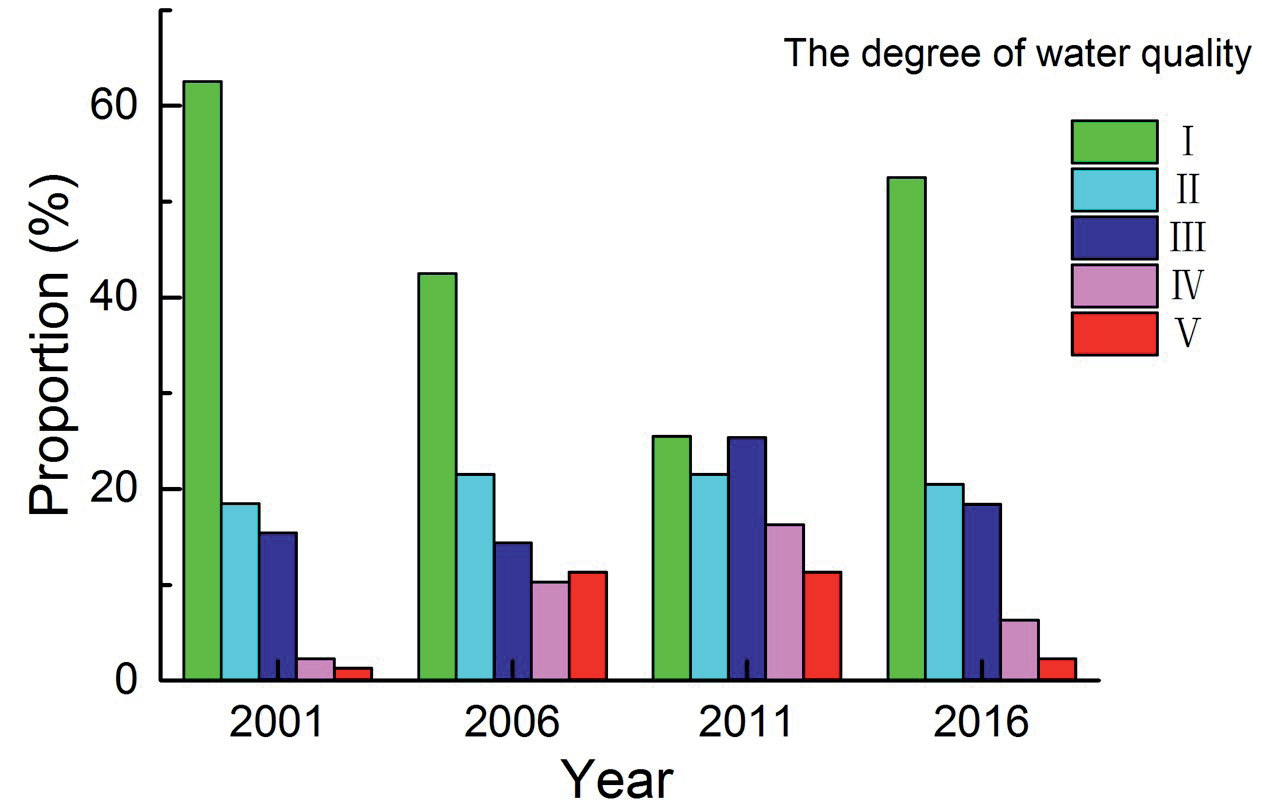
The chemical changes in the water from the sandstone aquifers in the studied area in 2001 are basically consistent with the changes in the hydrochemistry of the natural water. The fourteen years from 2002 to 2016 are known as the “golden decade” of coal production, in which the industry was booming. In 2006, the chemical composition of the water changed, in which there was an increase in Ca2+, Mg2+, Cl-, SO42-. and pH. The increase in the concentrations of Ca2+, Mg2+, and Cl- in the water is presumed to be the dissolution of sulfate and stone salt, while the increase in the concentration of SO42- is presumed to be caused by the accelerated oxidation of pyrite caused by human mining. In the process of mining, in order to ensure the smooth progress of the project, artificial grouting is needed, and alkaline substances formed after the hydration reaction of the grouting material cement will cause the pH value of groundwater to rise. The influence of the natural environment was greatly reduced, and the ecological environment changed due to a large amount of human-induced activities such as manufacturing, mining, and construction of infrastructure, which produced different types of pollutants, as evidenced by the changes in total dissolved solids. Then there was also the direct impact of such human-induced activities on the chemical composition of the water due to the changes in the large-scale exploitation of the hydrodynamic system, as well as groundwater recharge, runoff, and discharge.
Table 2.
Illustrative example of OWAi.
Fig. 4.
Flowchart and map of each criterion of water quality in sandstone aquifers in 2001. (a1) Na+; (a2) Ca2+; (a3) Mg2+; (b1) Cl-; (b2) SO4 2-; (b3) HCO3 -; (c1) Total hardness; (c2) pH; (c3) Total dissolved solids.
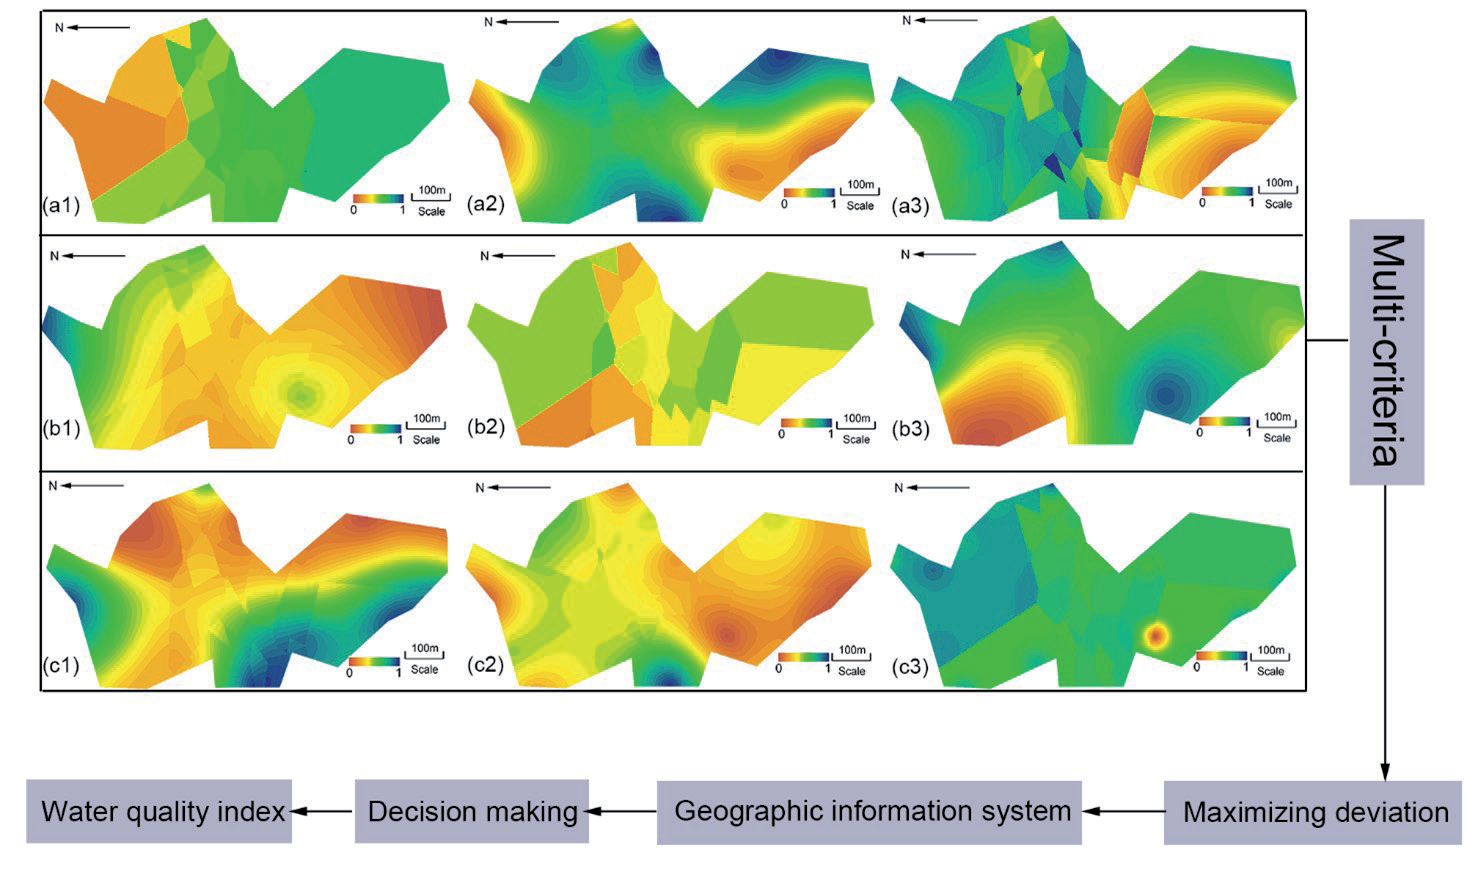
Fig. 5.
Flowchart and map of each criterion of water quality in sandstone aquifers in 2006. (a1) Na+; (a2) Ca2+; (a3) Mg2+; (b1) Cl-; (b2) SO4 2-; (b3) HCO3 -; (c1) Total hardness; (c2) pH; (c3) Total dissolved solids.
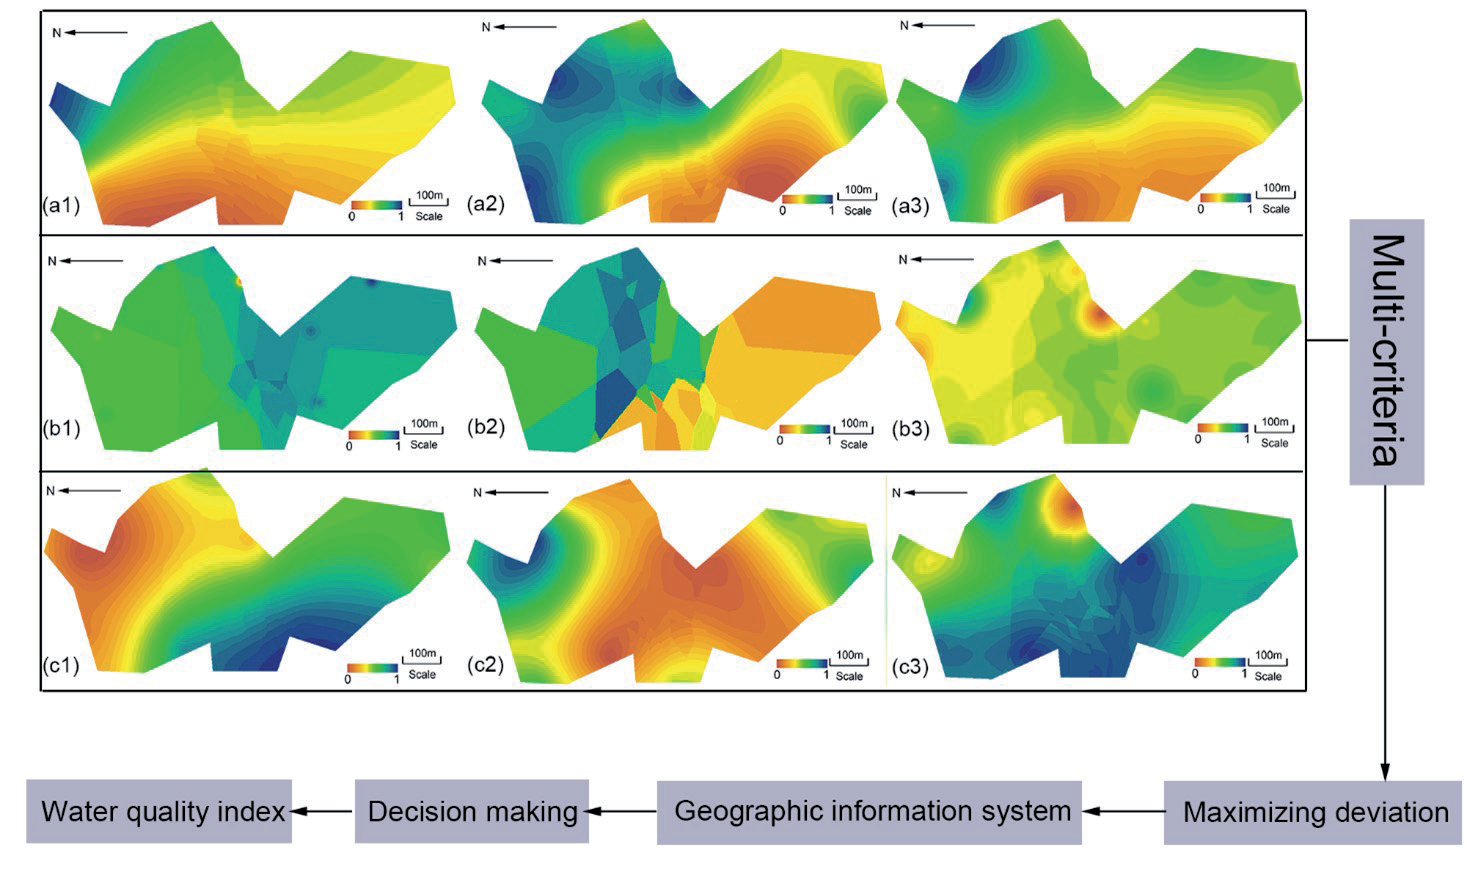
Fig. 6.
Flowchart and map of each criterion of water quality in sandstone aquifers in 2011. (a1) Na+; (a2) Ca2+; (a3) Mg2+; (b1) Cl-; (b2) SO4 2-; (b3) HCO3 -; (c1) Total hardness; (c2) pH; (c3) Total dissolved solids.
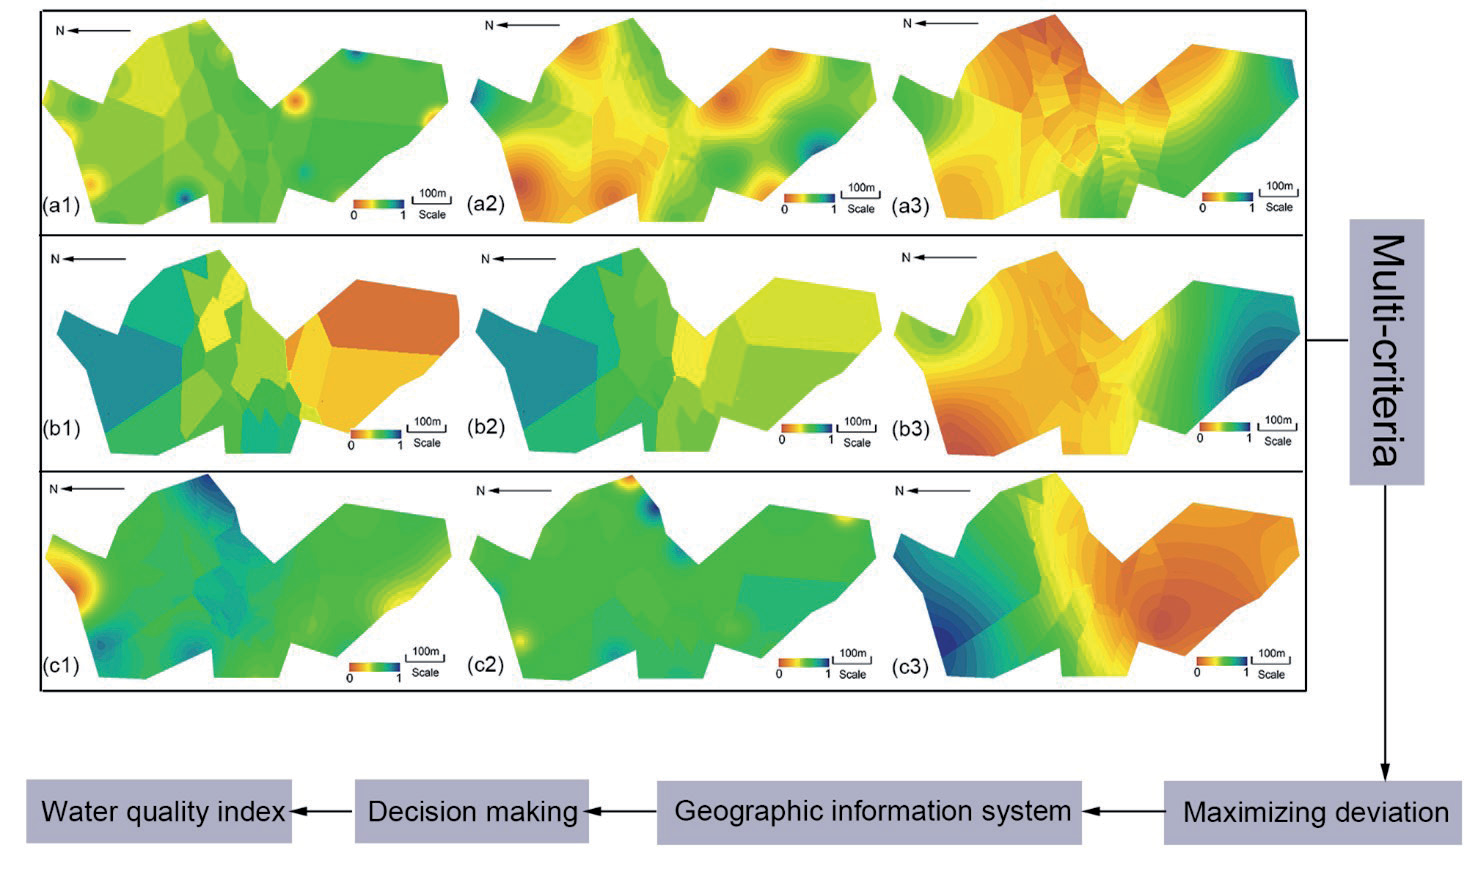
Fig. 7.
Flowchart and map of each criterion of water quality in sandstone aquifers in 2016. (a1) Na+; (a2) Ca2+; (a3) Mg2+; (b1) Cl-; (b2) SO4 2-; (b3) HCO3 -; (c1) Total hardness; (c2) pH; (c3) Total dissolved solids.
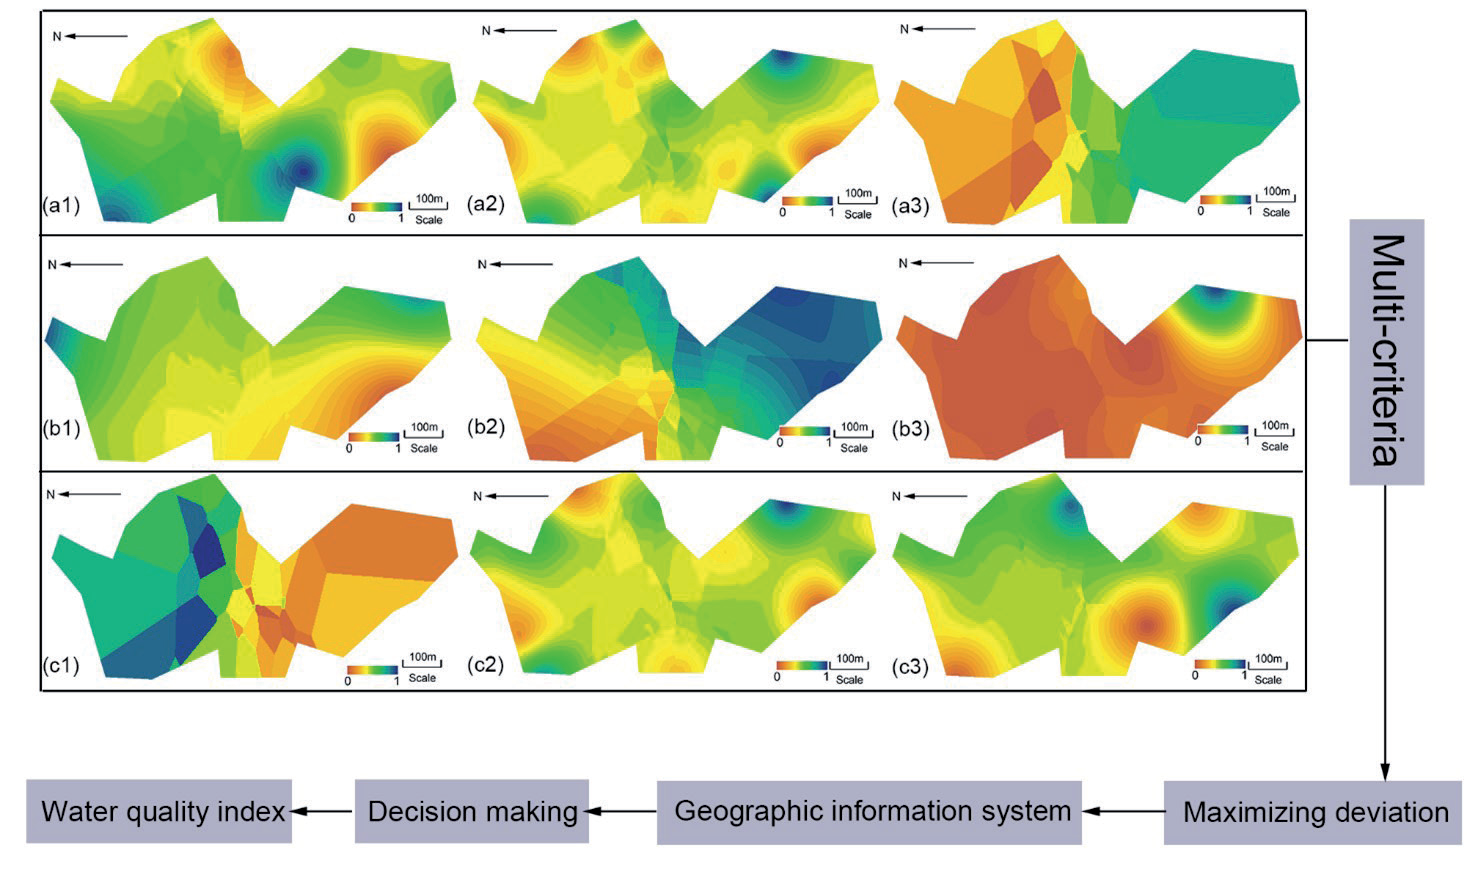
Fig. 8.
Water quality index of sandstone aquifers for 2001, 2006, 2011 and 2016 . (a1) 2001; (a2) 2006; (a3) 2011; and (a4) 2016.

Table 3.
Level of water quality in studied area.
| Level of water quality | Water quality index of sandstone aquifers (SWQI) |
|---|---|
| Ⅰ | SWQI>0.802 |
| Ⅱ | 0.535< SWQI ≤0.682 |
| Ⅲ | 0.352< SWQI ≤0.535 |
| Ⅳ | 0.183 < SWQI≤0.352 |
| Ⅴ | 0 < SWQI≤0.183 |
In 2011, the studied area grew in population and economy, and the effects of such growth had detrimental effects on the water. The hydrochemistry of the groundwater changed substantially. At the end of the “golden decade” of coal production, investment was made to restore the environmental balance by market economy, so that in 2016, the quality of the water in the sandstone aquifers almost reverted back to the chemical balance of natural water as shown in Fig. 9.
Conclusions
In this paper, spatial statistical interpolation and multivariate statistical analysis based on GIS are undertaken to extract the spatial and temporal variations of the characteristics of water from sandstone aquifers, including the hydrochemistry and quality in the underground mining area of Chensilou in China. A water quality index is established by using OWA and maximizing the deviation in a GIS environment. The most prosperous years of mining, otherwise known as the “golden decade” of coal production in this area, were from 2001 to 2016. In the beginning, from 2001 to 2006, there were minimal effects on the water’s hydrochemistry. However, starting in 2006, human-induced effects on the water evidently increased, with further growth in population and economy in 2011, which had detrimental effects on the water. Not only did the chemical composition change, but the hydrochemistry of the groundwater also changed greatly. However, in the end, it is also humans who made the investment to revert the water almost back to the chemical balance of natural water. The water quality evaluation based on multi-criteria decision-making and a geographic information system can better judge the spatial-temporal evolution of water quality in the mine study area. In the future, the water quality evaluation will be further enriched, and trace elements and D, 18O isotopes will be introduced into the water quality index.