

Introduction
The mining industry, a linchpin of global economic development, has been pivotal in extracting valuable minerals essential for various sectors, from construction to electronics. However, it is also a major culprit behind severe environmental degradation. Mining-related activities, such as ore extraction, beneficiation, and waste disposal, release an array of pollutants into the environment. Among these, heavy metals and hazardous chemicals are of particular concern due to their persistence, bioaccumulation potential, and toxicity [1]. Recent advances in genetic engineering, particularly the CRISPR/Cas9 system, have shown great promise in enhancing the phytoremediation capabilities of plants by introducing specific traits that improve their tolerance and uptake of heavy metals [2]. This technology could be particularly useful in the context of mining areas where heavy metal contamination is prevalent.
In China, with its vast mineral resources and extensive mining operations, the mining industry’s environmental footprint is substantial. Sichuan Province, rich in minerals, has witnessed decades of mining activities. These activities have not only shaped the local economy but also left a complex legacy of environmental pollution. Maerkang County, where this study was conducted, was home to a mineral processing plant that once played a significant role in the local mining-based economy.
The now-defunct mineral processing plant in Maerkang County was engaged in producing lithium pyroxene concentrates, tantalum niobium concentrates, and tin concentrates using the flotation method. The production process involved the use of a variety of raw materials, including explosives, lithium pyroxene, sodium carbonate, sodium hydroxide, sodium oxide soap, naphthenic soap, and sulfuric acid. Despite the plant’s closure in 2020, the long-term environmental impacts of its operations remain poorly understood.
Previous research on mining-related pollution has made significant progress in identifying contaminants and their potential risks. However, there are still critical knowledge gaps, especially regarding the long-term effects of mineral processing waste on local ecosystems and human health, particularly in areas with unique ecological and geological characteristics like Maerkang County [3]. In addition, the interactions between different contaminants in the complex matrix of mining-affected soil and water and their potential synergistic effects on the environment remain to be fully understood.
This study endeavors to fill these existing knowledge gaps by conducting a thorough and comprehensive assessment of both the soil and water quality in the proximity of the now-closed mineral processing facility located in Maerkang County. Through this investigation, the study aims to detect and pinpoint the inorganic and organic pollutants present in the area, with a particular emphasis on heavy metals and hazardous chemical substances. It also intends to quantitatively assess the degree of contamination of soil, groundwater, and surface water, providing a detailed understanding of the extent of pollution. Additionally, the study will evaluate the potential health hazards and risks that the identified contaminants pose to both humans and the environment. Finally, it will propose evidence-based, scientific recommendations for effective land management strategies and environmental remediation measures in this specific area. Gaining a comprehensive understanding of the environmental conditions at this site is not merely of great significance for the protection of the local ecological system and the safeguarding of human health, but it also serves as a valuable reference for guiding future sustainable development initiatives in other mining-impacted regions with similar characteristics.
The necessity of this study lies in addressing critical gaps in understanding the long-term environmental impacts of abandoned mining facilities, particularly in regions with unique ecological and geological contexts like Maerkang County. While previous research has focused on active mining sites or agricultural areas, few studies have systematically evaluated post-closure contamination risks in reservoir inundation zones. This work innovatively integrates multimedia assessments (soil, groundwater, surface water, and solid waste) while considering future land-use changes due to reservoir construction. By combining field surveys, advanced analytical methods, and compliance with evolving Chinese environmental standards, this study provides actionable insights for tailings management in flood-prone areas – a scenario increasingly relevant amid global climate change and hydropower expansion. These aspects distinguish our work from prior studies and emphasize its relevance to sustainable land remediation and policy-making.
Materials and Methods
Study Area
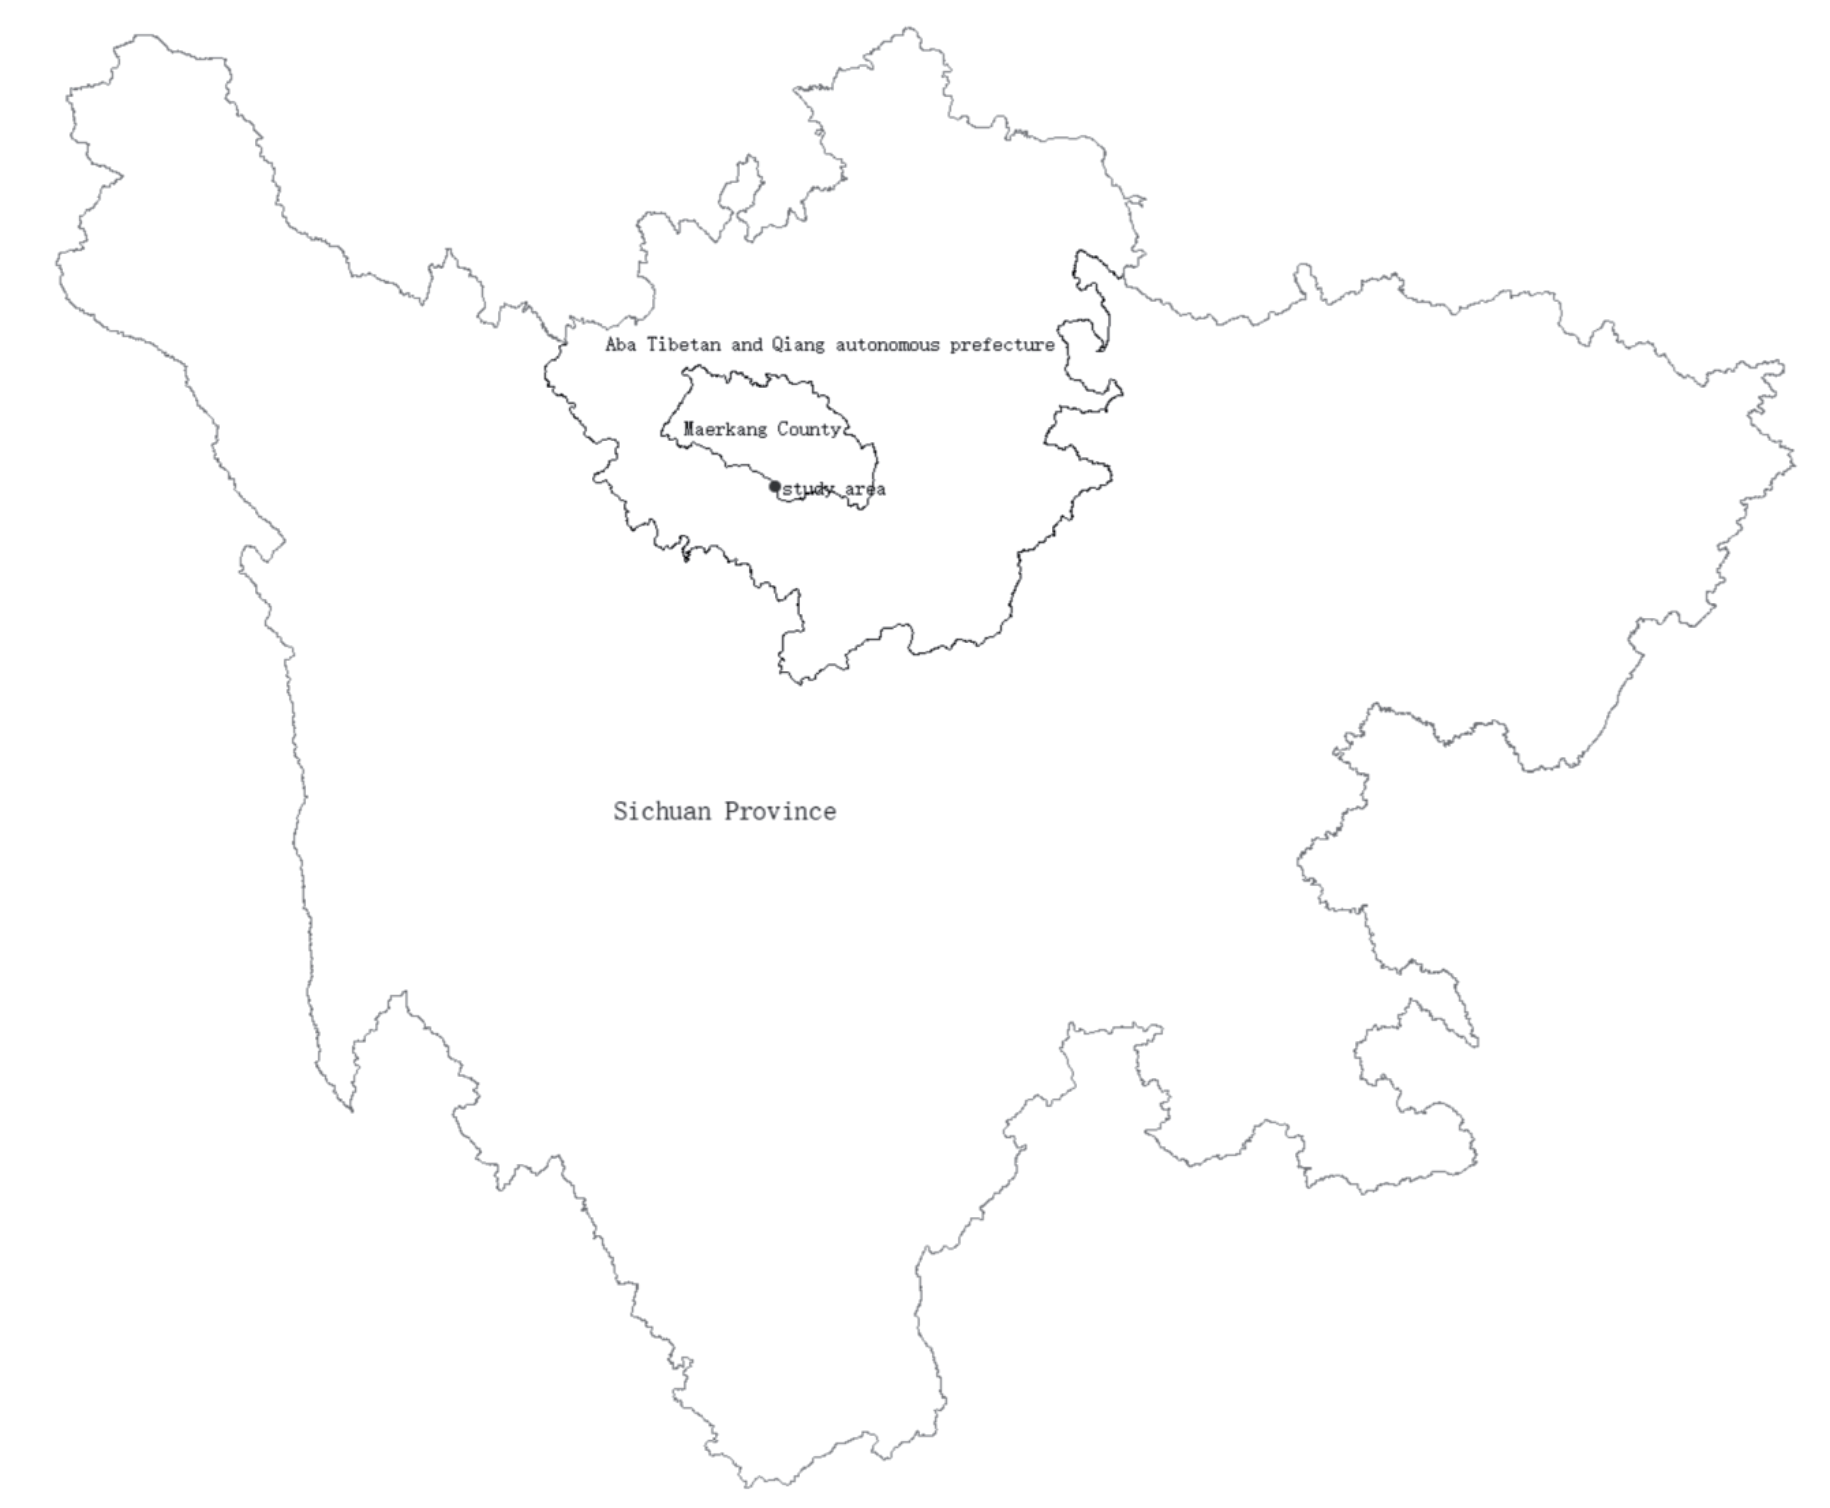
The study site, located in Maerkang County, Aba Tibetan and Qiang Autonomous Prefecture, Sichuan Province, was once a mineral processing plant site. It is located 58 km from Maerkang County and 31 km from Jinchuan County, with a longitude of 102°1′26.93″E and a latitude of 31°43′12.06″N. A map was provided to illustrate the location of the site (Fig. 1). The site covered an area of approximately 17,500 m2 and was divided by a natural surface water stream. The tailings storage area was approximately 15,000 m2 with a capacity of 370,000 m3 and currently held approximately 62,500 m3 of tailings.
Previously, the area was barren. In 2009, an ore dressing plant was established. The plant utilized a flotation method to produce lithium pyroxene concentrates, tantalum niobium concentrates, and tin concentrates. Wastewater was partially recycled after undergoing a three-stage coagulation and precipitation treatment. The raw materials used in the production process included explosives, lithium pyroxene, sodium carbonate, sodium hydroxide, sodium oxide soap, naphthenic soap, and sulfuric acid. The plant ceased operations in 2020, after which the production equipment was removed and the waste areas were cleared.
With the natural surface water stream as the dividing line, the five-stage sedimentation tank was located to the northwest, while the tailings landfill was situated to the southeast. There was no detectable odor from the tailings. The five-stage sedimentation tanks were arranged sequentially from southwest to northeast, with the first, third, and fifth stages covered by soil and vegetation and the second and fourth stages showing slag accumulation.
The tailings landfill was mostly covered by soil and vegetation. However, visible slag piles at the boundary and surface water were present. Four mining holes were located on the site. Residential areas and water bodies were the site’s most sensitive targets, with the Dajinchuan River 400-600 m away and residential areas 200-400 m to the southwest. There were no environmentally sensitive objects such as kindergartens, schools, hospitals, places of production of edible agricultural products, aquaculture areas, central drinking water sources, and nature reserves in the vicinity. According to urban planning, the site was located within a future reservoir flooding area, which was classified as water surface land for the reservoir.
Pollution Identification and Sensitive Targets
To investigate the soil pollution status, the analytical methods and testing items were selected in accordance with the Soil Environmental Quality Risk Control Standard for Soil Contamination of Development Land (GB 36600-2018) [4, 5]. These methods should also consider the production process, raw and auxiliary materials, main and auxiliary products, and the generation and disposal of the three wastes from the ore dressing plant [6]. The potential impacts of nanoparticles (NPs) on the environment and human health have been widely studied. NPs, which can be released from various industrial activities, have unique physicochemical properties that may lead to toxicological effects on living organisms [7]. In this study, we also considered the potential presence of NPs as part of the pollutants originating from the mining activities in the study area. Based on an understanding of the company’s production process, raw and auxiliary materials, products, and the site survey, the soil impact pathways and characteristic factors of the processing plant were identified. The investigation of the plot’s natural environment, historical and current conditions, as well as the surrounding environmental and geological impacts, revealed that the mineral processing plant belongs to the non-ferrous metal ore mining and processing industry. The property, which was located within the reservoir inundation area, is now vacant following the cessation of production. A site investigation revealed that the property contains a tailings pile. Information collected on the production process, raw and auxiliary materials, and further analysis revealed the use of hazardous chemicals such as sodium hydroxide and sulfuric acid. The process involves lithium pyroxene, tailings sand, lithium pyroxene concentrates, tantalum and niobium concentrates, and tin concentrates, all of which contain heavy metals. In addition, irregular piling practices and incomplete environmental protection measures were observed. In 2020, inadequate management of the tailings ponds led to environmental remediation, and the site was classified as potentially contaminated.
A mineral processing plant belongs to the non-ferrous metal mining and processing industry and uses raw and auxiliary materials such as explosives, lithium pyroxene, sodium carbonate, sodium hydroxide, sodium oxide soap, naphthenic soap, and sulfuric acid. Major products include lithium pyroxene concentrate (5% Li2O), tantalum-niobium concentrate (50% (TaNb)2O5), and tin concentrate (55% Sn). Analysis of the raw and auxiliary materials, products, and processes of the mineral processing plant, in conjunction with common site types and characteristic pollutants found in the ferrous and non-ferrous metal mining and processing industries, identified heavy metals as the primary pollutants of concern for this project. The suspected contaminated areas of the site are shown in Table 1.
Soil Sampling
The density of the soil samples was determined based on the requirements of the Technical Guidelines for the Investigation of Soil Contamination of Land for Construction (HJ 25.1-2019) [8]. At the preliminary investigation stage, a minimum of three soil sampling points are required for plots of land ≤5,000 m2, and a minimum of six sampling points are required for plots of land >5,000 m2, with the possibility of increasing the number of sampling points based on actual circumstances [9]. Based on the land use characteristics and data analysis, the production history of the enterprises and the functional layout of the site were systematically and comprehensively analyzed. The functions of the sub-districts varied throughout the site’s original use, which guided the distribution of sampling points by sub-districts. Following the principles and methods of point distribution, 12 soil sampling points were established within the site based on data collected, on-site surveys, and interviews conducted during the preliminary stage. Monitoring points were established in areas close to the suspected contamination zone. Soil drilling was performed using an engineering drilling rig, and strict protocols were followed to avoid cross-contamination during sample collection.
Fig. 2 and Table 2 show the soil sampling diagram. Samples from each layer weighed a minimum of 1.5 kg. The collected samples were sealed and stored in Ziplock bags with a sample number, date, and environmental status. All the samples were air-dried in the laboratory, stones, plant roots, and other debris were removed, and the samples were crushed with a mortar and pestle to pass through a 200 mesh sieve.
Water Sampling
Three surface water sampling points were established within the designated site. Surface water samples were taken from key locations, including the water body’s inlet, outlet, and mid-section (Table 2). The layout of the sampling points is shown in the Fig. 2. The water samples were collected in 1000 mL plastic bottles. The bottles were then properly labeled and tightly sealed. All the water samples were analyzed in the laboratory [10].
The collection of groundwater samples was conducted using hand-dug wells and boreholes, with a total of three samples being retrieved. For boreholes, the groundwater samples were fetched after pumping for 15 min to eliminate immobile water [11]. The samples were collected into clean 1-L capacity polyethylene bottles and acidified with HNO3 to a pH<2.0 to minimize adsorption and precipitation on the container wall (APHA 2005). The groundwater was found to enter the study area from the northeast and flow in a southwest direction. Therefore, an undisturbed area on the northeast side of the site was selected as the control point for groundwater sampling.
Table 1.
Table of suspected contaminated areas.
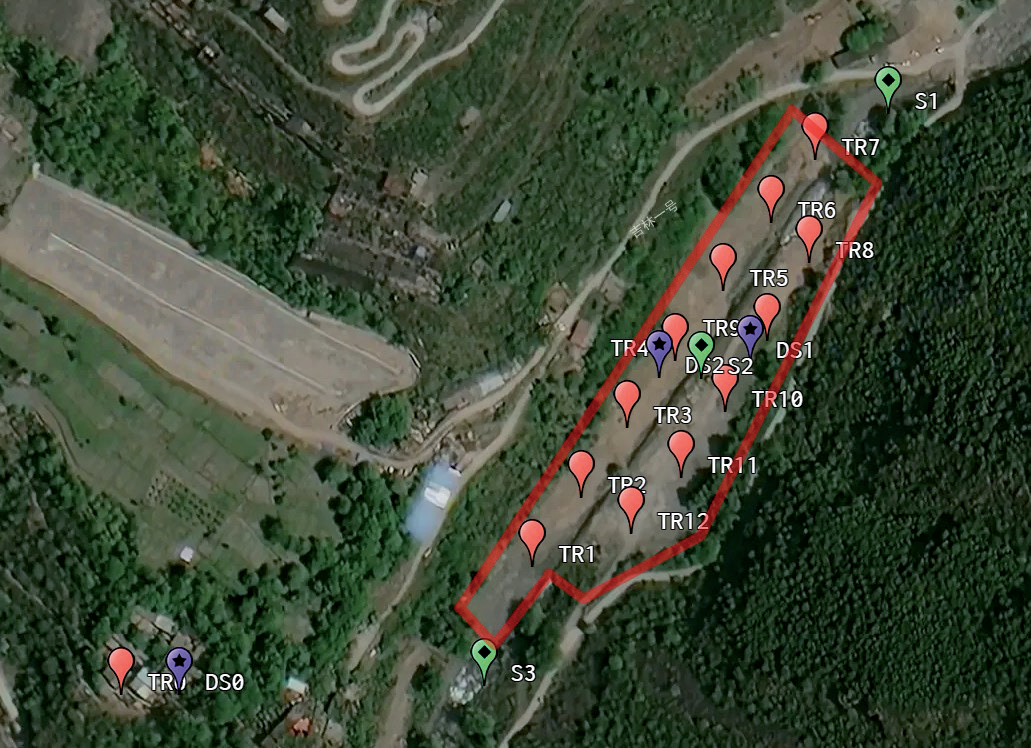
Table 2.
Sampling site information.
Solid Waste Sampling
Given that the latter part of the project falls within a reservoir inundation zone and tailings remain stockpiled at the concentrator site, three solid waste samples were collected to test the leachate from the tailings and assess their characteristics [12].
Testing Factors and Methods
A total of 42 soil monitoring indicators, including heavy metals (Cr6+, Hg, As, Pb, Cd, Cu, and Ni), 31 volatile organic compounds (VOCs), and 8 semi-volatile organic compounds (SVOCs) listed in “Soil Environmental Quality Soil Pollution Risk Control Standards for Construction Land” (GB36600-2018), were selected [5, 13]. 17 qualitative parameters, including pH value, COD(Cr), fluoride (as F-), volatilization hydroxybenzene, non-ionic ammonia, phosphates, petroleum, total cyanide, Cr6+, Hg, As, Pb, Cd, Cr, Ni, Mn, and alkylmercury listed in the “Groundwater Quality Standards” (GB/T14848-2017) [14, 15], “Environmental Quality Standards for Surface Water”, Environmental Science Press, Beijing, 2017, and “Environmental Quality Standards for Surface Water” (GB3838-2002) were used to evaluate the groundwater and surface water quality, respectively [16, 17].
A total of 12 leaching toxicity indicators for solid waste, including pH value, Cr6+, Hg, As, Pb, Cd, Cr, Ni, Zn, Ag, Be, and Benzo[a]pyrene, according to the Specification for reservoir basin cleaning designing of water resources and hydropower project (SL664-2014) and Standard for pollution control on the non-hazardous industrial solid waste storage and the landfill (GB 18599-2020), were tested to determine the nature of the solid waste and to assess compliance with the criteria for removal from the bottom of the reservoir [18, 19].
The heavy metals in soil and solid waste were analyzed by ICP-MS (inductively coupled plasma-mass spectrometer) using a Thermo Fisher Scientific iCAP Q instrument. The groundwater sample collection procedure included drying, cleaning, and sterilizing in polyethylene bottles. Samples were then labeled, sealed, and transported to the laboratory and preserved in the refrigerator at about 4°C until analysis time. Water samples were analyzed using standard methods within 48 h after sampling. The concentration of heavy metals (i.e., As, Cr, Cu, Ni, Pb, and Zn) was determined using the inductively coupled plasma mass spectrometry (ICP-MS) method.
Sodium carbonate (analytical grade, Sinopharm Chemical Reagent Co., Ltd., China), sodium hydroxide (≥ 99%, Aladdin Biochemical Technology Co., Ltd.), sulfuric acid (98%, Sigma-Aldrich), and nitric acid (HNO, ultrapure grade, Thermo Fisher Scientific) were used for sample preservation and analysis. All soil, water, and solid waste samples were analyzed in triplicate (n = 3) to ensure reproducibility. The sampling in the field followed a randomized stratified design with 12 points for soil, 3 points for surface water, 3 points for groundwater, and 3 points for solid waste.
A procedural blank, parallel experiment, and national standard soil samples (GSS-4) were used for quality control during the analytical procedure. The coefficients of determination of the calibration curves for the standard solutions were greater than 0.999, and their recoveries were between 80.0 and 110.0%. The accuracy and precision of the measurements were checked using duplicate samples. The experimental water was ultrapure water, and all reagents were guaranteed reagents. The vessels were soaked in a 10% HNO3 solution for more than 24 h, washed with ultrapure water, and dried for use.
Evaluation Standard
Given that the project site was located within the inundation zone of a reservoir, the investigation of the soil pollution status must comply with both the requirements of the Design Code for Clean-up of the Bottom of Reservoirs in Water Conservancy and Hydroelectric Engineering (SL664-2014), which specifies the soil quality standards for reservoir impoundments, and the Standard for Soil Pollution Risk Control for Soil Environmental Quality in Construction Land (GB36600-2018), which provides comprehensive guidelines for the investigation and testing of the project [5, 18].
Soil pollution was evaluated based on the second category of land use limits in GB36600-2018 [5]. Solid waste leachate was evaluated in accordance with the requirements of Design Specification for Cleaning the Bottom of Reservoirs of Water Conservancy and Hydropower Projects (SL664-2014) and Integrated Wastewater Discharge Standard (GB 8978-1996) [18, 20]. Groundwater and surface water quality were compared to Class III standards in GB/T 14848-2017 and GB3838-2002, respectively [15, 17].
Results and Discussion
Soil Contamination Assessment
Heavy metals, volatile organic compounds (VOCs), and semi-volatile organic compounds (SVOCs) concentrations of soil samples from the studied area are presented in Table 3. The results showed that samples contain the following metals with the average measured concentrations: Cd (0.52 mg/kg), Cr6+ (1.8 mg/kg), Hg (0.064 mg/kg), Ni (26 mg/kg), Cu (31 mg/kg), As (7.75 mg/kg), and Pb (19.3 mg/kg). VOCs and SVOCs were not detected in the soil samples. It was shown that none of the soil samples analyzed in this study exceeded the screening value for Class II land use as specified in the Soil Environmental Quality Construction Land Use Soil Pollution Risk Control Standard (GB36600-2018).
Table 3.
Soil sample testing result (mg/kg).
This study comprehensively analyzed the soil surrounding a defunct mineral processing plant in Maerkang County, Sichuan Province, aiming to assess heavy metal contamination levels and health risks. The results indicated that the concentrations of heavy metals, volatile organic compounds (VOCs), and semi-volatile organic compounds (SVOCs) in soil and groundwater did not exceed the relevant national standards, suggesting a low immediate risk to human health from these aspects. This finding is consistent with some previous studies. For example, Hu et al. found that although there was a certain accumulation of heavy metals in some agricultural soils around a lead-zinc mining area, it did not exceed the risk threshold [21]. However, the absence of VOCs/SVOCs contrasts with Liang et al. [9], who reported significant organic pollutants in landfills, suggesting differences in waste composition and remediation practices. Due to differences in geological conditions, mining techniques, and waste disposal methods among different mining areas, the pollution situations vary significantly.
Groundwater Quality Analysis
As demonstrated in Table 4, the elemental concentrations of Cr6+, Hg, As, Pb, Cd, Cr, Ni, and Mn, and the pH value, COD(Cr), fluoride, volatilization hydroxybenzene, non-ionic ammonia, phosphates, petroleum, total cyanide, and alkylmercury were measured in the underground water samples. The average concentrations of Cr6+, Ni, and Mn, COD(Cr), fluoride, non-ionic ammonia, phosphates, and petroleum measured in these samples were 1.7×10⁻⁴, 2.0×10⁻³, 3.64×10⁻³, 6.7, 0.18, 0.01, 0.10, and 0.01 mg/L, respectively. The average pH value of the groundwater samples was 7.3. Other indicators tested in these groundwater samples were undetected. The results of the analysis of all groundwater samples in this study demonstrated that they did not exceed the Class III standard limits for groundwater quality indicators, as specified in the Groundwater Quality Standard (GB/T 14848-2017).
Surface Water Quality Analysis
The mean concentrations of Cr6+, Ni, Mn, COD(Cr), fluoride, non-ionic ammonia, and petroleum measured in surface water samples were 2.0×10⁻⁴, 6.4×10⁻⁴, 1.66×10⁻³, 9.67, 0.18, 0.032, and 0.02 mg/L, respectively (Table 5). The pH value of the groundwater samples was found to be 7.3 on average. The concentration levels of other indicators were below the limit of detection (LoD) in all surface water samples. In this study, the analysis of all surface water samples revealed that they were all within Class III standard limits for basic elements, as specified in the Environmental Quality Standards for Surface Water (GB3838-2002). Therefore, this project’s environmental risks associated with groundwater and surface water were low, and the risk to human health was considered negligible.
All the tested indicators for surface water met the Class III standards, indicating good surface water quality and relatively low environmental risks. This might be attributed to the surrounding area’s relatively favorable natural ecological environment, which plays a certain role in purifying the surface water. Nevertheless, this does not mean that potential risks can be ignored. With the passage of time and changes in the surrounding environment, surface water quality may still be affected [22].
Solid Waste Leachate Analysis
The solid waste leaching toxicity test results are shown in Table 6. The mean concentrations of Hg, As, and Zn in these samples were 3.4×10⁻⁴, 2.5×10⁻⁴, and 0.04 mg/L, respectively (Table 6), and the average pH value in the solid waste leachate was 8.80. The detection values of the solid waste samples analyzed in this study did not exceed the standard limits for industrial solid waste and contaminated soils at the bottom of reservoirs, as stipulated in the Specification for Reservoir Basin Cleaning Design of Water Resources and Hydropower Project (SL664-2014). However, an analysis of the leachate from a solid waste sample indicated that the pH value was higher than the limits stipulated in the Integrated Wastewater Discharge Standard (GB8978- 1996) for first-category pollutants. Therefore, the solid wastes in this study were classified as second-category solid waste according to the Standard for Pollution Control on the non-hazardous industrial solid waste storage and landfill (GB 18599-2020). The elevated leachate pH (8.80, Table 6) classifies tailings as second-category waste under GB 18599-2020. This alkaline leaching is likely due to residual sodium hydroxide from ore processing, as reported by Guo et al. [6]. Prolonged stockpiling could exacerbate metal mobilization, as reported by Liu et al., necessitating pre-inundation stabilization [23]. Therefore, the solid waste in this study should be treated and properly disposed of prior to reservoir inundation [19, 20]. This result highlights the importance of tailings management in environmental protection in this area. If the tailings are piled up for a long time without effective treatment, under the influence of natural factors such as rainfall, pollutants in the leachate may continue to seep, causing secondary pollution to the soil and water bodies [24].
Table 4.
Underground water sample results.
Table 5.
Surface water sample results.
Table 6.
Solid waste sample results.
Implications
There are certain limitations in the research process. On the one hand, due to the long-term shutdown of the enterprise, some environmental data are missing, and information is mainly obtained through personnel interviews and on-site analysis. This may lead to certain deviations in the judgment of the pollution history and sources. On the other hand, the heterogeneity of the soil makes it difficult to ensure that the samples fully represent the pollution status of the entire area during the sampling process, and local pollution hotspots may be overlooked [25]. In addition, although advanced instruments and standard methods were used in the analysis, there may be errors in the detection of some trace pollutants [26]. This study comprehensively analyzed the soil and water bodies surrounding a defunct mineral processing plant in Maerkang County, Sichuan Province, aiming to assess heavy metal contamination levels and health risks. In addition to traditional phytoremediation approaches, the use of algal biomass has emerged as a promising alternative for the remediation of various environmental contaminants, including heavy metals and organic pollutants [27]. This technology, known as phycoremediation, leverages the high growth rate and photosynthetic efficiency of algae to remove pollutants from water and soil. Future land management strategies in this mining area could benefit from integrating such innovative bioremediation techniques.
Conclusions
This study analyzed the production processes, raw and auxiliary materials, and living environment of the companies both on and off-site. The concentration of soil detection factors for this project was lower than both the screening value for the second category of land use set out in GB36600-2018. At this stage, the site could be used to meet applicable land use standards as evaluated in accordance with the second-class land standards in GB 36600-2018.
It is evident that the testing indexes of groundwater and surface water were in accordance with the limits of Class III standards, as stipulated in GB/T 14848-2017 and GB3838-2002, respectively. Surface water in the vicinity of the site was relatively plentiful. However, the protection of both groundwater and surface water would be enhanced during subsequent site development, and groundwater should not be used as a source of drinking water. Therefore, the environmental risks associated with groundwater and surface water from this project were low, and the risk to human health could be considered negligible.
In addition, the solid waste leachate can meet the requirements of the Design Code for Cleaning the Bottom of Reservoirs of Water Conservancy and Hydropower Projects (SL664-2014). However, the pH of the solid waste leachate exceeded the maximum allowable emission concentration of first-category pollutants as defined in the Comprehensive Emission Standards for Sewage (GB 8978-1996). Therefore, the tailings slag was classified as second-class solid waste, and the tailings slag stockpiled on-site should be treated and disposed of appropriately.
The test results of soil, groundwater, and surface water samples collected on site indicated that the soil, groundwater, and surface water at the site could meet the standard limits set by the national standards. Consequently, the clean-up process could be initiated subsequent to the removal of the stockpiled tailings from the designated plots.
The results of this survey represent a professional judgment based on the current conditions of the parcel and the applicable evaluation standards. In the future, if the parcel undergoes modifications due to changes in land use type or evaluation standards, the existing findings should be reassessed, and the environmental investigation and assessment of the parcel may need to be re-conducted if deemed necessary. The environmental survey of the site aims to be as objective and realistic as possible in reflecting the distribution of the tested indicators; however, certain limitations exist. Future research could further expand the sampling range and increase the density of sampling points, especially by paying attention to potential pollution hotspot areas, to more accurately assess the pollution situation. In practical applications, based on the results of this study, relevant departments should promptly develop tailings treatment plans to prevent further harm to the environment. Moreover, during subsequent land development, long-term monitoring of soil and water quality should be strengthened to ensure environmental safety.

