


Introduction
The world’s water resources are likely experiencing increasing impacts due to the expanding and diverse patterns of land use and human occupation. These changes have consequences for the water cycle and, ultimately, the sustenance of life [1]. Numerous studies and observed irregularities provide clear evidence that climate change has already caused and will continue to cause vulnerabilities [2-4]. The concentration of carbon dioxide in the atmosphere reached its highest level in 2018, surpassing levels from the preindustrial era [5]. Consequently, the average global temperature has risen by 1.5ºC since the preindustrial era [6]. Rising sea levels and the reduction of sea ice are two significant indicators of this concerning situation, both directly linked to the increased presence of greenhouse gases in the atmosphere. Sea level rise reached a new record in 2019 at a rate of 3.2 mm/year, and the Arctic ice cover has been steadily thinning [7]. The Fourth Assessment Report of the Intergovernmental Panel on Climate Change emphasized the anthropogenic influence on the hydrological cycle, including precipitation, snowmelt, and early spring peak flows, with a high degree of confidence. The report concluded that this influence is extremely likely. The negative effects of climate change on streamflow and water quality pose a significant threat to freshwater habitats [8].
Anthropogenic activities impact the terrain, vegetation, climate, and atmospheric composition, thereby affecting the terrestrial water balance, water resources, and ecohydrological patterns [9]. Changes in hydrology exhibit significant geographical and temporal variations due to fluctuations in climatic factors such as precipitation and watershed heterogeneity. Several regions worldwide have reported increasing air temperatures and decreasing potential evaporation [10-12]. The hydrological function of plants has been studied for many decades, and experimental findings show that reducing forested areas leads to increased streamflow, although the magnitude of these increases may vary [13]. Large watersheds, defined as those exceeding 10,000 km2, exhibit diverse uses, practices, geological features, topography, and soil heterogeneities. This element influences hydrological responses in both large and small watersheds, and it contributes to the geographical and temporal variability of the climate. Characterizing the behavior of the water balance at different time scales remains a challenging but crucial research task because variables governing precipitation partitioning, such as rainfall intensity, vegetation cover type, and topography, vary in time and space [14]. Equation (1) illustrates the water balance concept, which helps assess how changes in watershed conditions affect the distribution of rainfall into its various components [15]:
Whereby; S represents the variation in soil water storage, P represents precipitation, ET represents evapotranspiration, and Q represents the total runoff measured as streamflow. Among these variables, precipitation is the most variable factor, changing both in time and space.
Traditionally, hydrological applications assume that precipitation is independent of vegetation type. However, some studies using general circulation models suggest that vegetation type can influence precipitation patterns on a continental scale [16]. Evapotranspiration, the second most important factor in the equation, is directly affected by vegetation characteristics. In arid and semiarid regions, evapotranspiration is typically equal to precipitation, whereas, in humid climates, it is limited by available energy. Runoff is influenced by vegetation structure, interception, and transpiration [17]. In regions where potential evaporation and precipitation have phase differences, surface runoff, and rainfall often exhibit a strong correlation in terms of annual amounts.
The last term in the equation represents changes in the soil’s water storage capacity. Long-term projections (5-10 years) suggest that changes in soil water storage will be insignificant compared to the average annual precipitation intensity [18]. Potential evaporation represents the available energy, while precipitation represents the available water. Considering the dynamics of water storage is crucial for determining the available water supply, especially at monthly and seasonal scales [19].
The Water Quality Index (WQI) is regarded as the most accurate method for assessing water quality. It employs a mathematical algorithm to evaluate water quality and determine its suitability for human consumption. The index was first developed by Horton in 1965, using the ten most commonly measured water characteristics. Subsequent modifications have been made by other experts, incorporating various factors related to water quality. The weights assigned to each parameter reflect their respective criteria, indicating their importance and impact on the index. Typically, the WQI involves three steps: (1) selection of parameters, (2) determination of quality functions for each parameter, and (3) aggregation using a mathematical equation. By considering a few water factors, the index provides a single value that represents the overall water quality at a specific location and time. It facilitates comparisons among different sample sites and transforms complex data into easily understandable information. The classification of water quality by the WQI indicates its suitability for drinking purposes. This single-value output, derived from multiple characteristics, offers valuable insights into water quality, even for non-experts [20].
Kazakhstan faces a significant threat from global warming due to its dependence on transboundary flows and the uneven distribution of water resources [21]. Over the past 50 years, glaciers have been rapidly deteriorating as a result of rising temperatures, influenced by both natural and human factors. The impact of a changing climate on people, the environment, livelihoods, and societal well-being primarily manifests through water in its various forms. The state of water resources directly responds to variations in precipitation, air temperature, and extreme events. Water scarcity is already becoming evident in Kazakhstan [22]. Projections suggest that by 2040, the country could face acute water shortages, meeting only half of its requirements [23]. According to the United Nations Development Programme (UNDP), this could lead to a 6% decline in the region’s GDP by 2050, given that almost every sector of the economy relies on water [24]. UNDP experts emphasize the need to strengthen basin management in order to establish the necessary conditions for implementing decisions and basin agreements. Shifting towards integrated water resources management and assessing the social, economic, and ecological value of water resources in the production of goods and services will result in increased resource efficiency [25]. When making decisions, basin councils must consider the increasing stress on water supplies caused by climate change. It is essential to plan and implement measures to slow down the growth of major water consumers, adopt modern technologies to reduce freshwater consumption in industry, agriculture, and communal services, and regulate the allocation of water resources across suitable geographic areas [26]. To support decision-makers and climate change experts in addressing water-related issues while developing national contributions under the Paris Agreement, the UNDP has created several sectoral checklists in collaboration with its partners. Experts attribute Kazakhstan’s water resource scarcity to natural factors such as the timing of river runoff (90% occurring in spring), the generation of approximately 50% of runoff in neighboring countries, and the extensive use of irrigation water with associated consumption and losses. Consequently, Kazakhstan’s irrigation water productivity is six to eight times lower than that of other countries [24].
Insufficient research on surface water concerns remains a challenge for managing the country’s valuable resources. For example, Ramazanova et al. [27] highlight the lack of knowledge regarding water quality in the northern Caspian Sea and the potential risks it poses to swimmers and coastal residents. Their study aims to assess the level of contamination in the Caspian Sea in Kazakhstan, particularly the presence of heavy metals and their implications for human health. The use of Water Quality Indices (WQIs) is a practical approach for evaluating the water quality of a body of water [28]. By employing a Water Quality Index (WQI), water quality data can be effectively and consistently communicated to the public. This index provides a straightforward assessment of drinking water quality, comparable to the UV index or air quality index.
The objective of this study is to examine various aspects of water resources management in the Karaganda region. It involves estimating the natural loss of water through evaporation from lakes and correlating this data with the total inflow of water. The study focuses on 119 lakes and their adjacent basin areas in the Karaganda region. These lakes are mostly endorheic and located peripherally. They are primarily fed by surface runoff, particularly from snowmelt, with minimal or no underground sources. The lakes are concentrated mainly in the more humid northern and western parts of the region. The assessment also considers other factors such as water quality using Water Quality Indices (WQIs) and the implementation level of Integrated Water Resources Management (IWRM). These aspects, along with others, provide a comprehensive understanding of the overall water quality status and progress in implementing IWRM practices.
Materials and Methods
Case Study Description
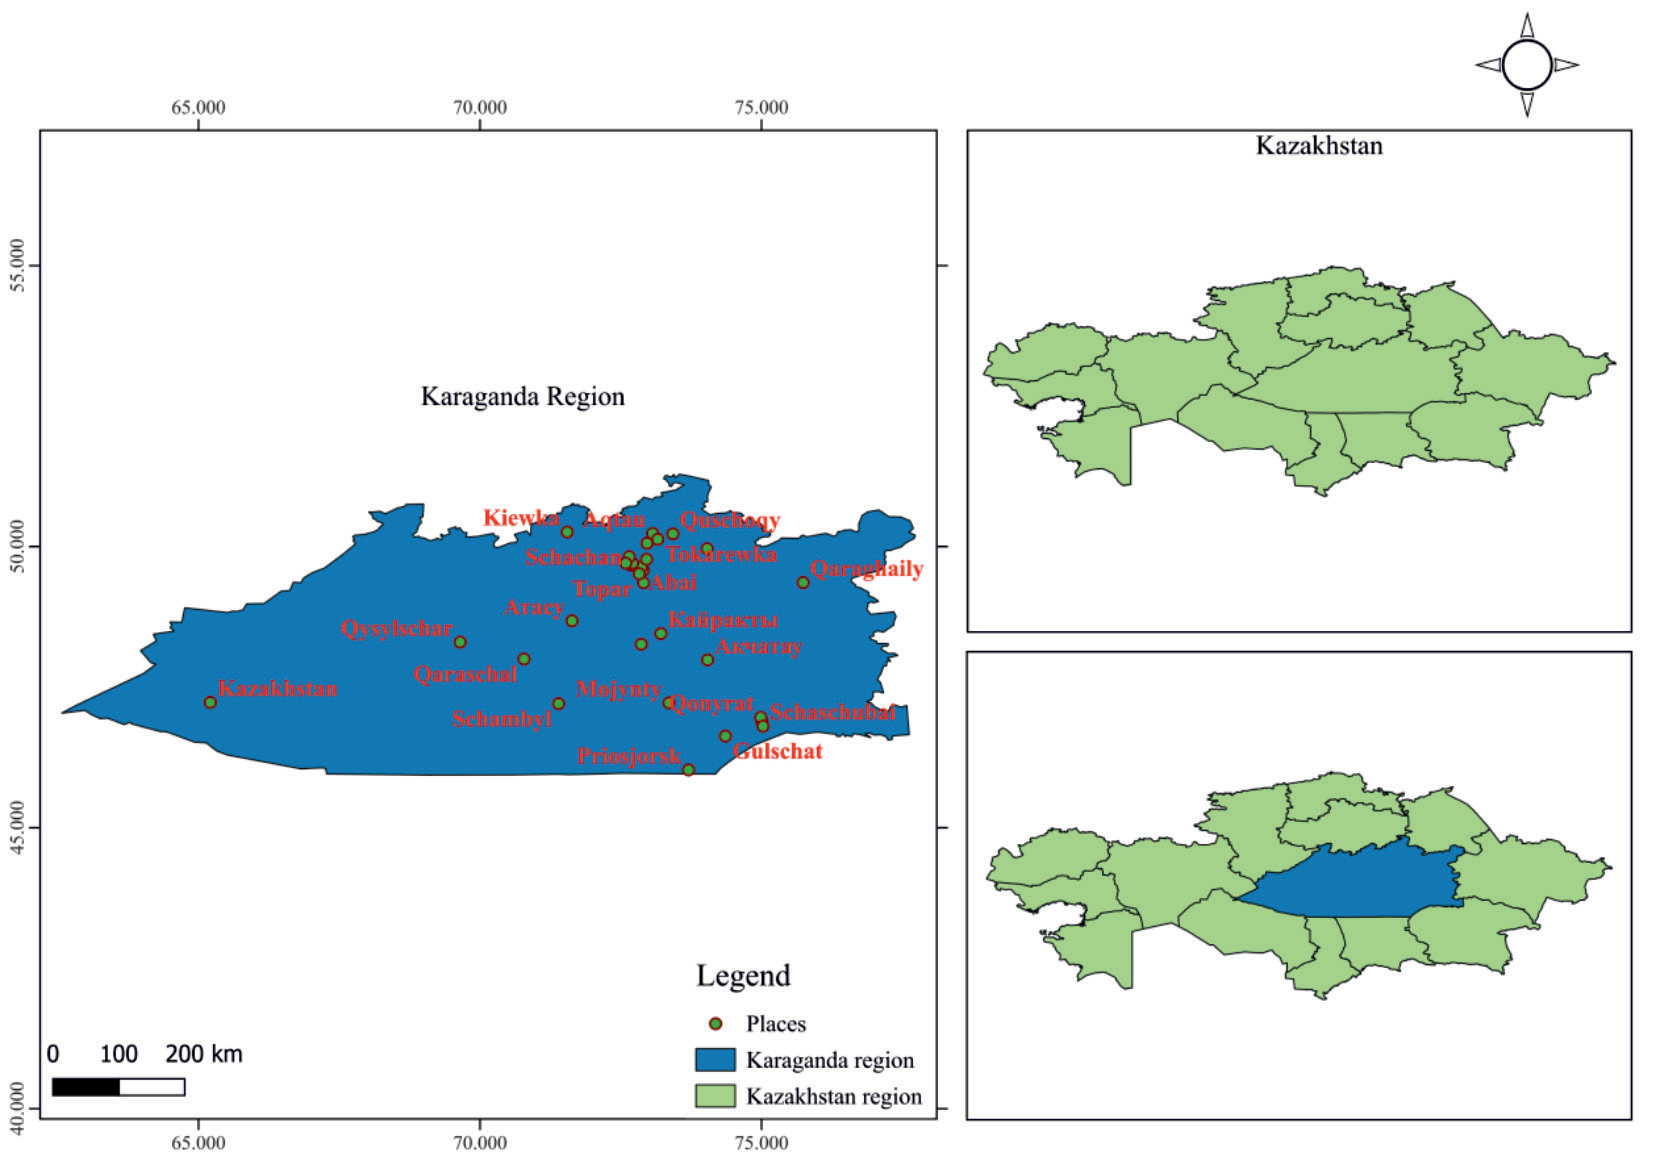
Karaganda region occupies most of the territory of Central Kazakhstan and is the second largest region of the Republic of Kazakhstan (Fig. 1). The water resources of the region are of great importance both for natural ecosystems and for the economic activity of the local population. Therefore, it is important to timely identify all possible surface water problems in order to determine the current situation and identify trends in their development. In this region, geographical and climatic conditions are historically unfavorable for the water regime of surface waters, in particular, a sharply continental climate, uneven precipitation, and aridity. The hydrographic river network of the territory is sparse. At the same time, there are a large number of temporary streams that exist only during the period of snow melting. Also, characteristic is the presence of a large number of lake bowls, which are filled with water for a short time after the spring flood. And permanent lakes experience constant drops in water level and significant changes in the area of the water surface. In this regard, it is of great scientific and practical importance to conduct regular monitoring of the ecological state, the water content of local lakes, and the water balance.
Determination of the Water Balance Components
The research took place between 2021 and 2022, aiming to identify the primary factors affecting the water balance. To assess the characteristics of lakes, such as their surface area in square kilometers and the overall area of the surrounding watershed, we employed measurements. The calculations for lake and catchment area utilized information obtained from Sentinel-2 satellites and processed through the SNAP software, which is owned by the European Space Agency. These satellite data, available through the specialized Copernicus Open Access Hub website after undergoing basic processing, were instrumental in our analysis. The comprehensive water balance equation encompasses the subsequent variables, denoted as Equation (2):
Whereby; WIP = Water inflow precipitation, UI = Underground inflow, RWI = River water inflow, ESW = Evaporation from surface waters, ESC = Evaporation from snow cover, ESP = Evaporation from soil and plants, RROT = River runoff outside the territory. Since in this work the task was set to assess the overall balance of all lakes in the region, the total values of the areas of lakes and the catchment area were used to calculate the components of the balance.
Water Evaporating from the Surface
The amount of water evaporating from the surface mainly depends on the temperature of the outside air, its humidity, and average wind speed and is determined approximately by the following formula (Equation 3):
Whereby; Нevap - evaporation layer in the water bowl per month in mm; 11.6 - coefficient taking into account the specific suction atmosphere in mm / mb per month; E1 - the maximum elasticity of water vapor at a given temperature of the water surface is determined from Table 3 in mb (millibars); e0 - partial pressure of water vapor in the air (determined by formula 2) in mb; В - wind force coefficient, В = 1 + 0.134Vв; Vв - average wind speed in m/s (per month); t - estimated evaporation time, measured in months.
It should be remembered that atmospheric gas is rarely completely saturated and is typically colder than body temperature. In the respiratory system, inspired gas is warmed to body temperature and fully saturated with water vapor. The partial pressure of water vapor is 47 mmHg at 37ºC (the saturation pressure of water vapor is 17.5 mmHg at 20ºC, 47.0 mmHg at 37ºC, and 760 mmHg at 100ºC). The barometric pressure or the other elements of the gas mixture have no effect on this pressure [29]. The following equation (Equation 4) was used to calculate the partial pressure of water vapor in air:
Table 1.
Maximum water vapor pressure at a given water surface temperature in mb.
| Т (ºС) | Е1 (Pa) | t (ºС) | Е1 (Pa) |
|---|---|---|---|
| 6 | 873.1 | 16 | 1819.4 |
| 7 | 1002.6 | 17 | 1939 |
| 8 | 1073.5 | 18 | 2065.4 |
| 9 | 1148.8 | 19 | 2198.9 |
| 10 | 1228.7 | 20 | 2340 |
| 11 | 1313.5 | 21 | 2488.9 |
| 12 | 1403.4 | 22 | 2646 |
| 13 | 1498.7 | 23 | 2811.7 |
| 14 | 1599.6 | 24 | 2986.4 |
| 15 | 1706.4 | 25 | 3170.6 |
Whereby; μ - relative humidity in %.
It is important to keep in mind that at a given temperature and pressure, saturation refers to the highest possible level of water vapor in the atmosphere. When the amount of moisture in the air is at its maximum at that particular temperature, it is considered to be saturated at 100% relative humidity. The estimated values of E1 are summarized in Table 1.
Estimation of Total Evaporation from the Moistened Vegetation Cover
It is worth noting that, while water that has been intercepted is also evaporated, not all evaporation from a leaf surface is transpiration. Total evaporation from the moistened vegetation cover was calculated by the formula (Equation 5):
Whereby; Ео - total evaporation from irrigated fields during the growing season; K-factor determined experimentally for each type of plant; P - the ratio of the duration of daylight hours for a given month to its annual amount; Ō - average monthly air temperature. The values of the coefficient K, were established by the authors for irrigated crops.
Daily Evaporation from the Surface of the Snow Cover
When snow directly changes phases into water vapor, it sublimates, losing water from the snowpack to the atmosphere. Although it is facilitated by drifting and blowing snow, sublimation can take place from a static snow surface. Using P.P. Kuzmin’s methods [30], daily evaporation from the snow cover’s surface was computed (Equation 6).
Whereby; u10, e*2, and е2 - average daily values, respectively, of wind speed, maximum elasticity of water vapor according to air temperature, and elasticity of water vapor.
Calculated Indicators of Evaporation from the Soil Cover
After irrigation or rainfall, meteorological conditions and, if relevant, crop canopy shading determine how much water evaporates from the soil surface. The rate of evaporation of water near the surface is only constrained by the amount of energy available. Evaporation from the soil was calculated in months without snow cover using the formula (Equation 7):
Whereby; Е and Е0 - Evaporation and evaporation respectively (the maximum possible evaporation from a sufficiently moistened underlying surface under given meteorological conditions) mm. month; w1 and w2 - reserves of productive moisture in a meter layer of soil at the beginning and end of the calculation month, mm; w0 - the critical reserve of productive moisture in a meter-long soil layer, at which (and above) the evaporation E is equal to the evaporation E0; (w1 + w2) / 2 - average monthly reserve of productive moisture in a meter layer of soil (mm).
The stock of productive moisture at the end of the month W2 is calculated by the formulas:
x0 and y0 - monthly values of precipitation and runoff, mm.
In the case when the monthly norms of the runoff layer Ym, determined by the indicated method, in total for the year amount to Yy, different from the average annual runoff Yk, taken from the map of K.P. Voskresensky, they are adjusted according to the formula.
Whereby; у - corrected monthly runoff layer.
With the availability of data concerning the deficiency of air humidity, it is also possible to estimate evaporation during the colder months of the year using the provided formula.
Whereby; n - number of days in a month; d2 - monthly air humidity deficit (mbar).
Water Quality Analysis
Water quality analysis is an essential scientific procedure used to evaluate the physical, chemical, and biological properties of water with the goal of determining its appropriateness for various applications. This thorough assessment plays a crucial role in safeguarding human well-being and preserving aquatic ecosystems. The study involves the examination of 24 water quality parameters, including total hardness, chromium, copper, color, turbidity, magnesium, calcium, sodium, chlorides, sulfates, TSS, fluorides, nitrates, TDS, cadmium, lead, aluminum, cyanides, zinc, potassium, manganese, iron, nickel, and arsenic. The gathered data is of utmost importance as it ensures compliance with regulatory standards for drinking water, evaluates the ecological equilibrium in natural water bodies, and tracks the impact of human activities on the environment. By conducting water quality analysis, scientists and policymakers gain valuable insights to develop targeted measures, sustainably manage water resources, and protect the delicate equilibrium of our planet’s invaluable and limited water resources.
Water Quality Analytical Methods
The samples were collected as grab samples using 5L plastic bottles, which were thoroughly rinsed with deionized water before use. All samples were preserved at 4 °C before transporting them to the lab for treatment and analysis. In this comprehensive water quality assessment, various analytical techniques were employed to measure essential parameters and elements in water samples. The measurement of turbidity was conducted following the Standard Operating Procedure for Turbidity of the U.S. Environmental Protection Agency Great Lakes National Program Office (GLNPO) based in Washington, D.C. For determining color, a UV-V Spectrophotometer (PE-5400UV) from ECOCHEMICAL in St. Petersburg, Russia, was utilized. Concentration levels of TSS were determined using the Hach TSS portable hand-held turbidity meter from HACH/LANGE in Berlin, Germany. The total hardness was determined through titration with the sodium salt of ethylenediaminetetraethanoic acid (EDTA), and a Cu electrode along with Cu-EDTA was used for detection. The resulting data allowed for the calculation of the sum of EDTA complexable ions. Chromium was detected using both chromatographic and colorimetric techniques, while the sensitivity to chromium was assessed through patch testing and lymphocyte proliferation testing. The concentration of copper, lead, aluminium, cyanides, zinc, potassium, manganese, iron, nickel, arsenic, cadmium, and sodium was analyzed simultaneously using Inductively Coupled Plasma Mass Spectrometry (ICP-MS). This advanced method facilitated the precise measurement of multiple elements at trace levels with high accuracy and sensitivity. The water samples were carefully prepared and introduced into the ICP-MS instrument, where they underwent atomization and ionization by an inductively coupled plasma. Subsequently, the ions were separated based on their mass-to-charge ratio and detected, providing valuable quantitative data on the concentrations of these elements in the water samples.
Calcium and Magnesium levels in water were simultaneously determined through titration with the sodium salt of ethylenediaminetetraethanoic acid (EDTA) at a pH range of 8-9. The Ca electrode was employed to detect the presence of Calcium during the analysis process. Sulfate determination was accomplished by using the Ca-ISE (Calcium Ion-Selective Electrode) with EGTA as the titrant, while the addition of an excess amount of BaCl2 facilitated the precipitation of sulfate in the water sample. Additionally, fluoride concentrations in water samples and appropriate standards were measured electrometrically utilizing an ion-specific electrode. For the measurement of nitrates in the water samples, a spectrophotometric method was employed, involving the reduction of nitrate ions to nitrite ions in the presence of a reductant. Prior to analysis, the water samples were treated with a suitable reducing agent to convert nitrates to nitrites. Subsequently, a colorimetric reaction was initiated, wherein the formed nitrite ions reacted with a diazo reagent, resulting in the development of an intense color. This color change allowed for the quantification of nitrate levels in the water samples. On the other hand, the measurement of Total Dissolved Solids (TDS) was performed using a gravimetric method. Initially, a known volume of water was filtered to eliminate any suspended solids. The filtered water was then evaporated to dryness in a pre-weighed dish. After complete evaporation, the dish was re-weighed, and the difference in weight before and after evaporation provided the amount of dissolved solids present in the water sample.
Development of Water Quality Indices (WQIs)
To develop the Water Quality Indices (WQIs), a comprehensive assessment of water quality was conducted, considering 24 different quality-determining parameters. These factors include total hardness, chromium, copper, color, turbidity, magnesium, calcium, sodium, total suspended solids (TSS), fluorides, nitrates, total dissolved solids (TDS), cadmium, lead, aluminum, cyanides, zinc, potassium, manganese, iron, nickel, and arsenic. The WQI technique combined these 24 water quality variables into a single index to evaluate the effectiveness of wastewater treatment facilities. Equations 14 to 17 outline the step-by-step process for calculating the WQIs. In the first step, each parameter was assigned a weight (wi) on a scale of 0 to 6, where 0 represented the least impact and 6 represented the greatest impact on water quality. The weighting was determined based on how each parameter was expected to affect the intended use of the water. This weighting technique followed the guidelines of the National Sanitation Foundation of the United States Water Quality Index (NSFWQI). Next, Equation (14) was employed to calculate the relative weight (Wi), which involved dividing each weight by the total sum of all the weights.
In the subsequent step, a quality rating scale (qi) was established for each metric. To derive this scale, the concentration of each parameter was divided by its respective recommended standard as per the Kazakhstan standards. The resulting quotient was then multiplied by 100 to yield the following expression:
In accordance with the standards set by Kazakhstan for drinking water, Si represents the recommended water standard, while qi denotes the quality rating. Ci represents the concentration of each specific parameter. The overall Water Quality Index (WQI) can be obtained by computing the sub-index (SI) for each parameter, as illustrated in Equation (16):
To obtain the final overall Water Quality Index (WQI), the sub-indices derived from each analyzed parameter were summed together.
The sub-index of a parameter is represented by SIi, and there are a total of n chemical parameters. The quality rating, qi, is determined based on the concentration of the specific parameter. Wi, which is the relative weight, is denoted by a capital W. The assigned weights and relative weights can be found in Table 2.
The projected Water Quality Indices (WQIs) were calculated based on the classification of status values, which include categories such as „excellent water,” „good water,” „poor water,” „very poor water,” and „water unsuitable for drinking” (as indicated in Table 3) [31, 32].
Implementation of Integrated Water Resources Management (IWRM)
In order to ensure a reduction in bias and improve the feasibility of data collection, houses were chosen for the purpose of data collection using a straightforward random sampling procedure. Using information from the target villages, the primary respondents for the research questionnaires were found, guaranteeing a representative sample. The project intervention sites that were close to the region’s primary water resources served as the major criteria for choosing the target villages. A survey questionnaire with both open-ended and closed-ended items was distributed to households and used as the main data collection tool. Focus groups, key informant interviews, and transect walks were used to collect more information to supplement the data. 15 stakeholders from diverse sectors participated in physical and telephone interviews as well as field household interviews. These stakeholders included decision-makers in politics, culture, management of technical resources, management of water user committees, and civil society organizations. Additionally, six focus group conversations with varying numbers of members from different genders (10-25) were scheduled. To get a full picture, these discussions were held in the upstream, midstream, and downstream catchment zones. Researchers swiftly evaluated the physical parameters and cross-validated data provided by the respondents during transect walks in the catchment region. Focus group talks and key informant interviews shed light on problems at both the neighborhood and the more general geographic level. This strategy includes involving respondents at several levels, guaranteeing consistency, and coordinating with validation techniques for environmental governance. Government plans, studies, strategy documents, and policies served as the source for secondary data and information. This methodology allowed for the collection of both qualitative and quantitative data from a variety of sources, allowing for a thorough investigation of the problems while confirming the validity of the study findings through rigorous analysis.
Results
General Water Balance
Throughout the measurements, data regarding the hydromorphology of lakes in the Karaganda region were collected. Specifically, information pertaining to their size, including area and catchment area, was gathered and recorded in Table 2. Additionally, data regarding monthly precipitation and temperature throughout the year were also collected. The total catchment area of the catchments was calculated to be 22841 km2 in order to compute the elements of the water balance. The lakes under study have a combined water surface area of 770 km2. Based on the calculations, it was noted that the total water influx resulting from precipitation across the entire area amounted to 9633288*106 kilograms.
Table 2.
Parameters that were studied, along with their respective weights.
The Karaganda region in Kazakhstan is blessed with a network of rivers that gracefully flow into its lakes, enriching the region’s natural beauty and contributing to its ecological balance. These rivers, such as the Karasor, Saumalkol, and Botaka (Table 4), among others, bring life-sustaining water to the lakes in the area. As the rivers wind their way through the picturesque landscapes of Karaganda, they carry with them a diverse array of sediment, nutrients, and aquatic life, further enhancing the ecological richness of the lakes. This interplay between the rivers and lakes creates a harmonious ecosystem, supporting a variety of plant and animal species and providing a vital source of water for local communities and wildlife alike. The rivers flowing into the lakes in the Karaganda region stand as a testament to the region’s natural wonders and serve as a reminder of the intricate connections within its diverse and captivating environment.
Table 3.
Water quality index categories.
| Class | WQI value |
|---|---|
| Highly suitable water | <50 |
| Average quality water | 50-100 |
| Poor water | 100-200 |
| Very poor water | 200-300 |
| Water unsuitable for drinking | >300 |
Table 4.
Rivers flowing into lakes.
Table 5.
Rivers that go beyond the territory of the Karaganda region
Beyond the borders of the Karaganda region in Kazakhstan, a multitude of rivers traverse the vast and diverse landscapes of the country. These rivers, originating from different sources, carve their way through mountains, steppes, and valleys, meandering across the expansive territory. These rivers, with their majestic flows and intricate networks, play a crucial role in shaping the geography, ecology, and livelihoods of the areas they traverse, extending beyond the boundaries of the Karaganda region and contributing to the overall beauty and richness of Kazakhstan’s natural heritage. Table 5 presents a concise overview of the river flow patterns that extend beyond the territorial boundaries and do not directly flow into lakes.
The combined water flow of these rivers, considering an average water content, amounts to 17.71 m3/s, corresponding to an annual water flow of 5.58503E+11 kilograms. In order to estimate evaporation from the surface waters, monthly air temperature values were obtained, and evaporation rates were calculated accordingly (refer to Table 6). The calculation specifically accounted for the months between April and October, excluding the period when lakes are covered with ice. The average wind speed (Vw) was taken as 17 km/h, while the average relative air humidity (μ) was determined to be 53%. As a result, the calculated evaporation from the total water surface of the lakes under study amounted to 8,090,179,183,000 kilograms of water per year.
To determine the total area covered by rivers, an average width of 0.003 km and a combined length of 2924.6 km were utilized, resulting in a river area of 8.7738 km². From this area, the estimated quantity of water lost through evaporation amounted to 9E+07 tonnes. Additionally, the total evaporation from the surface waters of lakes and rivers was calculated to be 8E+09 tonnes of water. The evaporation from the wet vegetation cover was determined by considering the growing season of plants, which extends from April to October. Table 6 presented the necessary data, including the average monthly air temperature (Ō), the duration of daylight hours in each month (X), and the annual sum of hours (Y). For each month, the ratio of daylight hours to the annual sum of hours, in conjunction with the value P (Ō + 17.8), was computed separately (as illustrated in Table 7).
Snow cover in the Karaganda region lasts for 5 months from November to March. Table 8 presents the data on evaporation from the snow cover for these months.
Indicators of evaporation from the soil cover refer to various factors or measurements that provide insights into the process of water vaporization from the soil surface. These indicators help in understanding and quantifying the rate and extent of evaporation, which is a crucial component of the water cycle and hydrological processes. Monitoring and understanding these indicators of evaporation from the soil cover are essential for various applications, including agriculture, water resource management, and climate studies. By accurately assessing evaporation rates, researchers and decision-makers can develop strategies to optimize irrigation practices, conserve water resources, and mitigate the impacts of drought or water scarcity. Table 9 provides a summary of the computed indicators related to evaporation from the soil cover.
Table 6.
Evaporation from surface waters.
Table 7.
Indicators for calculating the total evaporation from wet vegetation cover.
Precipitation plays a crucial role in the water balance of the Karaganda region. The amount and distribution of rainfall and snowfall directly impact the availability of water resources. The region experiences a continental climate with limited precipitation, making it susceptible to water scarcity. Evaporation, influenced by temperature, wind, and vegetation cover, represents the loss of water from the region’s surface. High temperatures and strong winds can increase evaporation rates, contributing to water loss from lakes, rivers, and soil. Surface runoff refers to the movement of water over the land surface. It occurs when precipitation exceeds the infiltration capacity of the soil. The topography, soil characteristics, and land use practices affect the amount of runoff generated. In the Karaganda region, runoff contributes to the recharge of rivers and lakes, supporting their water levels. Groundwater recharge is an essential component of the water balance, particularly in regions with limited surface water resources. It represents the replenishment of groundwater reservoirs through the percolation of water from precipitation or surface runoff. The geological properties of the region determine the availability and capacity of aquifers for groundwater storage. Water consumption in the Karaganda region includes both agricultural and domestic uses. Irrigation for agriculture accounts for a significant portion of water demand. Efficient water management practices, such as irrigation technologies and crop selection, play a vital role in optimizing water usage. Domestic water consumption includes residential and industrial needs, which must be carefully managed to ensure sustainable water availability. To maintain a sustainable water balance in the Karaganda region, it is crucial to monitor and manage these factors effectively. This involves implementing water conservation measures, improving water infrastructure, promoting water-efficient practices, and raising awareness about responsible water usage among the local population. Additionally, regular assessments and modeling of the water balance help in understanding the dynamics of water availability and guiding informed decision-making for water resource management in the region. Table 10 contains the information regarding the water balance components of the lakes in the Karaganda region.
Table 8.
Evaporation data from snow cover by months.
Table 9.
Calculated indicators of evaporation from the soil cover.
Table 10.
Water balance of Karaganda region.
Thus, if we assume that unaccounted factors, the value of which is assumed to be insignificant, the total value of the annual water balance in the study area with a total area of 23611 km2 is about 18425751757400 kg of water. At the same time, water balance calculations indicate that the largest water inflow is due to precipitation – 52.281% and groundwater – 46.783%. The largest water consumption from the territory falls on evaporation from surface water – 44.40% and active evaporation by plants 46.225%. The total evaporation from the surface of soils and water bodies is much higher than precipitation, which indicates that most of the lakes are fed by groundwater.
Water Quality Index (WQI)
Table 13 shows a WQI for each lake involved in the study. As was previously mentioned, the WQIs were calculated for each lake included in the study to provide a summary of how well it compared to requirements for drinking water quality. Table 11 shows that the majority of lakes have water quality indices above 100, necessitating water treatment before being used for drinking purposes. It is also important to note that water quality monitoring offers the unbiased proof required to make wise management decisions for controlling water quality now and in the future. We utilize water-quality monitoring to identify new, persistent, and developing issues, assess if drinking water requirements are being met, and safeguard other beneficial uses of water.
Additional general information about the WQIs’ occurrence in several of the surveyed lakes is shown in Fig. 2. Fig. 2 shows that the bulk of the lakes were located between WQIs of 100 and 250. Nevertheless, several of them have been seen to be over 300. As was previously mentioned, the big picture suggests that drinking water from the lakes under investigation would need to undergo some amount of treatment.
Table 12 summarizes the WQI occurrences across the various classes from the investigated lakes. Table 12 shows that, in terms of water quality, none of the lakes were in the first class (>50) which is “highly suitable water” for drinking purposes. Additionally, just 4.6% of the lakes were classified as having water of quality between 50 and 100, meaning that they still require some treatment before being utilized for drinking. On the other hand, 47.7% of the lakes under study fell into the 100-200 (bad water) classification, which also means that the water in this class needs to be purified before being used for drinking. Additionally, 11% of the other lakes fell into the “water unsuitable for drinking” class (>300), while 36.7% of the lakes under study were classified as having “very poor water” (class 200-300).
Implementation of IWRM
Fig. 3 presents an overview of the water resource governance systems in the Karaganda region. The dominant system, as shown in the figure, is the conventional system, accounting for 28% of the total. Following closely is the collaborative system, representing 23% of the governance mechanisms. Conversely, the traditional system has the smallest representation, comprising only 14% of the overall water resource governance in the region. An opportunity to transform water resource systems and bring them into compliance with effective principles of water management and governance is presented by the acceptance of water sector reforms and the implementation of the integrated water resources management strategy. Various forms of governance systems for water resources exist, including collaborative, polycentric, new public management (NPM), traditional or customary, and conventional systems. These systems include distinct decision-making procedures and approaches at the local level. The findings suggest that the conventional governance system predominates, accounting for a higher percentage when compared to alternative governance systems, based on observations made in the catchments.
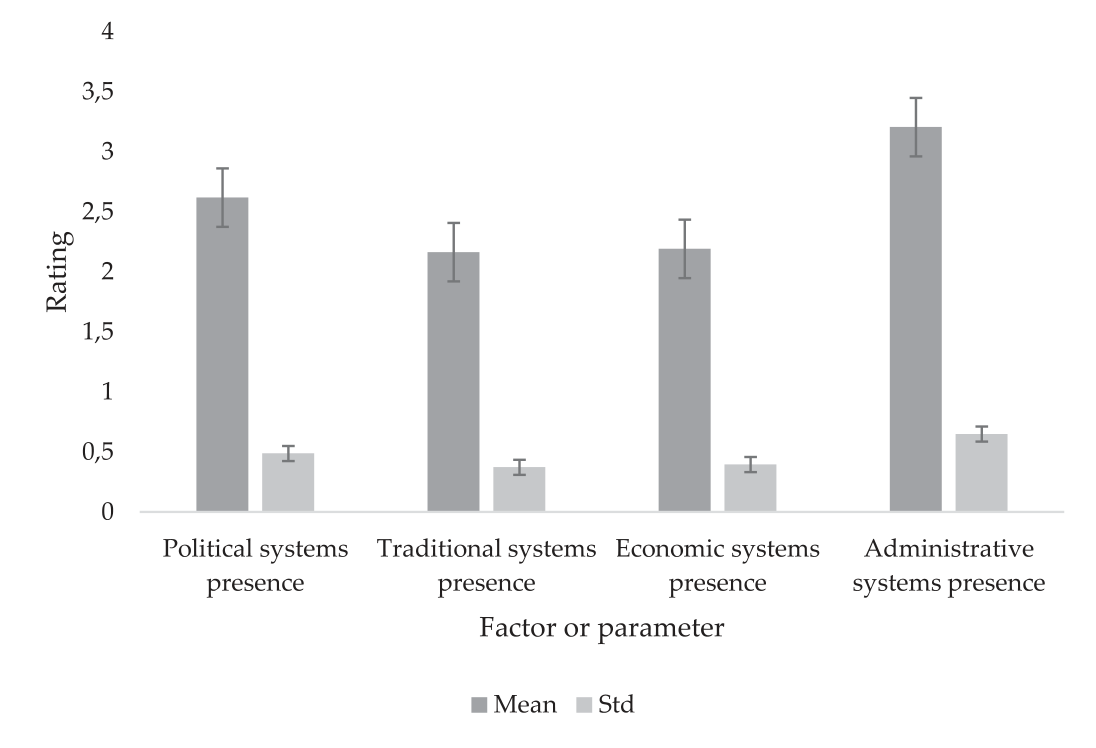
The study looked into the many systems – including politics, society, the economy, and administration – that are engaged in the management of water resources and related services in the Karaganda region. It is clear from the research of particular cases that the Karaganda region exhibits more pronounced socio-economic, political, and administrative frameworks as a result of integrated water resources management initiatives. The statistical research shows that political systems that promote water resource management are far more common in this area. Although there is a wealth of information about political structures and processes, traditional systems are rarely used, administrative systems have difficulty enforcing their rules, and multi-stakeholder finance dominates the economic landscape (as seen in Figs 4 to 5). The data from Figure 3 indicates that capacity building opportunities obtained the highest mean score (2.38), while knowledge of the water resources stakeholders ranked second with a mean score of 1.58. On the other hand, community resource user capacity received the lowest mean score, which was 0.23.
The Karaganda region has adopted Integrated Water Resources Management (IWRM) to encompass the various governing aspects of water resources. This comprehensive approach involves the establishment and implementation of integrated systems and procedures aimed at efficiently managing and controlling water resources. The governance aspects encompass a wide range of elements, including political, social, economic, and administrative systems, all contributing to effective water resource management. The statistical significance of the data presented in Fig. 5 lies in the mean scores assigned to each facet of water resources management. The highest mean score of 3.21 was given to the administrative system, indicating its prominent presence and importance in the implementation of IWRM in the region. This suggests that the administrative aspect plays a crucial role in governing water resources and may have significant influence on decision-making and policy development related to water management. Furthermore, the mean scores for the other facets, including political (2.62), traditional (2.16), and economic (2.19) systems, were provided in Fig. 4. The comparison of these mean scores with the highest mean score for the administrative system highlights their relative significance in the context of water resources management in the Karaganda region. While all facets are integral to effective governance, the data indicates that the administrative system received the highest average rating, indicating greater emphasis or effectiveness in this area. Overall, the data from Fig. 4 provides valuable insights into the relative importance and focus placed on different governance aspects, assisting policymakers and stakeholders in making informed decisions to ensure the efficient and sustainable management of water resources in the region.
Table 11.
Water Quality Index for each studied lake.
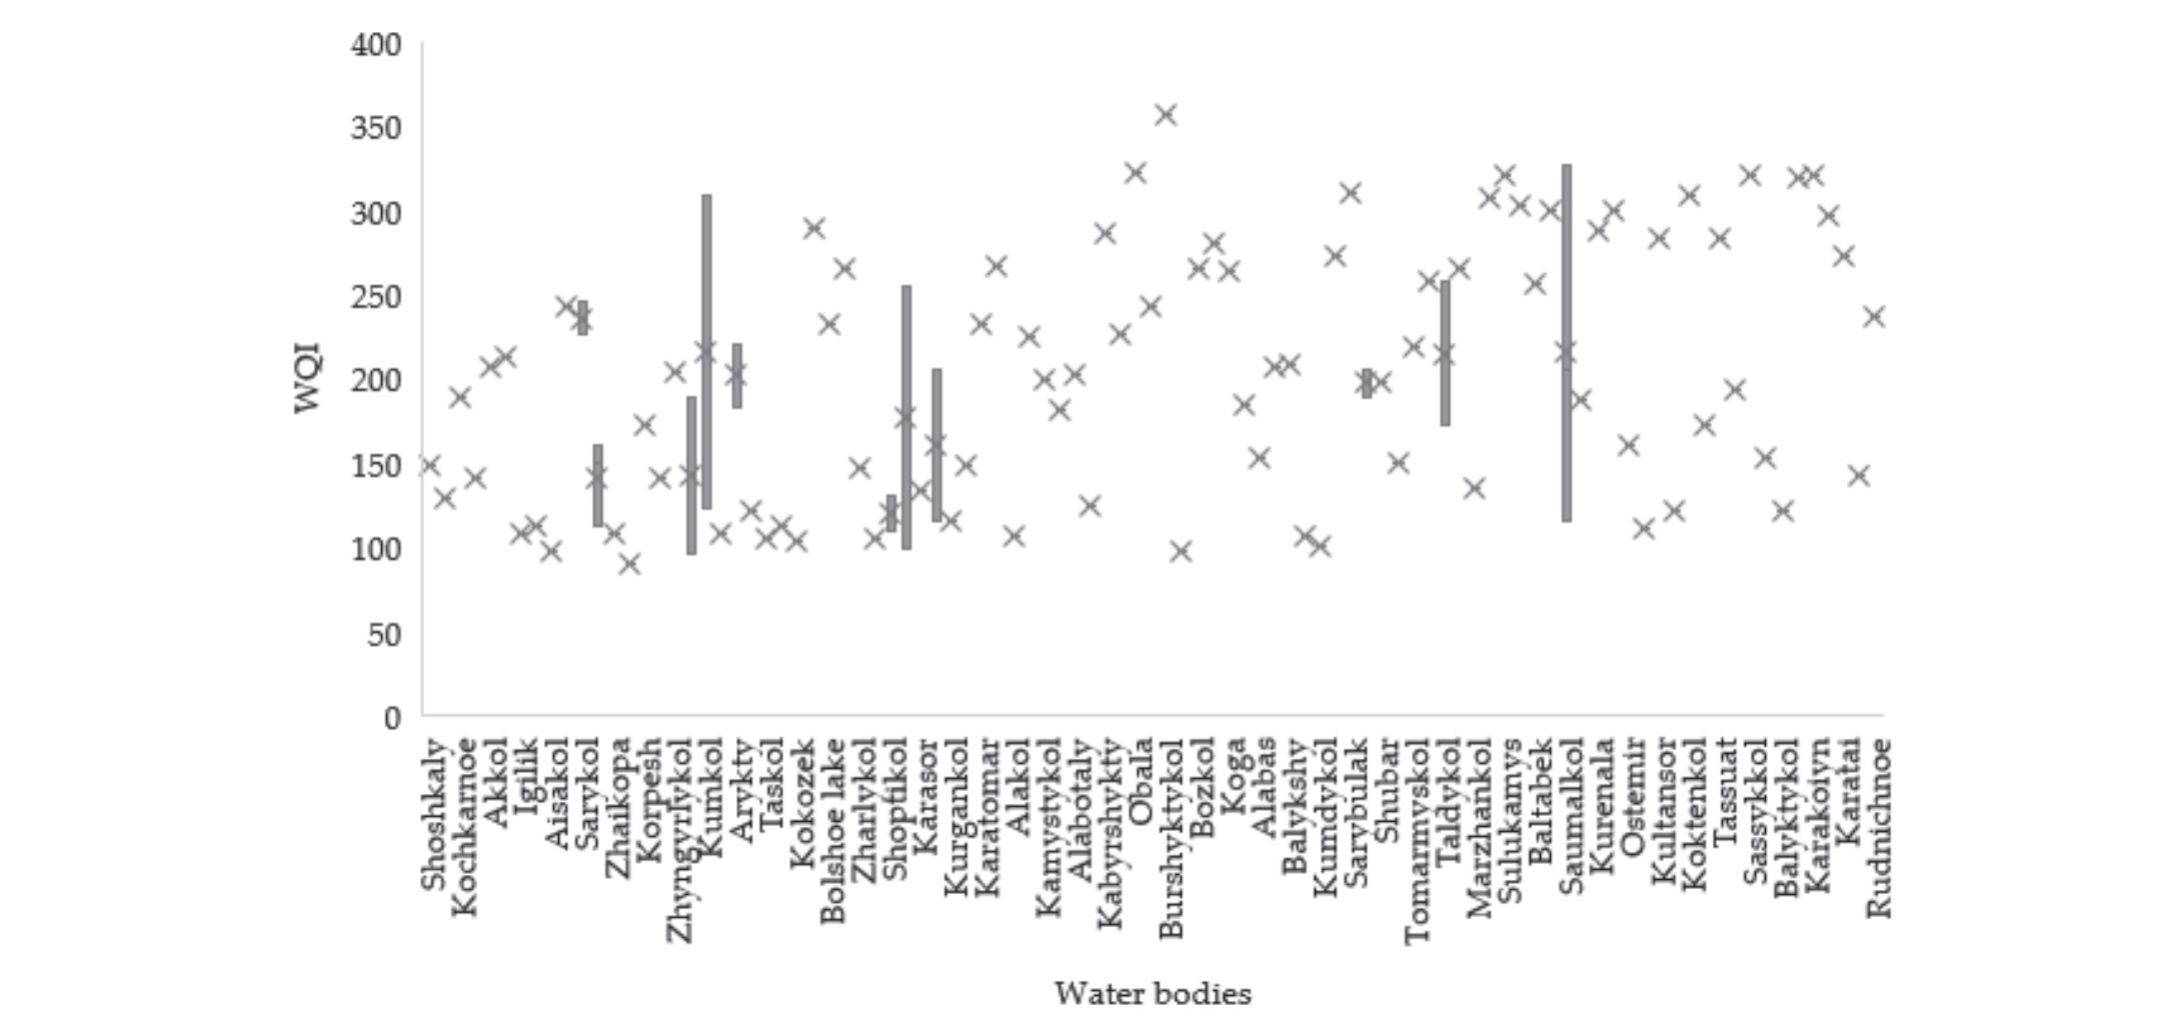
Table 12.
Summary of the developed WQIs
| Range | Occurrence | Percent occurrence (%) |
|---|---|---|
| <50 | 0 | 0 |
| 50-100 | 5 | 4.59 |
| 100-200 | 52 | 47.71 |
| 200-300 | 40 | 36.70 |
| >300 | 12 | 11.01 |
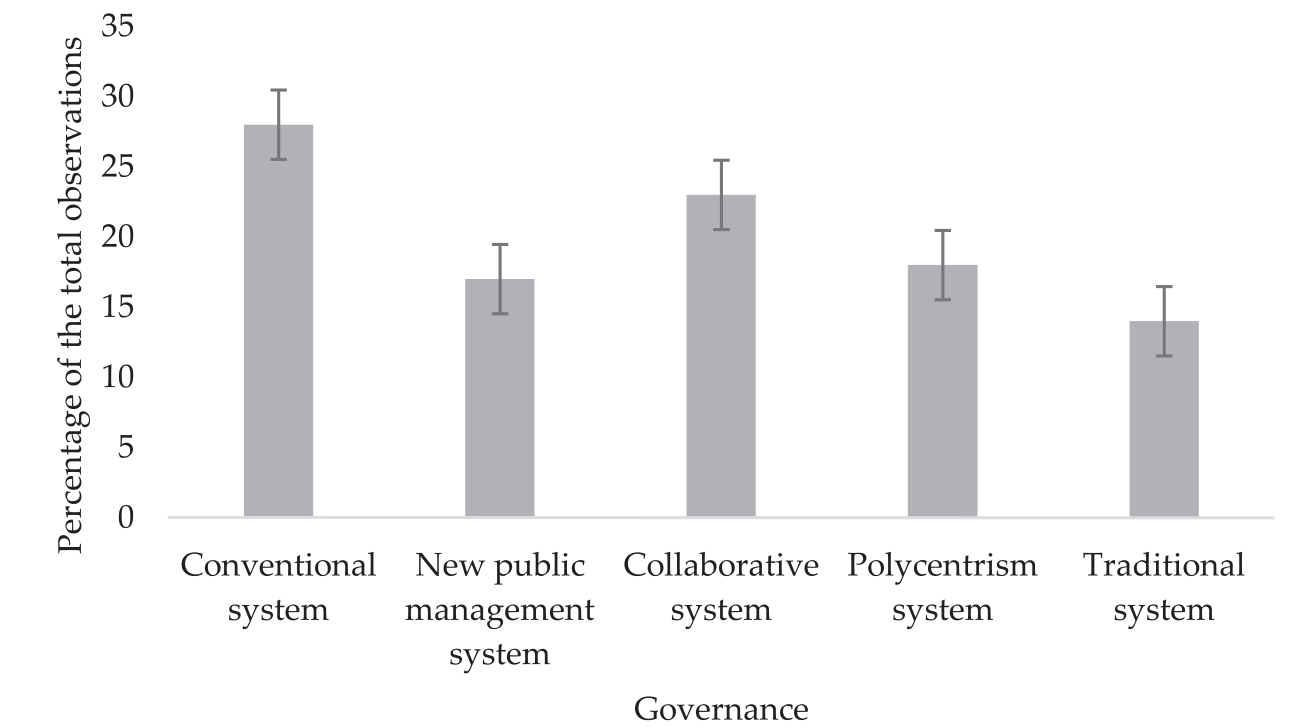
Fig. 4.
Likert scales on knowledge and capacity aspects of the IWRM implementation in Karaganda (n = 164).
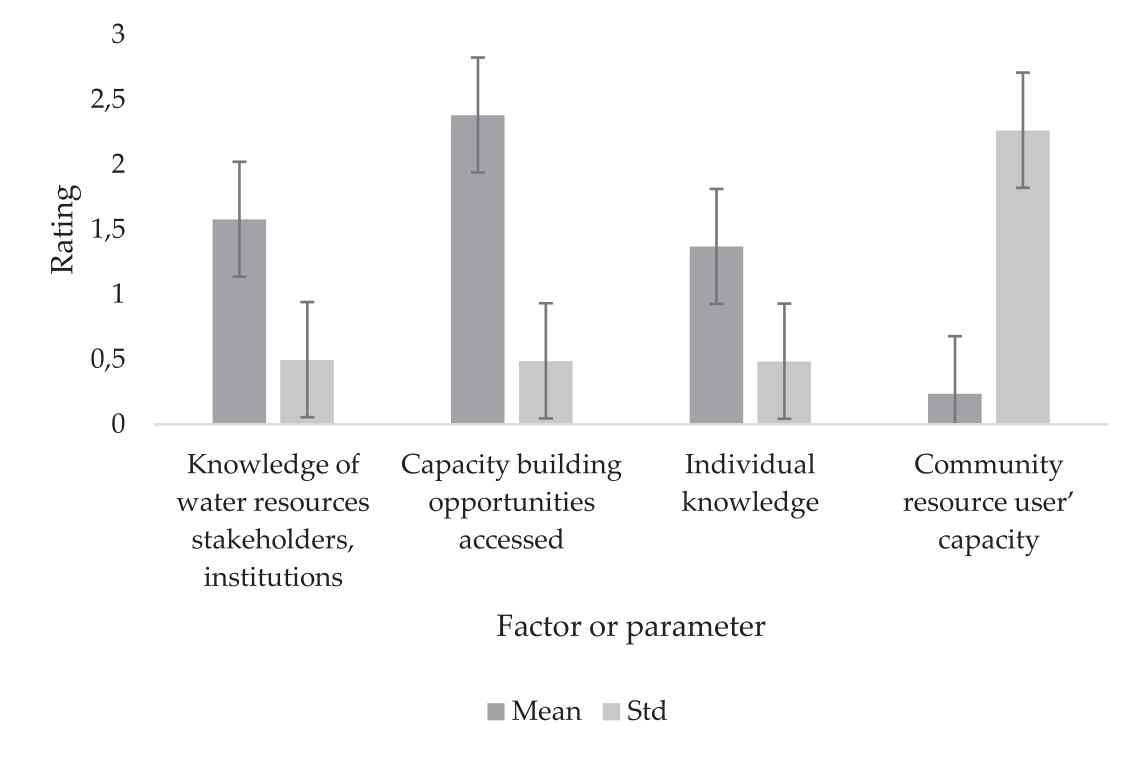
Fig. 5.
Likert scales on water resources governance aspects of the IWRM implementation in Karaganda (n = 164).
The strategies and tools used to resolve disputes over water in the Karaganda region depend on the institutional structures and legal frameworks already in place. It is critical to recognize that regionally distinct cultural, social, and historical elements may have an impact on these particular processes and mechanisms. Conflicts involving water resources may also be resolved using regional traditions and traditional dispute-resolution techniques. On the other hand, creating a legal framework that recognizes and protects the rights of individuals, communities, and other stakeholders with respect to water resources is necessary for establishing legal rights surrounding water in the Karaganda region. Throughout the region, this framework aims to promote fair and equal access, sustainable use, and efficient management of water. The data presented in Fig. 6 indicates that the system to report concerns and handle disputes received the highest mean score of 2.6, suggesting its relatively higher effectiveness or importance in the context of the water resource governance being evaluated. On the other hand, the mean scores for the other systems, namely systems enabling water rights (2.3), systems enabling obligations (2.29), and systems for resource management (2.45), were lower than the mean score for reporting concerns and handling disputes. Statistically, the mean scores provide a measure of central tendency, representing the average rating given by respondents for each system. A higher mean score implies that, on average, the respondents perceived the system to report concerns and handle disputes as more effective or significant compared to the other systems. Conversely, the lower mean scores for the other systems suggest that they may be considered to be less effective or less prominent in the overall water resource governance being assessed. It is important to note that these mean scores are based on the responses of the survey participants or data collected from the relevant stakeholders. The higher mean score for the system to report concerns and handle disputes suggests that this aspect of water resource governance might be well-established or well-regarded by the respondents.
Fig. 6.
Likert scales on the functionality of systems aspects of the IWRM implementation in Karaganda (n = 164).
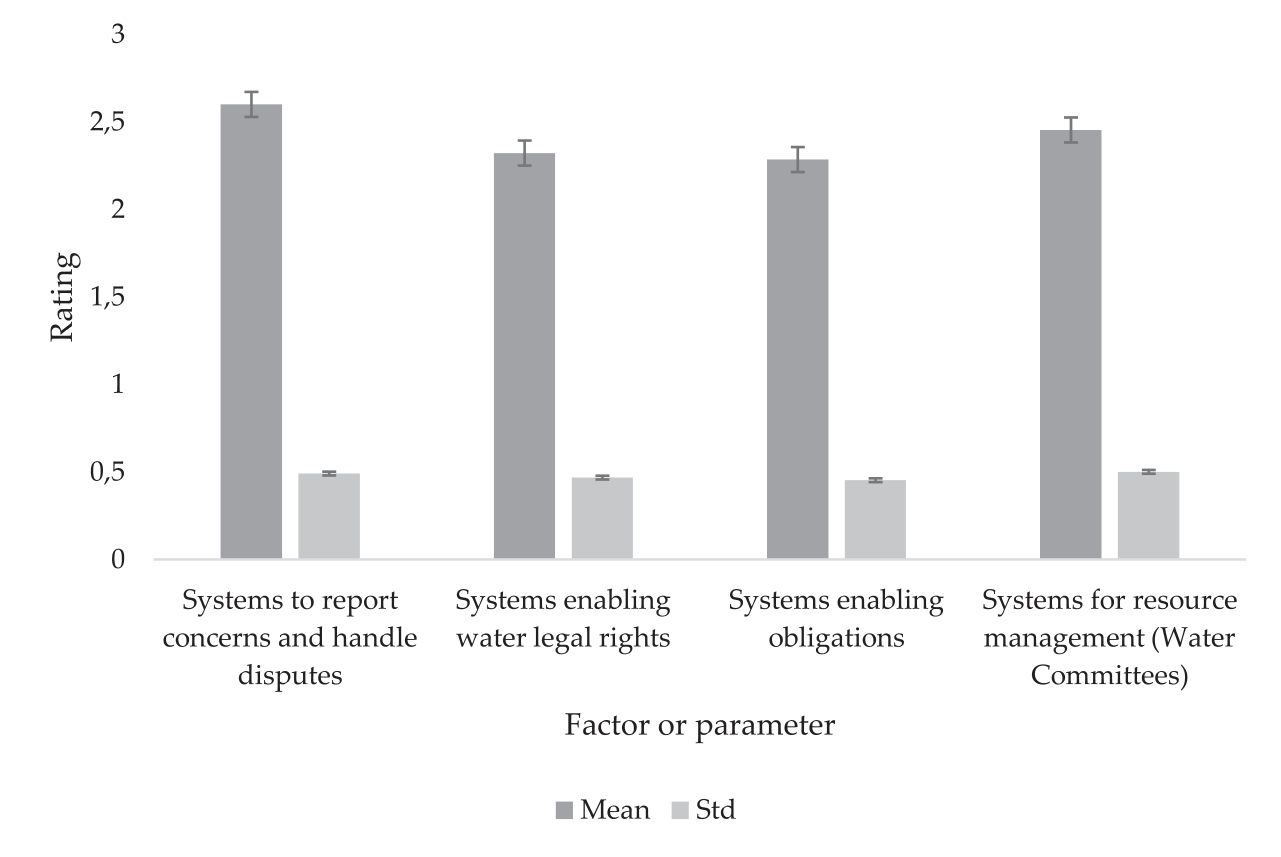
Table 13.
Implementation of principal IWRM features.
This section of the research focused on examining the degree of implementation of IWRM in the study catchments. Table 13 reveals that stakeholder participation, ecosystem protection, and water quality management received the lowest evaluations, scoring an average range of 2.4 to 2.8. It should be noted that IWRM is distinguished as a complete and sustainable approach to water management by a number of key characteristics. The adoption of a holistic viewpoint, which acknowledges the complex relationships between various water uses and sectors, is one of its key characteristics. By encouraging cooperation and consensus-building among many stakeholders, this inclusive strategy ensures their active involvement in decision-making processes. IWRM places a high priority on the equitable distribution of water resources, taking into account the demands of both the present and the future while preserving the health of ecosystems. IWRM places a strong emphasis on basin-based planning and management, recognizing that water systems are best understood and managed at the watershed or basin level. IWRM also lays a strong emphasis on preserving water quality, encouraging climate change adaptation, and encouraging knowledge and information sharing among all parties concerned. IWRM aims to accomplish sustainable water management by incorporating these essential components. This will help it address the problems of water shortages, climate change, and rising water demands while maintaining the essential resource for the welfare of both people and the environment.
Discussion
Kazakhstan is confronted with significant challenges in establishing a sustainable urban water supply that is both environmentally and financially viable. These challenges include pollution, water scarcity, and the deterioration of ecosystems in the Aral and Caspian basins. It is crucial to develop effective integrated water resource management that promotes collaboration among the water resources, environment, and water supply sectors to find long-term solutions that meet the water demand. To tackle these issues, the government is in the process of creating organizations and procedures for managing resources based on river basins as an initial step. However, the current Basin Management Authorities, including those in the Nura-Sarysu basin, have limited capabilities to effectively oversee and manage water resource usage. Strengthening institutions is necessary to overcome these limitations, including support for data collection and analysis, as well as training in basin management theories and practices. Regarding the hydromorphology of the region, it takes into account the physical characteristics and water content of water bodies, examining how both natural and human-induced processes impact hydrology, geomorphology, and associated ecosystems.
Due to variations in cloud cover, the southern part of the region experiences considerably longer periods of sunlight compared to the northern part. As a result, there are variations in the components of the radiation balance based on the latitude of each area. For example, Karaganda has approximately 80 clear days annually, and the total annual solar radiation increases from north to south, ranging from 110 to 130 kcal/cm2. Monthly solar radiation ranges from 2-3 kcal/cm2 in December to 16-18 kcal/cm2 in June [33]. The reflectance of the Earth’s surface also varies across the region, particularly during colder months. During summer, the albedo value ranges between 20 and 28 percent, while during winter, with the presence of snow cover, it ranges between 70 and 40 percent in the south and north respectively. The transition from winter to positive temperatures typically occurs between April 5 and 10 in the northern part and between March 20 and 30 in the southern part, although it may be slightly delayed in higher elevated areas. Spring warming arrives earlier in the western parts of the region compared to the eastern parts, with a difference of approximately 15 to 20 days in the onset and conclusion of spring. The change in average daily temperatures crossing 0ºC takes place around October 20-25 in the north and November 5-10 in the south. The warm phase of the year lasts for an average of 200 to 230 days, with July being the warmest month. In July, the typical monthly temperature ranges from +20ºC in the north to +25ºC in the south, with slightly lower temperatures in higher elevated areas [33].
Based on the WQI, it was determined that none of the lakes were in the first class (>50), which is “highly suitable water” for drinking. Only 4.6% of the lakes were determined to have water with a quality between 50 and 100, indicating that considerable treatment is still necessary before the water can be used for drinking. However, 47.7% of the lakes included in the study had water quality ratings between 100 and 200, which also suggests that water in this category needs to be treated before being consumed. Additionally, 11% of the other lakes were categorized as having “water unsuitable for drinking” (>300), while 36.7% of the lakes under examination had “very poor water” (class 200-300). In a study conducted by Marselina et al. [34], the water quality of the Citarum River was assessed using the WQI method, resulting in varying grades from ‘Fair’ to ‘Bad’. During periods of low rainfall, the WQI values ranged from 38.212 to 60.903, while in months with higher precipitation, the range was between 49.089 and 62.348. The WQI for dry years varied from 42.935 to 65.696, whereas for wet years, it ranged from 39.002 to 58.898. Each monitoring station provided data within the range of 41.458 to 61.206, and the yearly data varied from 35.920 to 58.713 for each monitoring period. The surface water quality in the Karaganda region is a matter of significant importance for the region’s environmental sustainability and the well-being of its inhabitants. The region’s surface water resources, including rivers, lakes, and reservoirs, are subject to various natural and anthropogenic influences. Industrial activities, agriculture, and urbanization can introduce pollutants and contaminants into the water bodies, potentially impacting their quality [35]. Efforts have been made to monitor and assess the surface water quality in the Karaganda region through regular sampling and analysis. These assessments consider parameters such as pH levels, dissolved oxygen, turbidity, nutrient concentrations, and the presence of pollutants. By monitoring and evaluating surface water quality, stakeholders can identify areas of concern, implement appropriate management strategies, and work towards maintaining and improving the overall health of the region’s water bodies [36]. It is crucial to continue monitoring and implementing effective water management practices to preserve the quality and sustainability of the surface water resources in the Karaganda region for future generations [37].
The implementation of Integrated Water Resources Management (IWRM) in the Karaganda region involves various aspects of water resources governance. These aspects encompass political, social, economic, and administrative structures [38]. In terms of political aspects, this includes the involvement of political systems and institutions in decision-making and policy development related to water resources management. It encompasses the establishment of water management committees, the formulation of water-related laws and regulations, and the allocation of responsibilities among different government bodies [39]. The social aspects of water resources governance focus on engaging and involving various stakeholders, including local communities, water users, and non-governmental organizations. This involves public consultations, awareness campaigns, and the inclusion of diverse perspectives in water management processes [40]. The economic aspects of water resources governance in IWRM implementation pertain to financial mechanisms and incentives designed to ensure the sustainable and efficient use of water resources. This includes the implementation of water pricing mechanisms, cost-recovery approaches, and the promotion of water-saving technologies and practices [41]. The administrative aspects involve the establishment of administrative structures and institutions responsible for managing and coordinating water resources activities. This includes the creation of water management authorities, monitoring and enforcement mechanisms, and capacity-building initiatives for water resource professionals [42]. In the specific context of the Karaganda region, the implementation of IWRM has likely led to the development and strengthening of these governance aspects. The social aspects involve the participation of local communities and water users in decision-making processes and the inclusion of their traditional knowledge and practices. The economic aspects focus on sustainable financing models for water infrastructure and promoting water-efficient practices in agriculture and industry. The administrative aspects address challenges related to enforcement, monitoring, and coordination among different stakeholders involved in water resources management. Overall, the water resources governance aspects of the IWRM implementation in the Karaganda region aim to ensure the sustainable and integrated management of water resources, taking into account political, social, economic, and administrative considerations [43]. However, there are numerous challenges to implementing IWRM efficiently in the Karaganda region. These obstacles include conflicting water usage and competing interests among stakeholders, creating a complex situation of water needs and allocations. Effective coordination and collaboration among stakeholders are required to balance these conflicting objectives and ensure fair access and sustainable use of water resources. Sigalla et al. [44] emphasized the growing significance of multi-stakeholder platforms in addressing complex and intersectoral issues related to natural resources management. The inclusion of various stakeholders in water resources management has become integral to promoting sustainable practices in this field. Climate change impacts, such as altered precipitation patterns, increased drought frequency, and shifting temperature regimes, further complicate water management efforts. Adapting strategies to address these changes is crucial. Insufficient technical capacity and inadequate infrastructure hinder IWRM implementation. Limited water storage facilities, outdated irrigation systems, and weak monitoring networks impede efficient water distribution and management. Improving infrastructure, providing technical support, and enhancing capacity-building programs are necessary for successful IWRM implementation. Financial constraints and funding shortages pose additional challenges. Investments are needed in infrastructure, monitoring systems, and institutional capacity building, requiring financial support from both public and private sources. Governance and stakeholder involvement in decision-making processes also present challenges. Engaging various stakeholders, including local communities, government agencies, and water user groups, can improve transparency, accountability, and ownership of water management projects. Addressing these challenges requires collaborative efforts involving governmental agencies, water users, and civil society organizations. By recognizing and addressing these difficulties, the Karaganda region can make significant progress in implementing IWRM principles and achieving sustainable water management practices.
The fundamental essence of IWRM implementation revealed that, in the study, the principal features of IWRM, namely stakeholder participation, ecosystem protection, and water quality management, received the lowest evaluations, with an average score ranging from 2.4 to 2.8. It should be noted that IWRM adopts a comprehensive and integrated approach to managing water resources, considering the interactions between different water uses and sectors, such as agriculture, industry, domestic, and environmental needs. IWRM emphasizes the involvement of all relevant stakeholders, including government agencies, local communities, NGOs, private sector entities, and indigenous groups, in the decision-making process related to water management. IWRM aims to promote sustainable development by ensuring the equitable and efficient use of water resources to meet current needs without compromising the ability of future generations to meet their own requirements. IWRM recognizes the dynamic nature of water resources and advocates for flexible and adaptive management strategies that can respond to changing environmental, social, and economic conditions. IWRM considers the hydrological basin as the primary unit for planning and management, recognizing that water resources and their interconnections are best understood and managed at the watershed or basin level. IWRM involves the allocation and prioritization of water resources among competing uses and users, aiming to balance the needs of different sectors while maintaining ecological integrity. IWRM acknowledges the importance of preserving the ecological health of water systems, promoting the sustainable use of water for both human and ecosystem needs. IWRM emphasizes the protection and improvement of water quality, addressing issues related to pollution, contaminants, and the health of water bodies. IWRM seeks to build resilience in water systems to cope with the impacts of climate change, such as increased variability in rainfall patterns, rising temperatures, and more frequent extreme weather events. IWRM encourages the exchange of data, information, and knowledge among stakeholders to support informed decision-making and foster cooperation in water management. By integrating these features, IWRM strives to achieve efficient, equitable, and sustainable water resource management at local, regional, and global levels.
Conclusions
The study focused on the examination of the water balance in the Karaganda region, which faces challenges due to its unfavorable geographical location and changing climate. This necessitates the need for hydrological monitoring. The study estimated the natural water losses from lakes and the region’s territory throughout the year and compared them with the total water inflow. A comprehensive analysis was conducted, considering 119 lakes and 12 rivers within the region and adjacent basins. Several annual indicators were calculated, including water inflow from precipitation, underground sources, river inflow, evaporation from surface waters, evaporation from snow cover, evaporation from soil and plants, and river outflow beyond the region. The findings revealed that the annual flow of rivers into the lakes of the Karaganda region and rivers leaving the territory was relatively low, accounting for 0.935% and 3.031% respectively. This can be attributed to the scarcity of water bodies in the region. In the water balance of the Karaganda region, significant contributions were observed from annual precipitation, underground sources, evaporation from the surface of lakes and rivers during the warm season, and active transpiration of water by plants over a large area during the growing season. The intense evaporation processes from water and soil surfaces in the Karaganda region are primarily influenced by high air temperatures in warm months, strong winds, and relatively low air humidity. The study also found that the total evaporation from soils and water bodies exceeds precipitation, indicating that groundwater serves as the primary source for most lakes in the region. Regarding water quality, the study categorized the lakes based on their suitability for drinking purposes. None of the lakes fell into the “highly suitable water” category (>50), suggesting the need for further treatment before using the water for drinking purposes. Only 4.6% of the lakes exhibited water quality scores between 50 and 100, indicating the requirement for significant treatment. Furthermore, 47.7% of the lakes fell into the 100-200 water quality range, necessitating treatment before utilization. Additionally, 11% of the lakes were classified as “unsuitable for drinking” (>300), while 36.7% were labeled as “very poor water” (class 200-300). The results of this research provide an essential framework for effectively managing water resources in the Karaganda region and other regions around the world that share similar characteristics.
Acknowlegments
This research was funded by the Ministry of Science and Higher Education of the Republic of Kazakhstan, grant number AP14871346, “Identification of the hydrobiocenosis of Lake Big Taldykol as a factor of ecological sustainability of the ecosystem and the application of isolated bacterial cultures for water purification in the lake”.

