

Introduction
Globalization has been a significant discussion in the recent past, with the increasing interdependence of nations on trade and investments. The concept of globalization has been seen as a significant driver of economic growth and development in the modern world. However, globalization is a complex phenomenon that has numerous economic, social, and environmental implications; there has been an increasing concern about the impact of globalization on the environment over the past few decades among policymakers, academics, and the public. This concern is related to environmental degradation, which has become more pressing due to the growth of the world economy and the ever-increasing demand for natural resources resulting from extensive integration among economies [1]. In addition to these effects, globalization has also led to the expansion of international trade and the movement of goods and services across borders. This has led to increased emissions from transportation, including ships, aeroplanes, and trucks1. According to Worldbank Development Indicators (WDI), Global gross domestic product (GDP) has increased from $27.2 trillion in 1990 to $84.7 trillion in 2018, representing an increase of 212% [2]. As a result, the demand for natural resources has increased, leading to the depletion of non-renewable resources such as fossil fuels and minerals. The extraction and production of these resources have resulted in environmental pollution and degradation. Moreover, the changes in production methods and technologies have resulted in increased efficiency and productivity but have also led to environmental damage. For example, the widespread use of fossil fuels has led to increased greenhouse gas emissions, contributing to climate change. The International Energy Agency (IEA) reported that global energy-related carbon dioxide emissions reached a record high of 33.1 gigatons in 2019 [3]. The growth of industries such as manufacturing, transportation, and energy production has contributed to increased levels of pollution and environmental degradation. For example, the industrial sector is responsible for over 21% of global greenhouse gas emissions, according to Global Greenhouse Gas Emissions Data in 2021 [4].
Grossman and Krueger (1991) [2] were among the first scholars to examine the relationship between globalization and the environment, highlighting three main channels through which globalization can affect the environment: the scale effect, the technique effect, and the composition effect. The scale effect refers to the impact of globalization on the size of the economy and the level of economic activity, which can lead to changes in environmental conditions. The technique effect relates to the stringency of environmental regulations, which can be influenced by factors such as economic expansion and technological advancements fostered by trade liberalization. Finally, the composition effect measures changes in a country’s industrial makeup following trade liberalization, which can impact the country’s overall emissions. Indeed, the impact of globalization on the environment has been significant, having been driven by the scale effect, the technique effect, and the composition effect. However, in literature, studies on the impact of globalization on environmental degradation have used different approaches, including a holistic approach across measures of the globalization index or a facets approach to globalization [3-5]. The findings of these studies have been inconclusive. Some studies have shown that globalization positively impacts environmental quality, while others have found that it has a negative impact. For example, Bu et al. (2016) [6], Le and Ozturk (2020) [5], Wang et al. (2019) [7], Adebayo and Acheampong (2021) [8], Khan and Ullah (2019) [9] and Phong (2019) [10] have investigated the impact of globalization on CO2 emissions and found that globalization leads to higher CO2 emissions. Despite these findings, there are some recent studies that provide evidence for an ecological improvement effect. For example, Lv and Xu (2018) [11] have shown that economic globalization positively impacts environmental quality, while Rafindadi and Usman (2019) [12] have studied the effect of globalization on environmental degradation in South African countries and found that globalization reduced environmental degradation in the long term, possibly due to the transfer of advanced technologies and technical knowledge from more developed countries.
Indeed, the impact of globalization on the environment is a complex and multifaceted issue that depends on several factors [8, 13]. The mixture of findings in previous studies have created gaps that need to continue to be filled with extended research on a large sample with different approaches to understand the complex relationship between globalization and the environment. By reviewing the literature and analyzing the data, the paper seeks to provide a deeper understanding of the impact of globalization on the environment and the mechanisms through which these impacts occur. In this study, we examine the relationship between globalization and environmental degradation, focusing on the causes and needed implications of this phenomenon. This study provides additional evidence to explain the conflicting findings in previous studies. The approach of this study is empirically based on the percentile regression method, which allows us to clearly delineate the influence of aspects of globalization on environmental degradation at different levels, providing an interesting picture. Furthermore, a large sample of 115 countries, both developed and developing, was sampled in order to obtain generalized results. Therefore, this study provides theoretical and practical policy implications based on detailed results, helping national administrators reframe policies to balance the interests between globalization and environmental issues. It is essential to address these issues to promote sustainable development and ensure that future economic growth is not at the expense of the environment.
This study is organized as follows: Section 2 provides an empirical literature review. Section 3 presents the econometric models, variables, and data. Section 4 details experimental results and findings. Finally, Section 5 gives the implications and conclusions.
Literature Review
After the groundbreaking research by Grossman and Krueger (1991) [2], concerns over the negative impact of economic growth and development on the environment have become increasingly prominent. A significant body of research has shown that economic activities can substantially impact the environment through various channels. One framework that has been used to understand these impacts is the “STC” framework, which breaks down the effects of economic activity into three primary channels: the scale effect, the technique effect, and the composition effect [14]. The scale effect refers to the overall increase in economic activity that comes with economic growth. As countries become wealthier and more developed, they tend to consume more resources and produce more waste, leading to increased pollution and other negative environmental impacts. The technique effect, on the other hand, refers to the impact of changes in production technology on the environment. For example, developing more efficient and less polluting production techniques can reduce environmental damage, while adopting more resource-intensive or polluting technologies can exacerbate it. Finally, the composition effect refers to changes in the mix of goods and services produced by an economy. Some products, such as industrial goods, tend to be more resource-intensive and polluting than others, such as services or agricultural products. As economies grow and develop, they often shift towards more industrial and service-based production, which can lead to increased environmental damage. The STC framework provides a useful framework for understanding the complex relationships between economic activity and environmental impacts. By breaking down the effects of economic activity into these three channels, researchers can better understand which types of economic activity are most likely to have negative environmental impacts and which strategies may be most effective for mitigating those impacts. Thus, the STC framework has become an important tool for policymakers and researchers alike in the effort to promote sustainable economic development and protect the environment.
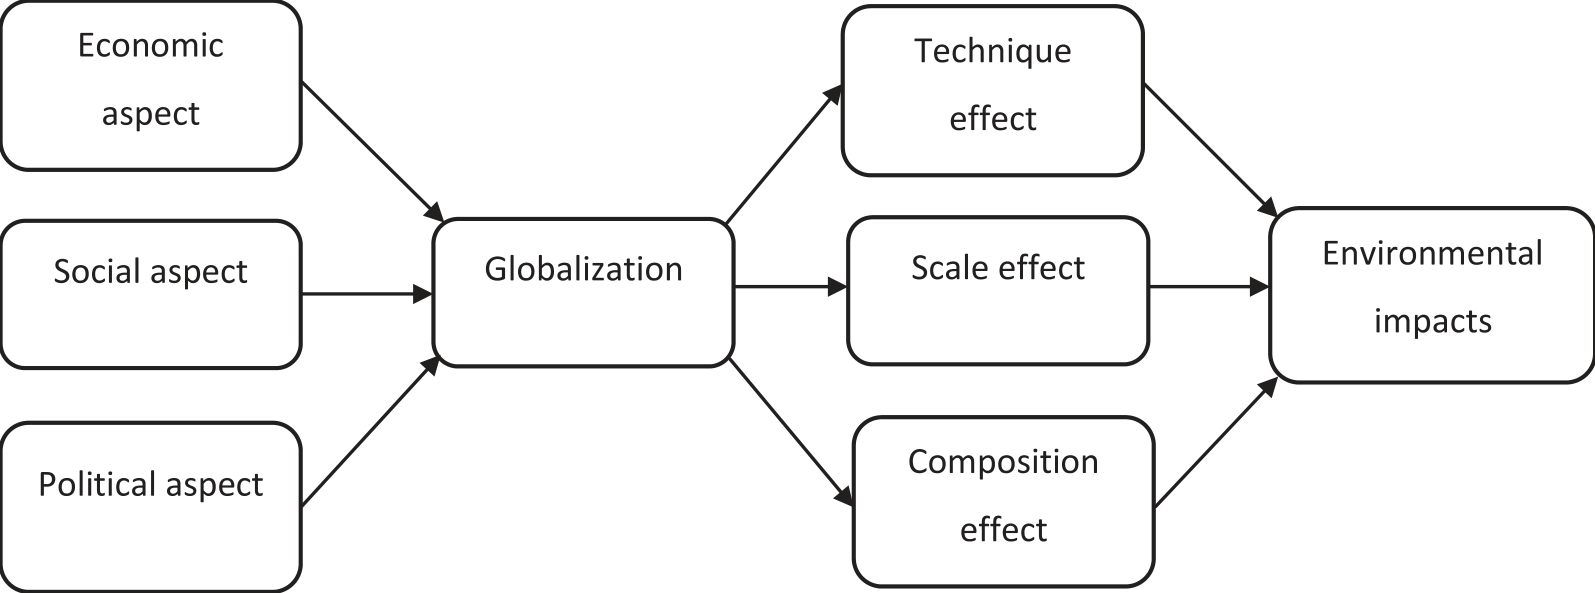
Dreher (2006) [15] proposed a tripartite framework encompassing economic, social, and political dimensions (illustrated in Fig. 1). Economic globalization evaluates the tangible movement of trade, Foreign Direct Investment (FDI), and Foreign Portfolio Investment (FPI), along with the associated regulatory constraints. Social globalization entails factors like interpersonal interactions, information dissemination, and cultural affinity. This is quantified through metrics like international telephone traffic, cross-border transfers, tourism rates, foreign population ratios, international correspondence, as well as indicators related to internet and television accessibility. The political aspect of globalization is represented by indicators such as embassy counts, involvement in international organizations, participation in UN Security Council missions, and the tally of international treaties endorsed. Both Dreher (2006) [15] and Gygli et al. (2019) [16] affirm that overall globalization and its individual dimensions are rated on a scale of 0 to 100. Higher index values correspond to heightened levels of globalization.
Indeed, Bu et al. (2016) [6] conducted a study analyzing the effects of globalization on climate change in 166 countries from 1990 to 2009, using FEM and 2SLS methods. They found that globalization had a significantly positive impact on CO2 emissions, suggesting that countries with higher levels of globalization will exhibit higher environmental degradation. However, the authors acknowledged that while OECD countries experience a decrease in CO2 emissions, non-OECD countries experience an increase in environmental degradation due to the lack of access to cleaner technologies, production methods, and environmental regulations. Furthermore, it is plausible that developed countries relocate heavily polluting industries to non-OECD countries, which aligns with the pollution haven hypothesis. Meanwhile, Le and Ozturk (2020) [5] also analyzed the impact of globalization on CO2 emissions in 47 developing economies from 1990 to 2014, using various estimators. Their findings demonstrate that globalization leads to higher CO2 emissions, which supports the scale effect hypothesis, as globalization lowers trade barriers and facilitates economic activities that degrade the environment. In addition, Wang et al. (2019) [7] examined the relationship between globalization and CO2 emissions in OECD countries using panel data from 1990 to 2015 and PMG estimation. Their study found that a 5% increase in globalization may result in a 0.498% increase in CO2 emissions, potentially due to increased FDI flows and outdated technology in the production process, contributing to higher CO2 emissions.
Similarly, Khan and Ullah (2019) [9] conducted a study in Pakistan from 1975 to 2014 to investigate the correlation between globalization and CO2 emissions. Their empirical analysis, which employed ARDL techniques, found that a 1% increase in economic, social, and political globalization was associated with a 0.38%, 0.11%, and 0.19% increase in CO2 emissions, respectively. The authors argued that higher levels of globalization result in increased free trade, leading to environmental degradation, such as air, water, and soil pollution, as well as the depletion of non-renewable and slowly renewable resources. Similarly, Phong (2019) [10] examined the impact of globalization on CO2 emissions in selected ASEAN countries from 1971 to 2014, using FEM and REM. The study discovered that globalization led to an increase in CO2 emissions, with the economic dimension having the most significant impact. Furthermore, the social and political dimensions of globalization had an insignificant impact on lowering and raising CO2 emissions, respectively. These findings suggest that globalization may reduce trade and investment barriers, increasing economic activity and energy consumption, ultimately resulting in lower environmental quality, which aligns with the scale effect hypothesis of globalization.Using the aspects of globalization, Xu et al. (2018) [17] conducted a study using ARDL and VECM techniques to examine the role of globalization in reducing environmental degradation in Saudi Arabia from 1971 to 2016. The authors found that while globalization did not significantly impact environmental degradation, economic globalization had a significant positive relationship with it in the long term. This suggests that foreign firms in Saudi Arabia have not adopted environmentally friendly production methods, leading to higher energy usage and CO2 emissions. Destek (2019) [18] explored the impact of economic, social, and political globalization on environmental pollution in CEEC countries from 1995 to 2015 using AMG estimation. They found that globalization positively affected environmental degradation, with significant variation among different dimensions of globalization. Political globalization has a negative relationship with environmental pollution, and they suggest the need for governments to increase the number of agreements signed to reduce environmental pollution.
While research lines indicate that globalization brings environmental degradation effects, a number of recent studies provide evidence for an improvement effect. For instance, Lv and Xu (2018) [11] examined the effect of economic globalization on CO2 emissions in 15 emerging countries from 1970 to 2012. Their findings showed that a 1% increase in economic globalization reduced CO2 emissions by -0.82% and -0.11% in the short and long term, suggesting that economic globalization positively impacts environmental quality. Rafindadi and Usman (2019) [12] studied the effect of globalization on environmental degradation in South African countries from 1971 to 2014. Their analysis found that globalization reduced environmental degradation in the long term, possibly due to the transfer of advanced technologies and technical knowledge from more developed countries, leading to the adoption of clean energy and the strengthening of environmental policies. Similarly, Zaidi et al. (2019) [19] determined the dynamic linkages between globalization and CO2 emissions in the Asia Pacific Economic Cooperation from 1990 to 2016. Their results showed that globalization helped reduce CO2 emissions by bringing in energy-efficient technology and fostering economic growth with minimal environmental harm. However, Aluko et al. (2021) [4] indicated that while overall and economic globalization had negative effects on environmental degradation, other dimensions of globalization, such as social and political aspects, had no significant relationship with the environment when exploring the influence of globalization’s aspects on the environmental degradation of 27 selected industrialized countries from 1991 to 2016. They argued that globalization stimulates foreign direct investment and international trade, leading to the transfer of clean and energy-efficient technologies.
In summary, various studies have employed diverse methodologies, such as a comprehensive approach considering the globalization index or specific aspects of globalization. These distinct approaches have produced a range of conflicting outcomes. By applying quantile regression to aspects of globalization, this study provides more empirical evidence for the heterogeneous effect of globalization on the environment.
Research Data
Table 1 demonstrates the variables, measures, and data sources that are used in this study. The data collection initially covers annual frequency data for countries worldwide from 1990 to 2019. However, some countries with a lack of data available and continuous for any of the variables in our model are excluded. We thus have an unbalanced panel data of 115 countries, including 36 developed and 79 developing countries. Moreover, the GI is collected from the Swiss Federal Institute of Technology, as suggested by Dreher (2006) [15] and Gygli et al. (2019) [16]. The dimensions of globalization include economic, social, and political globalization. The data of other variables in our model are collected from the World Bank Database.
Table 1.
Variables, measures and source.
Empirical Model Construction
The IPAT model was first introduced by Ehrlich and Holdren (1971) [20] to examine the interplay between the population, human welfare, and the environment. It comprises population, affluence, and technology variables. However, York et al. (2003) [21] and Shahbaz et al. (2016) [22] have noted that the IPAT model does not assess the impact of several factors. Therefore, the STIRPAT model can be considered an enhanced version of the IPAT model, as it takes into account additional factors:
where, I, P, A and T proxy the environment, population, affluence, and technology, respectively, while β0 is the constant. β1, β2 and β3 are the estimated parameters using statistical techniques. We take logarithms the Equation (1) for testing as follows:
In the original STIRPAT model, P is the population (urbanization), A shows the affluence (economic development), and T denotes the technology (renewable energy consumption). We have modified and extended the STIRPAT model based on the prior studies by adding FDI and globalization to assess the influence of globalization on environmental quality. The empirical estimation may be as follow:
Moreover, the previous research provides empirical evidence that globalization’s dimensions impact environmental quality differently. Then the study separates globalization into three dimensions of globalization, including economic (EI), social (SI), and political (PI) globalization, proposed by KOF Swiss Economic Institute. Then, regression of the following equations are written:
where LnI is measured by CO2 emissions (per capita), urbanization, Urban, is calculated by the ratio of the urban population to the total population. Renew is renewable energy consumption and is the ratio of renewable energy consumption to total energy consumption. Foreign direct investment, FDI, is proxied by the ratio of foreign direct investment inflows to GDP. Gdppc reflects economic development, which is calculated by taking logarithms of GDP. Class is a dummy variable that shows that countries may be developing countries or developed countries. Globalization, GI, is measured by Dreher (2006) [15] (2006) and Gygli et al. (2019) [16] studies. Also, εit is error term. All above variables were used in previous studies related to environmental economic [23-25].
Research Method
This study employed panel data as research data, and various estimation methods can be utilized to regress panel data, including the OLS regression. However, instead of the OLS estimation utilized in previous studies, this study chose to utilize quantile regression (QR) to estimate the impact of globalization on environmental quality. The primary reason for this selection is due to QR’s advantages over the OLS regression, which include normal distribution, homoscedasticity, and the conditional mean of the dependent variable. The OLS method requires the dependent variable’s distribution to be normal ([26]), while QR can be a regression of the estimated parameters for each quantile of the dependent variable ([27]), and thus does not require the assumption of a normal distribution. In addition, while homoscedasticity is an assumption in the OLS method, the estimated parameters in QR do not rely on standard deviation, and therefore, the variance problem will not impact the goodness of fit of the model estimated by QR ([28, 29]). Hence, there is no need to satisfy the homoscedasticity assumption as in the OLS method. Moreover, the OLS method regresses the mean values of the dependent variable for each independent variable, and thus, outliers need to be eliminated before employing the OLS method. However, QR estimates the relationship between independent variables and the dependent variable’s conditional quantiles rather than the dependent variable’s conditional mean. Therefore, QR provides a more comprehensive picture of the impact of independent variables on the dependent variable, and its results are not affected by outliers, as the OLS method is ([28, 29]). Moreover, Koenker and Bassett (1978) [30] described the quantile regression by the following Equation:
The Equation to estimate the response variable yi for observation i, given the covariate vector xi is represented as yi = f(xi) + πi, where πi is the error term. The focus of quantile regression is to estimate the nth conditional quantile of yi given xi, denoted as Qn(yi|xi). This quantile refers to a specific point along the cumulative distribution, where n denotes the quantile number, and the subscript i = 1, 2, …, n represents the individual observation index. On the other hand, the classical linear function of OLS regression estimates the conditional mean E(y|x|) = μy|x = α + xi'β. To distinguish between the two methods, we adopt the notation of Cameron and Trivedi (2005) [31]. For a chosen quantile n, where 0<n<1, the quantile regression estimators minimize the following function:
The function shown is subject to optimization and aims to find the nth quantile regression estimators (β n) that minimize the weighted sum of residuals between the observed values (yi) and fitted values (xi'β n) . R indicates the dimensions of the independent variables (K). In this optimization problem, the first term in Equation (2) assigns a weight of y to points located below the quantile regression line, while the second term assigns a weight of 1 - n to points located above the line. The estimated covariance matrix S is calculated using:
The probability density of the error term ε^n at the nth quantile of the error distribution is evaluated by fεn(0) [29]. To obtain an estimated standard error for the coefficient estimator β ̂n, the corresponding diagonal element of the covariance matrix S is square-rooted. From the above advantages, our study uses QR instead of the OLS method to estimate the influence of globalization on environmental quality.
Results and Discussion
Table 1 shows our models’ descriptive statistics (mean, standard deviation, minimum and maximum) of variables. The mean value for CO2 emissions per capita is 4.32. The lowest value of CO2 emissions is per capita 0.03 (Congo), and the highest is 30.40 (Kuwait). For dimensions of globalization, the mean value of KOFGI is 0.64; meanwhile, its min and max are 0.30 and 0.91, indicating that the globalization level strongly fluctuates in the sample. Regarding renewable energy consumption, Kuwait uses the least amount of renewable energy with a value of RENEW of 0.0000, whereas Paraguay achieved the highest ratio of renewable energy consumption of 0.89.
According to Fig. 2, we display the histogram of the dependent variable CO2PC to clarify the variables’ distribution and choose the suitable method that estimates globalization’s effect on environmental quality. Fig. 2 shows a histogram of CO2PC, and the distribution of CO2 emissions is positively skewed and has a heavy left tail. Such a fact further reinforces the necessity of quantile regression. To confirm that QR is an appropriate regression method for our data, we conduct some tests to check whether the dependent variable in our model has a normal distribution. Shapiro – Wilk, Shapiro – Francia, Skewness, and Kurtosis tests are used.
Table 3 presents these tests, in which the null hypothesis is that the distribution of the variable is normal. We use 04 tests, including Doornik-Hansen, Shapiro-Wilk, Shapiro-Francia, and Skewness/Kurtosis, to clarify the distribution of the dependent variable. The Doornik-Hansen test for multivariate kurtosis takes computing time roughly proportional to the number of observations and shows Chi-square statistics of 2773 with a p-value of 0.0000. Regarding the Shapiro test, the Shapiro – Wilk and Shapiro – Francia test statistics reported under W and W’, respectively, are 0.798 and 0.798. The P-values of the two tests are approximately equal to 0.0000. Finally, Skewness/Kurtosis test has a statistics value of 935.23 and a p-value of 0.0000. Based on the results of our tests, we may reject the null hypothesis of tests, which reflects that environmental quality may not be normally distributed.
Table 2.
Descriptive statistics.
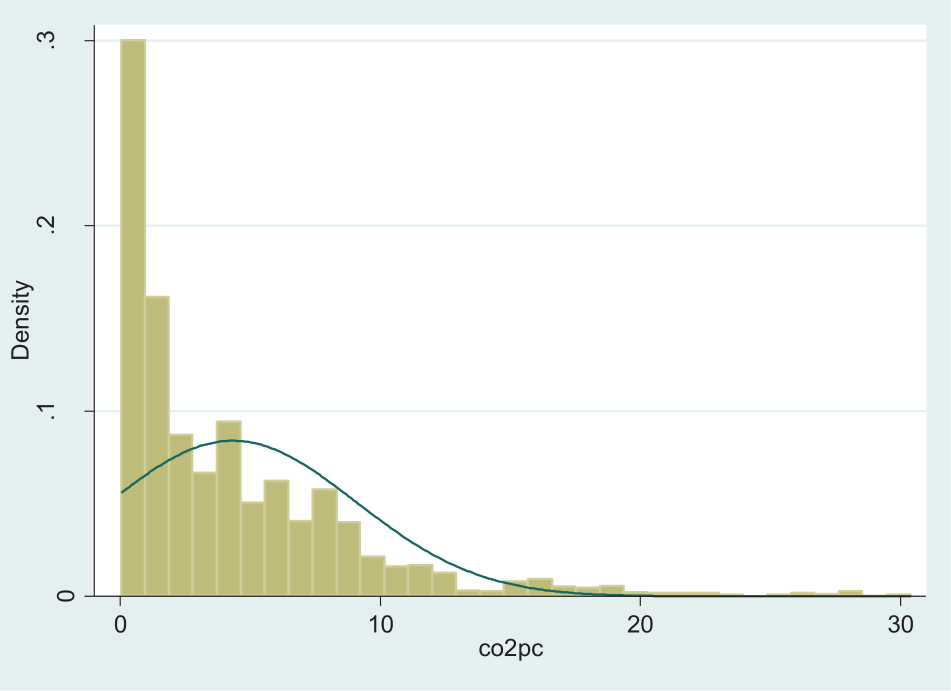
Table 4 shows the results of quantile regressions for the effect of globalization on environmental quality at the 10th, 25th, 50th, 75th, and 90th percentile. We find that the effect of globalization on CO2 emissions is significantly positive at a 10% level at lower and middle quantiles (10th, 25th, and 50th), but this impact turns from positive to negative at the upper quantile (75th and 90th); that is, the coefficient of globalization at 75th, and 90th percentile are -1.73, and -27.90, respectively. In particular, in countries with high emissions (75th, and 90th percentile of CO2PC), globalization is likely to help improve environmental quality. However, the opposite may not be true for low-emission countries (10th, 25th, and 50th percentile of CO2PC), where globalization worsens environmental quality with 4.92, 5.26, and 4.15 coefficient of globalization at 1% significance. This finding indicates that the effect of globalization on environmental quality is heterogeneous across CO2PC conditional distributions. Nevertheless, it is necessary to check whether or not these differences are statistically significant. Thus, we employ inter-quantile regression to test for slope equality across quantiles ([30]). Notably, we implement inter-quantile regressions between upper quantiles (the 75th and 90th) and lower quantiles (the 10th and 25th), i.e., Q(90/10) = Q0.90(y)-Q0.10(y) and Q(75/25) = Q0.75(y)-Q0.25(y). Based on the results presented in Table 3, we realize that the coefficients of globalization are significantly different, demonstrating evidence of heterogeneity in the influence of globalization on environmental quality. The bootstrapped cluster standard errors (in parentheses) were obtained with 100 bootstrap replications.
Besides, QR also shows that the effect of renewable energy usage on environmental quality is statistically significant and negative at all percentiles except for the 90th percentile with 1.13 coefficient. This effect implies that renewable energy consumption may help countries with a lower and middle-level CO2PC improve the environmental quality because of the cleanliness and inexhaustibility of renewable energy. This may be contradictory but was found in previous studies ([32]) - with the argument that energy consumption did not reach a level that significantly contributes to emissions reduction. Also, CO2 emissions have also been found to have a positive relationship to GDP per capita across all quantile levels at 1% significance, suggesting that increases in GDP per capita are largely responsible for emissions, a result of natural resource extraction and consumption ([33] However, the coefficients of the Class variable are significantly negative among percentiles, implying that developing countries have lower CO2 emissions than developed ones. Conversely, foreign direct investment inflows significantly positively impact lower quantiles (10th and 25th). This effect shows that foreign direct investment inflows may degrade the environment by increasing CO2 emissions in countries with lower CO2PC. At the upper quantiles (75th and 90th), FDI and CO2PC have a significant negative relationship, reflecting high-polluting industries from low-middle-income nations.
Table 3.
Checking Assumptions of Normality.
| Test | Statistics | P-value |
|---|---|---|
| Doornik-Hansen | 2273 | 0.0000 |
| Shapiro-Wilk | 0.798 | 0.0000 |
| Shapiro-Francia | 0.798 | 0.0000 |
| Skewness/Kurtosis | 935.23 | 0.0000 |
Table 4.
Globalization and Environmental Quality: quantile regressions.
Regarding the problem of urbanization (URBAN), we find a significant negative correlation between it and environmental degradation at the 50th quantile. However, this relationship turns from negative to positive from the 75th percentile. It shows that while in countries with a middle level of CO2PC, urbanization increases the environmental quality, in countries with a higher level of CO2PC, urbanization may lower forest areas, which is related to a lousy carbon sequestration process; as a result, CO2 emissions increase more.
We next explore heterogeneity in the impacts of the independent variables in Fig. 3. Y-axis is the percentage of independent variables; meanwhile, X-axis is the quantile of the value measured by CO2PC. Estimates are presented for an ensemble of quantile regressions for CO2PC. For the influences of the independent variables, we estimate five separate quantile regressions for the quantiles, q, including the 10th, 25th, 50th, 75th, and 90th percentile. The horizontal in the figure shows the quantile scale, and the vertical shows the effects of the independent variables on CO2PC (Fig. 3). The dashed horizontal line in the figure shows the OLS estimate from the conditional mean regression. The coefficients of the OLS method do not vary along the distribution of a dependent variable (quantiles).
Fig. 3 shows that the QR point estimate lies outside the confidence interval for OLS regression, implying that the effect of globalization on environmental quality may not be constant across the distribution of CO2PC. For example, in the figure of the relationship between the quantile of GI and CO2PC, it can be seen that at the 10th percentile, the magnitude effect of GI is 4.9189; however, from the 75th percentile, this effect decreases to -1.7303. Even up, at the 90th percentile, a 1% increase in GI may lead to a 27.90% decrease in CO2PC. At the same time, the effect of GI on CO2PC based on OLS regression has a value of -7.1031, which is unchanged across quantiles of CO2PC. In other words, a significant difference between the estimated QR and OLS coefficients at all percentiles for the relationship between globalization and environmental quality. Furthermore, previous empirical evidence shows that the relationship between globalization and environmental quality depends on the dimensions of globalization. These dimensions include economic, social, and political globalization. Hence, we separate the overall globalization index into three dimensions of globalization and evaluate the influence of the dimensions of globalization on environmental quality.
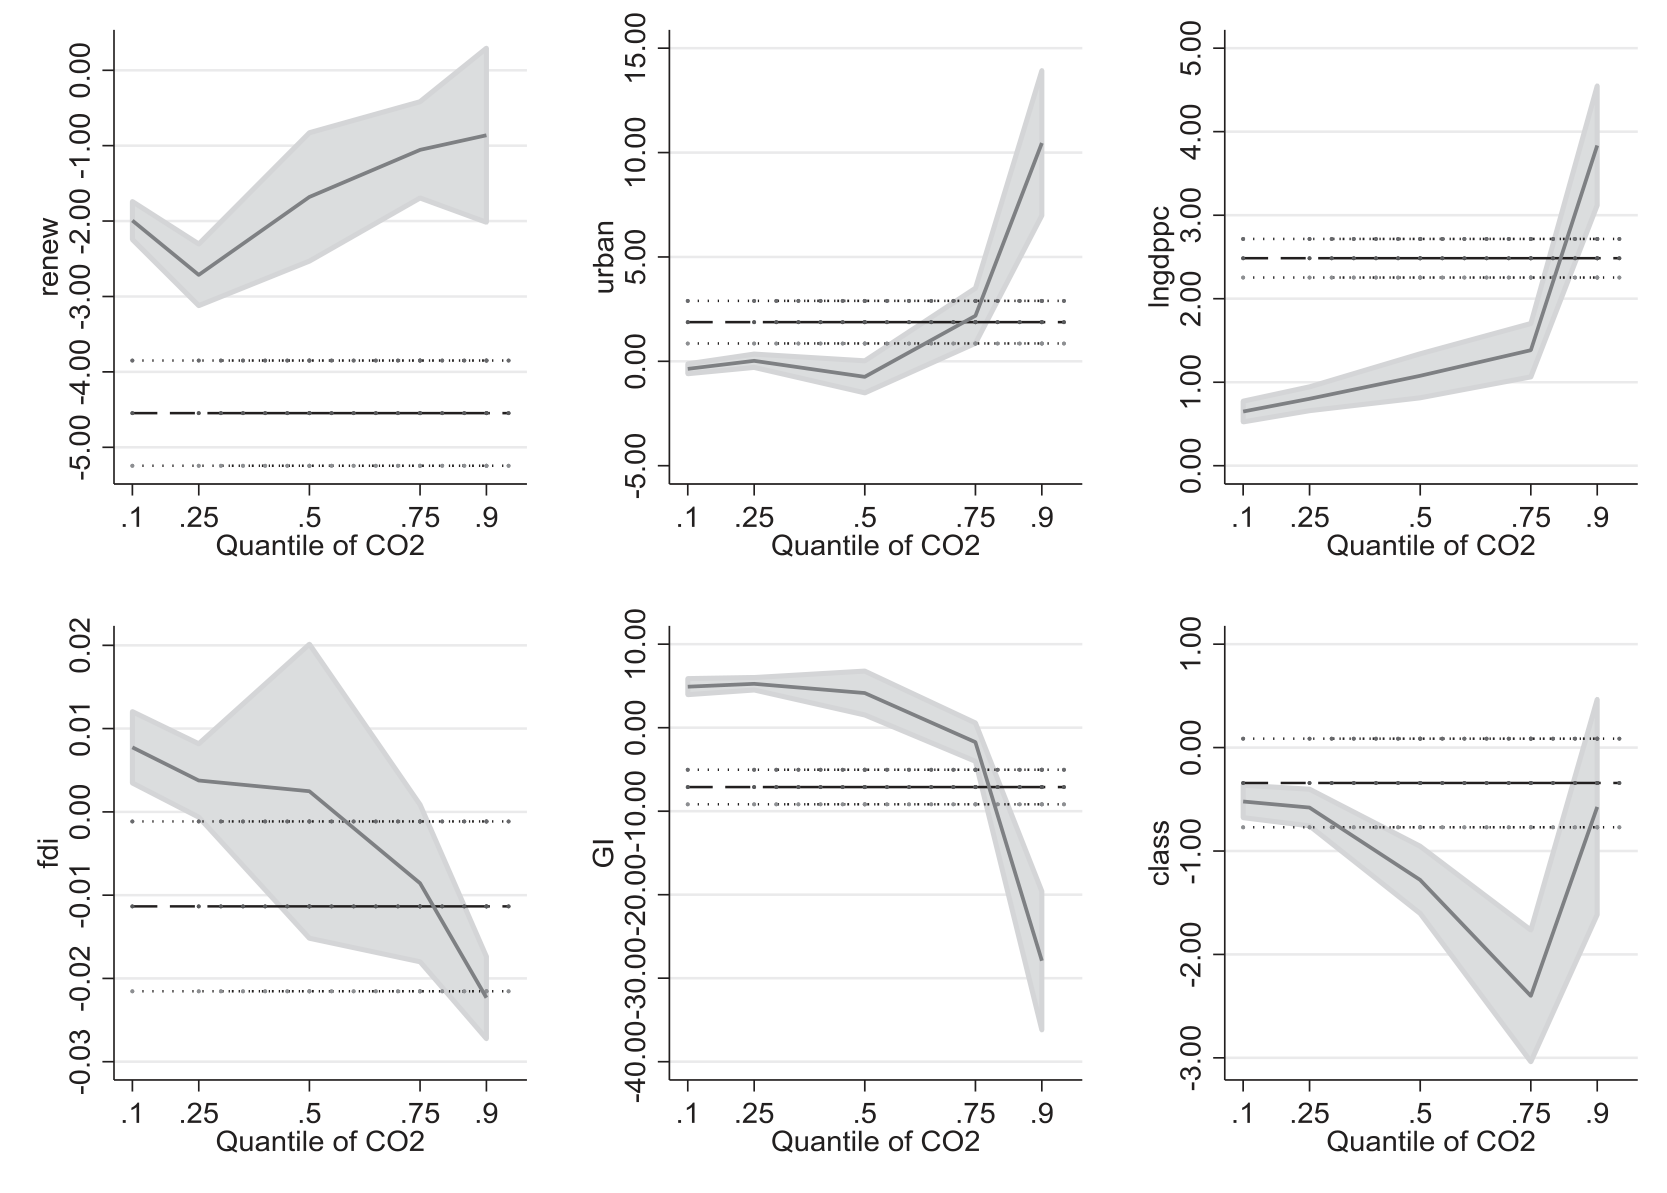
Table 5 shows the impact of economic globalization on CO2 emissions is significantly positive at a 10% level at lower and middle quantiles (10th, 25th, and 50th), but this impact turns from positive to negative at the upper quantile (90th); that is, the coefficient of economic globalization at 90th percentile are -2.4198. This finding shows that in countries with lower and middle levels of CO2PC, economic globalization may increase CO2 emissions, whereas in countries with a higher level of CO2PC, economic globalization may reduce environmental degradation. This finding indicates that the effect of economic globalization on environmental quality is heterogeneous across CO2PC conditional distributions. Similar to overall globalization, we run inter-quantile regressions Q(90/10) and Q(75/25) and find that the coefficients of economic globalization are significantly different, demonstrating evidence of heterogeneity in the influence of economic globalization on environmental quality. Indeep, we argue that a higher level of economic globalization is related to higher integration of circuits of goods, production, and money across national borders. This reflects that globalization’s economic dimension may increase development by promoting import, export, and production activities. Moreover, economic globalization decreases trade barriers, leading to higher FDI inflows. Consequently, these two mechanisms likely boost energy demand, emitting more CO2 emissions. The positive influence of economic globalization on environmental degradation has a great deal of similarity with the empirical evidence found by some prior studies ([8-10, 17, 18, 34]). However, in countries with higher levels of CO2PC, economic globalization may help these countries decrease CO2 emissions, improving environmental quality. Economic globalization stimulates FDI and international trade. On a hand, FDI and international trade may bring energy-efficient technology and thus increase innovative productions and new production techniques that foster economic development with minimum environmental harm as an expectation of technique effect. On the other hand, FDI and international trade make countries change the stringency of environmental regulation in response to growth or the political climate surrounding regulation. This is recognized by the significant negative effect of FDI on CO2 emissions at 90th percentile. Previous studies including Lv and Xu (2018) [11], Aluko et al. (2021) [4], Jahanger et al. (2022) [35] found a negative relation between economic globalization and CO2 emissions.
Table 5.
Globalization’s dimensions and Environmental quality: Quantile regressions.
Concerning social dimensions of globalization, Table 5 shows the impact of social globalization on CO2 emissions is significantly positive at a 10% level at lower quantiles (10th and 25th), but this influence turns from positive to negative at the middle and upper quantiles (50th and 90th); that is, the coefficient of social globalization at 50th and 90th percentile are -1.8931 and -5.3924, respectively. This finding shows that in countries with lower levels of CO2PC, social globalization may increase CO2 emissions, whereas, in countries with middle and higher levels of CO2PC, social globalization may reduce environmental degradation. Besides, based on the results of inter-quantile regressions Q(90/10) and Q(75/25), we find that the coefficients of social globalization are significantly different, demonstrating evidence of heterogeneity in the influence of social globalization on environmental quality.
On the one hand, social globalization has a significant positive relationship with CO2 emissions at a 5% level at the 10th and 25th percentile, implying that in countries with lower levels of CO2PC, social globalization may be positively related to CO2 emissions. This finding is consistent with empirical evidence from Jahanger et al. (2022) [35]. We argue that following the scale effect of globalization, social globalization leads to higher outside information flows, stimulating the demand for electronic equipment usage. Thus, an increase in demand may lead to higher energy consumption; deteriorating environmental quality. On the other hand, social globalization significantly negatively influences CO2 emissions at a 5% level at the 50th and 90th percentile, suggesting that an increase in the social dimension of globalization reduces CO2 emissions in countries with middle and high levels of CO2PC. This effect is similar to studies of Khan and Ullah (2019) [9] and Suki et al. (2020) [36]. This impact is similar to the expectation of the technique effect of globalization, and we intercept that the social dimension of globalization may boost personal contacts and information flows, which stimulate more spillovers of green technologies from developed to developing countries, improving environmental quality. Fig. 2 shows that the QR point estimate lies outside the confidence interval for OLS regression, excluding the 90th percentile, implying that the influence of social globalization on environmental quality may not be almost constant across the distribution of CO2PC. In other words, a significant difference between the estimated QR and OLS coefficients at the 10th, 25th, 50th and 75th percentiles for the relationship between social globalization and environmental quality.
Finally, Table 1 presents the influence of political globalization on CO2 emissions is significantly positive at a 10% level at lower quantiles (10th and 25th), but this influence turns from positive to negative at the middle and upper quantiles (50th and 90th); that is, the coefficient of political globalization at 50th and 90th percentile are -1.1762 and -10.1061, respectively. This finding shows that in countries with lower levels of CO2PC, political globalization may increase CO2 emissions, whereas, in countries with middle and higher levels of CO2PC, political globalization may reduce environmental degradation. Besides, based on the results of inter-quantile regressions Q(90/10) and Q(75/25), we find that the coefficients of political globalization are significantly different, demonstrating evidence of heterogeneity in the influence of social globalization on environmental quality.
The political dimension of globalization significantly negatively affects CO2 emissions, implying that countries with higher political globalization may increase environmental quality through the reduction of CO2 emissions reduction. The findings of Destek (2019) [18], Suki et al. (2020) [36], and Farooq et al. (2022) [34] align with the outcome of the present investigation. It may be explained that international organizations may compel member states to obey their rules by raising the reputational stakes for reneging on agreements. They also create norms that define good behaviour related to the environment and sustainable development. In this case, countries with higher political globalization may implement some agreements about making higher environmental quality and sustainable development. For instance, these countries may set carbon reduction targets in their policy operations strategies, while other ones generally do not have carbon reduction targets. However, not all countries may achieve favourable environmental outcomes related to political globalization. This problem stems from the fact that international conflicts may exist between countries, so making political globalization may neither reduce environmental pollution nor facilitate the environmental well-being objectives of the associated nations, as Khan and Ullah (2019) [9] and Jahanger et al. (2022) [35] findings. Fig. 3 shows that the QR point estimate lies outside the confidence interval for OLS regression, implying that the effect of political globalization on environmental quality may not be constant across the distribution of CO2PC. In other words, a significant difference between the estimated QR and OLS coefficients at all percentiles for the relationship between political globalization and environmental quality.
Conclusions
This study examined the heterogeneous effects of globalization on environmental quality and the influence of the dimensions of globalization on CO2 emissions. The impact of economic globalization on CO2 emissions is significantly positive at lower and middle quantiles (10th, 25th, and 50th), but this impact turns from positive to negative at the upper quantile (90th). These findings suggest that economic globalization may increase CO2 emissions in countries with lower and middle levels of CO2PC but reduce environmental degradation in countries with higher levels of CO2PC. The study also found that renewable energy consumption has a statistically significant and negative impact on environmental quality, implying that renewable energy consumption may help countries with lower and middle-level CO2PC to improve environmental quality. Foreign direct investment inflows positively impact lower quantiles but have a significant negative relationship at the upper quantiles, indicating that foreign direct investment inflows may degrade the environment by increasing CO2 emissions. Besides, this study shows that urbanisation increases environmental quality in countries with a middle level of CO2PC, while urbanization may lower environmental quality in countries with a higher level of CO2PC.
The study’s insights into globalization’s effects on environmental quality and the influence of its dimensions also offer valuable policy implications. Policymakers should encourage renewable energy adoption in lower CO2PC countries, while promoting foreign direct investment in higher CO2PC nations. Urbanization’s impact should consider CO2PC levels. However, the study’s cross-sectional nature limits causal claims and focusing solely on CO2 emissions may not fully capture environmental degradation. Future research could explore broader dimensions of globalization and diverse environmental indicators to deepen our understanding of their relationship. The study highlights economic globalization’s varying impact across CO2PC quantiles and the nuanced effects of renewable energy, foreign direct investment, and urbanization on environmental quality.

