

Introduction
In recent years, due to dramatic global climate change and human disturbance, the ecosystem has been damaged and water resources have been severely unbalanced, exacerbating the frequency and severity of drought [1]. Only 3% of the global water resources are fresh water [2]. Given the rapid urbanization and industrialization, the freshwater rivers and lakes that can be directly used for irrigation are exposed to severe chemical pollution and heavy metal pollution [3]. China is a large agricultural country, and large quantities of ecological water have been consumed by agricultural production; furthermore, this process has been accompanied by a series of problems such as cultivated land pollution, impoverishment, and „counterecological” effects. The middle reaches of the Yangtze River (MRYR) are important main food-producing areas in China and they do not only undertake the mission of protecting national food security but also provide habitat, water and soil retention, and other ecological safety functions. Despite the abundance of overall water resources used in agriculture, only a small portion of those resources are used per person and per mu of cultivated land. Along with the problems of rough use of agricultural water resources and uneven allocation, the efficiency of agricultural water resources use (AWRUE) is facing a severe situation [4]. Therefore, improving AWRUE has become the key to promoting sustainable agricultural development in the main grain-producing areas (MGPA) of the MRYR.
Academic research on AWRUE started relatively early, and a series of research results have been attained in the fields of measurement methods, spatial and temporal variation, influencing factors, etc. In research themes, the focus has been mainly on industrial water use efficiency, AWRUE, and total factor water use efficiency [5-6]. Based on previous studies, this paper defines AWRUE as the ratio between the optimal use of agricultural water resources and the actual use and it focuses on the ratio between input costs related to agricultural water resources and agricultural output outcomes [7].
In terms of measurement methods, stochastic frontier analysis (SFA) [8], principal component analysis (PCA) [9] and data envelopment analysis (DEA) have been widely used [10]. Among these methods, the data envelopment analysis adopts a nonsubjective assignment method, avoiding the influence of subjective factors and can achieve multiple input and multiple output measurements; moreover, it adequately overcomes the shortcomings of the stochastic frontier method [11] and replaces it as the typical AWRUE methodology [12-13].
In the field of spatiotemporal differentiation studies, scholars have explored different methods. Maity et al. [14-15] used multivariate statistics such as factor analysis, cluster analysis and discriminate analysis to demonstrate the alteration of Damodar River water quality on a temporal and spatial scale. Zhang et al. [16] used the Mora Index and impulse response function to analyze the spatial interaction of WRUE by sector in China. Sun et al. [17] established a spatial weight matrix to discuss the spatial autocorrelation of WRUE. Many academics have turned to exploratory spatial data analysis (ESDA) techniques to study the spatial affiliations related to geographical position [18].
Numerous academics have performed in-depth studies on the elements that influence it. Collating the relevant literature, we discovered that the Tobit model can simultaneously examine many independent variables while simultaneously evaluating a single independent variable’s hypotheses. This tool was used by Alireza et al. [19] and Tong et al. [20] to examine the influencing factors of WRUE, such as resource endowment, economic level, water-saving technology, etc.
In summary, research has achieved a wealth of research results, and thus has established a strong theoretical framework for this study, but there is still an opportunity for growth in terms of research level and research depth. At present, the research on AWRUE in the main grain-producing areas is in its initial stage. In addition, the combination of static and dynamic processes is conducive to the analysis and evaluation of the evolution process of regional AWRUE. Based on this, this paper attempts to introduce the theme of AWRUE, using the static data envelopment method and dynamic Malmquist index to estimate the AWRUE of the MGPA in the MRYR during 2006-2020 and using ESDA to reveal the spatial change properties. Finally, to provide fundamental solutions for AWRUE in the MGPA and to provide case support for additional study locations with comparable characteristics, the Tobit model was utilized to examine the region’s influencing components.
Materials and Methods
Study Area
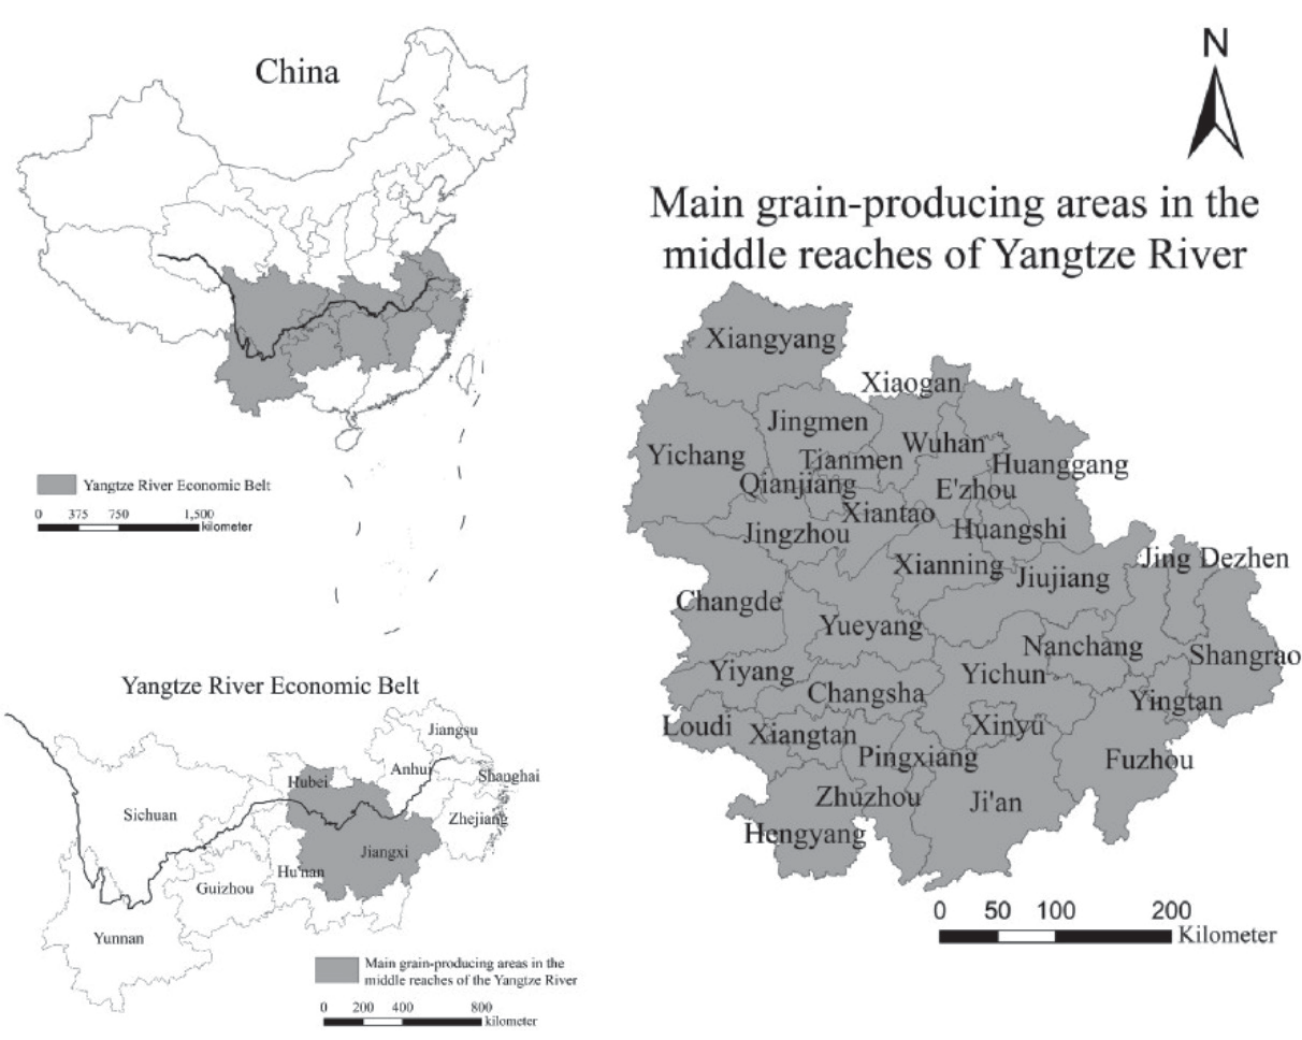
The MGPA of the MRYR is situated in the south-central region of China (108°21’-118°28’E, 20°09’- 33°20’N). The region has 31 cities (including 3 provincial-administered county-level cities), including Wuhan City Circle, Chang-Zhu-tan area, and Poyang Lake Ecological Economic Zone. The overall area is 564,700 km2, approximately 5.9% of China’s territory. With development strategies such as the “Rise of the Central Region” and the “Yangtze River Economic Belt”, this area has gradually evolved into a crucial connecting area for the integrated growth of the upper-middle-lower reaches of the Yangtze River as well as a transmission area for the development of the East and the West. The MRYR, which produced up to 9.0% of the whole country’s grain output in 2020, plays a critical part in ensuring the nation’s food security. However, farmers in the MGPA of the MRYR put heavy use on agricultural land and apply a great amount of chemical fertilizers and pesticides, resulting in increasing environmental pressure on regional water resources. Agriculture use of water shows an obvious growth trend and is especially affected by population expansion and the size of the food industry. Additionally, the area’s agricultural productivity and food security are strongly impacted by the unequal geographical and temporal distribution of water resources and the extensive patterns of agricultural water usage [21]. Therefore, it is urgent to conduct in-depth research on the temporal and geographical variations as well as the contributing variables that affect AWRUE in this area.
Research Methods
Data Envelopment Analysis (DEA)
The technique of linked processing of numerous comparable indicators and effective queuing of decision-making units (DMUs) is known as DEA [22]. In this paper, the input-oriented BCC model is used for analysis. In the presence of variable payoffs to scale, the BCC model is presumed to have a variety of DMUs, which are applied for evaluating both technical and scale efficiency. The expression is:
where k is the number of DMUs; in addition, there are m input variables and r output variables for each DMU. xnj is the nth input index value of the jth DMU. ynj is the nth output index value of the jth DMU. Xnj0 is the nth input index value of the j0th DMU. Ynj0 is the nth output index value of the j0th DMU. λj is the weight of the input and output indicators; θ is the efficiency evaluation index; Sn– and Sn+ are the relaxation variables of the input and output indexes; and ε is the non-Archimedes infinities.
Malmquist Index Method
Malmquist, a Swedish economist, first introduced the Malmquist index in 1953. The Malmquist index, which is frequently used to quantify the change in total factor production level from period t to period t+1, was transformed to an empirical index by Fare et al. [23] Since the single BCC method can measure only the AWRUE in the study area from a static perspective, the combination of the Malmquist index method can dynamically describe the changes in WRUE in different periods, thus compensating for the defects of the BCC model [24]. Its expression is:
where Tfpch stands for the total factor productivity change index, Techch for the technology change index, and Effch for the technical efficiency change index. Effch can be further divided into Pech and Sech, where Pech represents the change in pure technical efficiency and Sech represents the change in scale efficiency. When Tfpch>1, compared with the previous period, this indicates that the total factor productivity level has increased; otherwise, it has decreased.
Exploratory Spatial Data Analysis
ESDA refers to a group of data analysis methods and procedures that are now widely used in spatial statistics research to reveal the visual phenomenon of spatial dependence and spatial heterogeneity of data [25]. There are two primary forms of spatial autocorrelation coefficients used in this study: one measures whether an item of study has spatial correlation from an overall perspective and is called the global spatial autocorrelation index (Global Moran’s I); the other is the Local spatial autocorrelation index (Local Moran’s I), primarily assessing the spatial correlation of the study item from a local perspective and gauging the similarity between sample values from the local area and nearby areas. The specific formula is:
where
Tobit Regression Analysis Model
The AWRUE is calculated by the DEA model with varying returns to scale, and the efficiency ranges within [0-1], which has the feature of truncation as the explained variable. Direct use of ordinary least squares regression analysis will result in inconsistent and erroneous parameter estimation, and thus will impact the accuracy and science of the findings [26]. Therefore, the Tobit model, an interception regression model, was selected, and the comprehensive AWRUE was taken as the explained variable AWRUEit to investigate the influences of various factors on the AWRUE in the MGPA of the MRYR. The model is:
where AWRUEit is the comprehensive AWRUE in year t of region i and infjit and βj are the estimated values of each influencing factor index and its corresponding parameters, respectively. β0 is the model constant term, and μi is the random disturbance term.
Index Selection of AWRUE
In light of the meaning of AWRUE and the difficulty in currently using agricultural water resources in the research region, and by referring to the existing achievements in academia [27-28], the input indexes were agricultural labor population, the conversion amount of fertilizer application, the total power of agricultural machinery, the area of arable land and the total amount of agricultural water use, and the major industry’s entire output value serves as the output index (Table 1).
Table 1.
Input and output indexes of AWRUE.
Influencing Factors of AWRUE
AWRUE is not only related to the labor force, capital, land, and other factors but is also affected by multiple factors. For example, these factors are natural resource endowment [29], water resource management level [30], irrigation technology level [31] and general agricultural input. This paper examined the influencing elements of AWRUE from five perspectives, considering the data that were available and the reality in the MGPA of the MRYR: water resource endowment, water resource management level, agricultural water intensity, agricultural planting structure, and agricultural economic level.
(1) In terms of water resource endowment, water resources per capita (CW) are chosen. Water resource endowment is a “double-edged sword”. On the one hand, sufficient water resources provide great convenience for agricultural irrigation, and this is conducive to promoting agricultural production increases and improving the AWRUE. However, sufficient water supplies cause farmers to have weak water awareness, making it simple for them to misuse and even waste water resources, lowering utilization efficiency. Thus, the expected role of water resource endowment is uncertain.
(2) In terms of the water resources management level, the effective irrigation rate (EI) was selected as the explanatory variable. EI refers to the percentage of effective irrigated area to the total cultivated land area. The waste of irrigation water resources can be decreased by increasing EI. As a result, it is anticipated that agricultural water resource usage will be more effective with more water resources being effectively managed.
(3) In terms of agricultural water intensity, the proportion of total water allotted to agricultural water consumption (AWC) represents agricultural water intensity. In general, traditional agricultural production methods consume greater amounts of water. Therefore, agricultural water intensity is expected to be negatively correlated with AWRUE.
(4) In terms of planting structure, the planting area of the main cash crops (MCA) was selected. Compared with food crops, cash crops consume more water in the whole growth process, but the output value per unit of water resources is higher. Therefore, the expected effect of planting structure is uncertain.
(5) In terms of agricultural economic level, disposable income per rural resident (DI) and primary industry’s added value (PI) are chosen. Farmers and governments will have more financial resources to invest in the management and conservation of agricultural water resources as the level of agricultural economic growth rises, and this will help increase the AWRUE. As a result, a positive impact on the agricultural economic level is anticipated.
Data Sources
The data were obtained from the water resources bulletin, statistical yearbook, socioeconomic development bulletins of Jiangxi Province, Hubei Province, and Hunan Province, statistical yearbook of prefecture-level cities in the MGPA of the MRYR and EPS data statistical platform, covering the period from 2006 to 2020.
Results and Discussion
Spatial-Temporal Differences of AWRUE in the MGPA of the MRYR
Static Analysis of AWRUE
DEAP2.1 was used to calculate the comprehensive efficiency (crste), technical efficiency (vrste), and scale efficiency (scale) of AWRUE in the MGPA of the MRYR during 2006-2020. The efficiency results are shown in Table 2.
(1) crste analysis. The average crste of AWRUE in the MGPA of the MRYR was 0.732, demonstrating the need for increased AWRUE throughout the research area. The crste was higher than average in 45.16% of these regions, among which the comprehensive efficiency of Wuhan, Yichang, and Ezhou was 1.000. The crste in Jiujiang is 0.518, indicating that it is in urgent need of improvement. It is evident that there are vital distinctions in the AWRUE between 2006 and 2020, with a maximum difference of 0.482, which is possibly due to the variations in resource endowment and the unequal distribution of water resources over time and space in the MGPA of the MRYR.
(2) vrste analysis. The average vrste in the MGPS of the MRYR was 0.835, indicating high efficiency but not effective utilization. Among these values, the vrste in Xinyu, Yingtan, Wuhan, and the other 8 regions is 1.000, hence it is highest value. However, it is 0.548 in Jiujiang, indicating that the vrste is obviously very low. Therefore, there is an urgent need for water technology innovation to improve the machinery for and technical level of agricultural irrigation.
(3) scale analysis. The average scale is 0.884, and thus it is relatively high but not fully effective and needs to be further raised. Except for Wuhan, Yichang, and Ezhou, the rest of the regions did not reach the effective state of DEA, 38.71% of the regions were below the average, and even Yingtan was 0.691. Therefore, these regions should reasonably deploy production factors such as land, capital, and water resources and adjust the input scale to have a higher scale.
Dynamic Analysis of AWRUE
To further investigate the dynamic changes in AWRUE in the MGPA of the MRYR, the Malmquist index method was used, and its decomposition results are shown in Table 3. Then, the state of AWRUE in each region over time was studied.
Table 2.
AWRUE in MGPA of the MRYR from 2006 to 2020.
(1) In terms of Effch, the average value is 0.976, with fluctuations in efficiency in different years and a slight overall decrease, indicating that Effch has not been improved. Disaggregate the Effch into Pech and Sech. The mean value of Pech is 0.985, with slight small fluctuations, and hence it is similar to that of Effch. Over the period of 16 years, there were 2 years in which the trend of Pech differed from the trend of Effch and 5 years in which the trend of Sech differed from the trend of Effch, indicating that Pech had a greater impact on Effch.
(2) Techch and Tfpch are both greater than 1 except in 2017, and the average annual growth rates of both are 10.3% and 8.3%, respectively, indicating that the overall AWRUE in the MGPA of the MRYR shows an increasing trend. The directions of Tfpch and Techch remain largely consistent. This is due to Techch being the main factor affecting Tfpch.
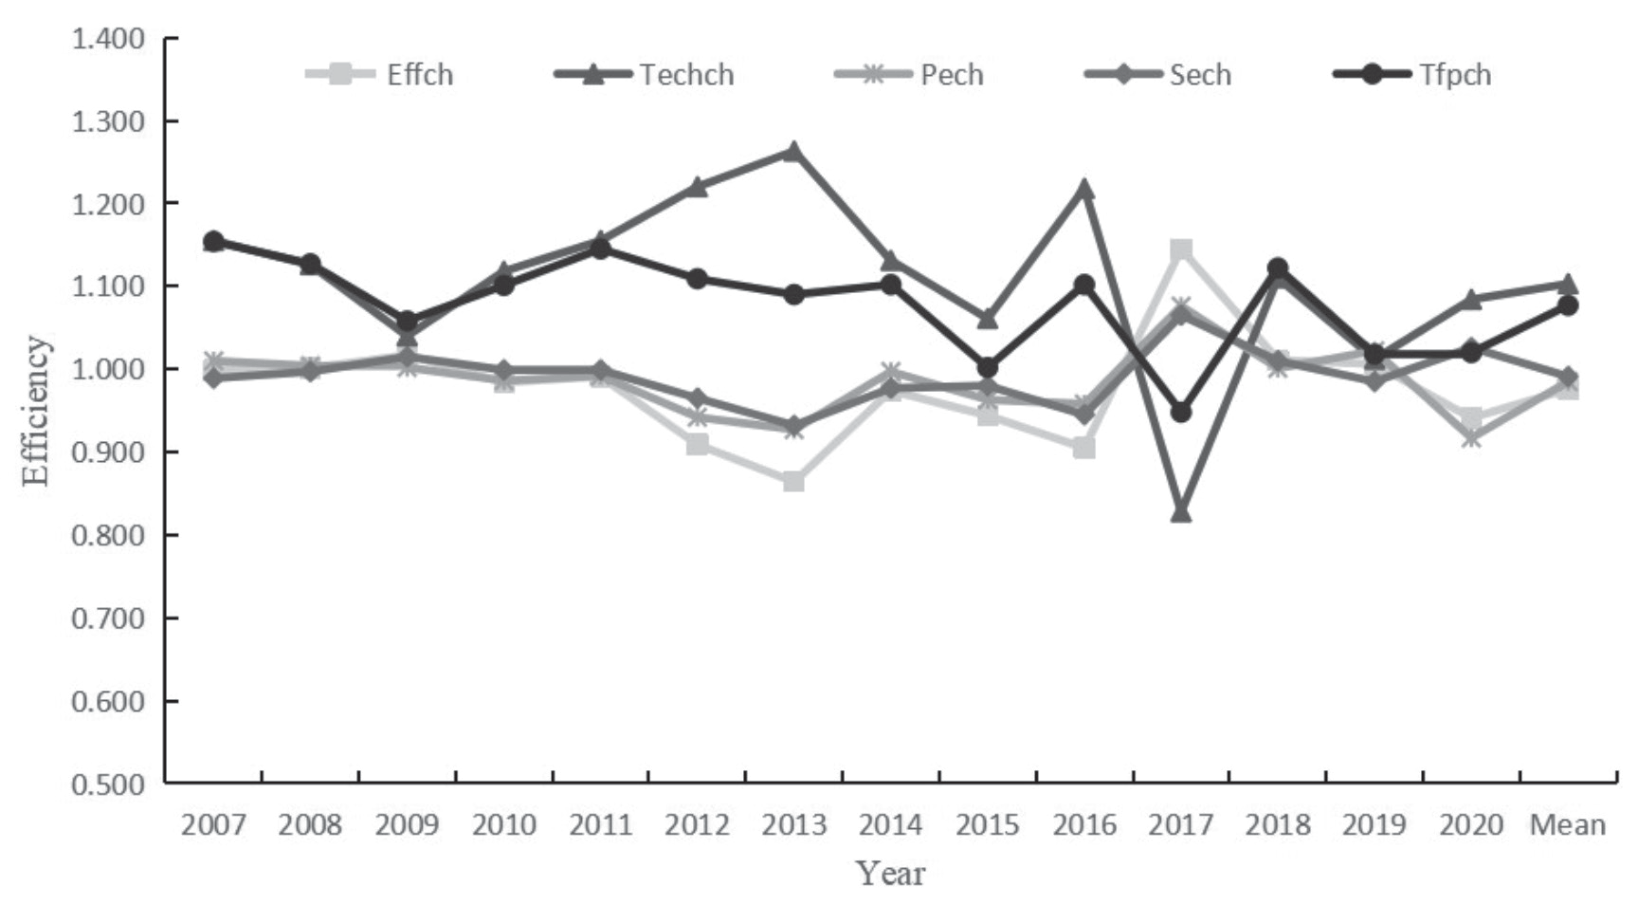
Table 3.
Total factor productivity index and decomposition of AWRUE (2006-2020).
The Tfpch of AWRUE in all regions, except Changde, was greater than 1 from 2006 to 2020, with an average value of 1.077 and an average annual growth of 7.7%, showing that the AWRUE in all regions has been improving gradually. The region with the highest Tfpch is Yichun, with an annual growth rate of 12.0%. The lowest region is Changde, with an index value of 0.953, reflecting a decrease in the AWRUE. Moreover, the AWRUE in the research area still has large spatial variances, as evidenced by the fact that the gap in growth rates between the provinces with the most and least growth rates was 16.7%. The Effch, Techch, Pech, and Sech in Wuhan, Yichang and Ezhou are all greater than 1, indicating that the factor inputs have brought about agricultural progress and good development of agricultural production. The trend of Tfpch is basically the same as the change in Techch, indicating that Tfpch is the key to improving AWRUE.
Overall Analysis of AWRUE by Region
In this respect, ArcGIS 10.5 was used to reveal the spatial distribution characteristics of AWRUE, and the results are as follows.
(1) From an overall perspective, the AWRUE in the study area is characterized by “high in the northwest and low in the southeast”, with the AWRUE decreasing from the northwest to the southeast. From 2006 to 2020, the AWRUE in the region experienced a trend of “improvement, decline, and rebound”. The overall efficiency improved more obviously from 2006 to 2010, and improved somewhat after 2015, but Yueyang and Changde still performed poorly.
(2) From a regional perspective, Hubei has the highest AWRUE at 0.826, followed by Hunan at 0.694, while Jiangxi Province has the lowest at 0.641 (according to Table 2). All three provinces showed a decreasing trend in AWRUE overtime, while Hunan and Jiangxi have declined significantly, so these two provinces still need to explore effective strategies to further strengthen AWRUE.
(3) From the cities’ perspective, agricultural water in Wuhan, Yichang, and Ezhou has always been used efficiently. The AWRUE in Jiujiang has been at an extremely low level, and in Ji’an and Yichun it is not high, while in Huangshi, Jingmen, and Changde it has been on a decreasing trend.
Local Analysis of AWRUE in the MGPA of the MRYR
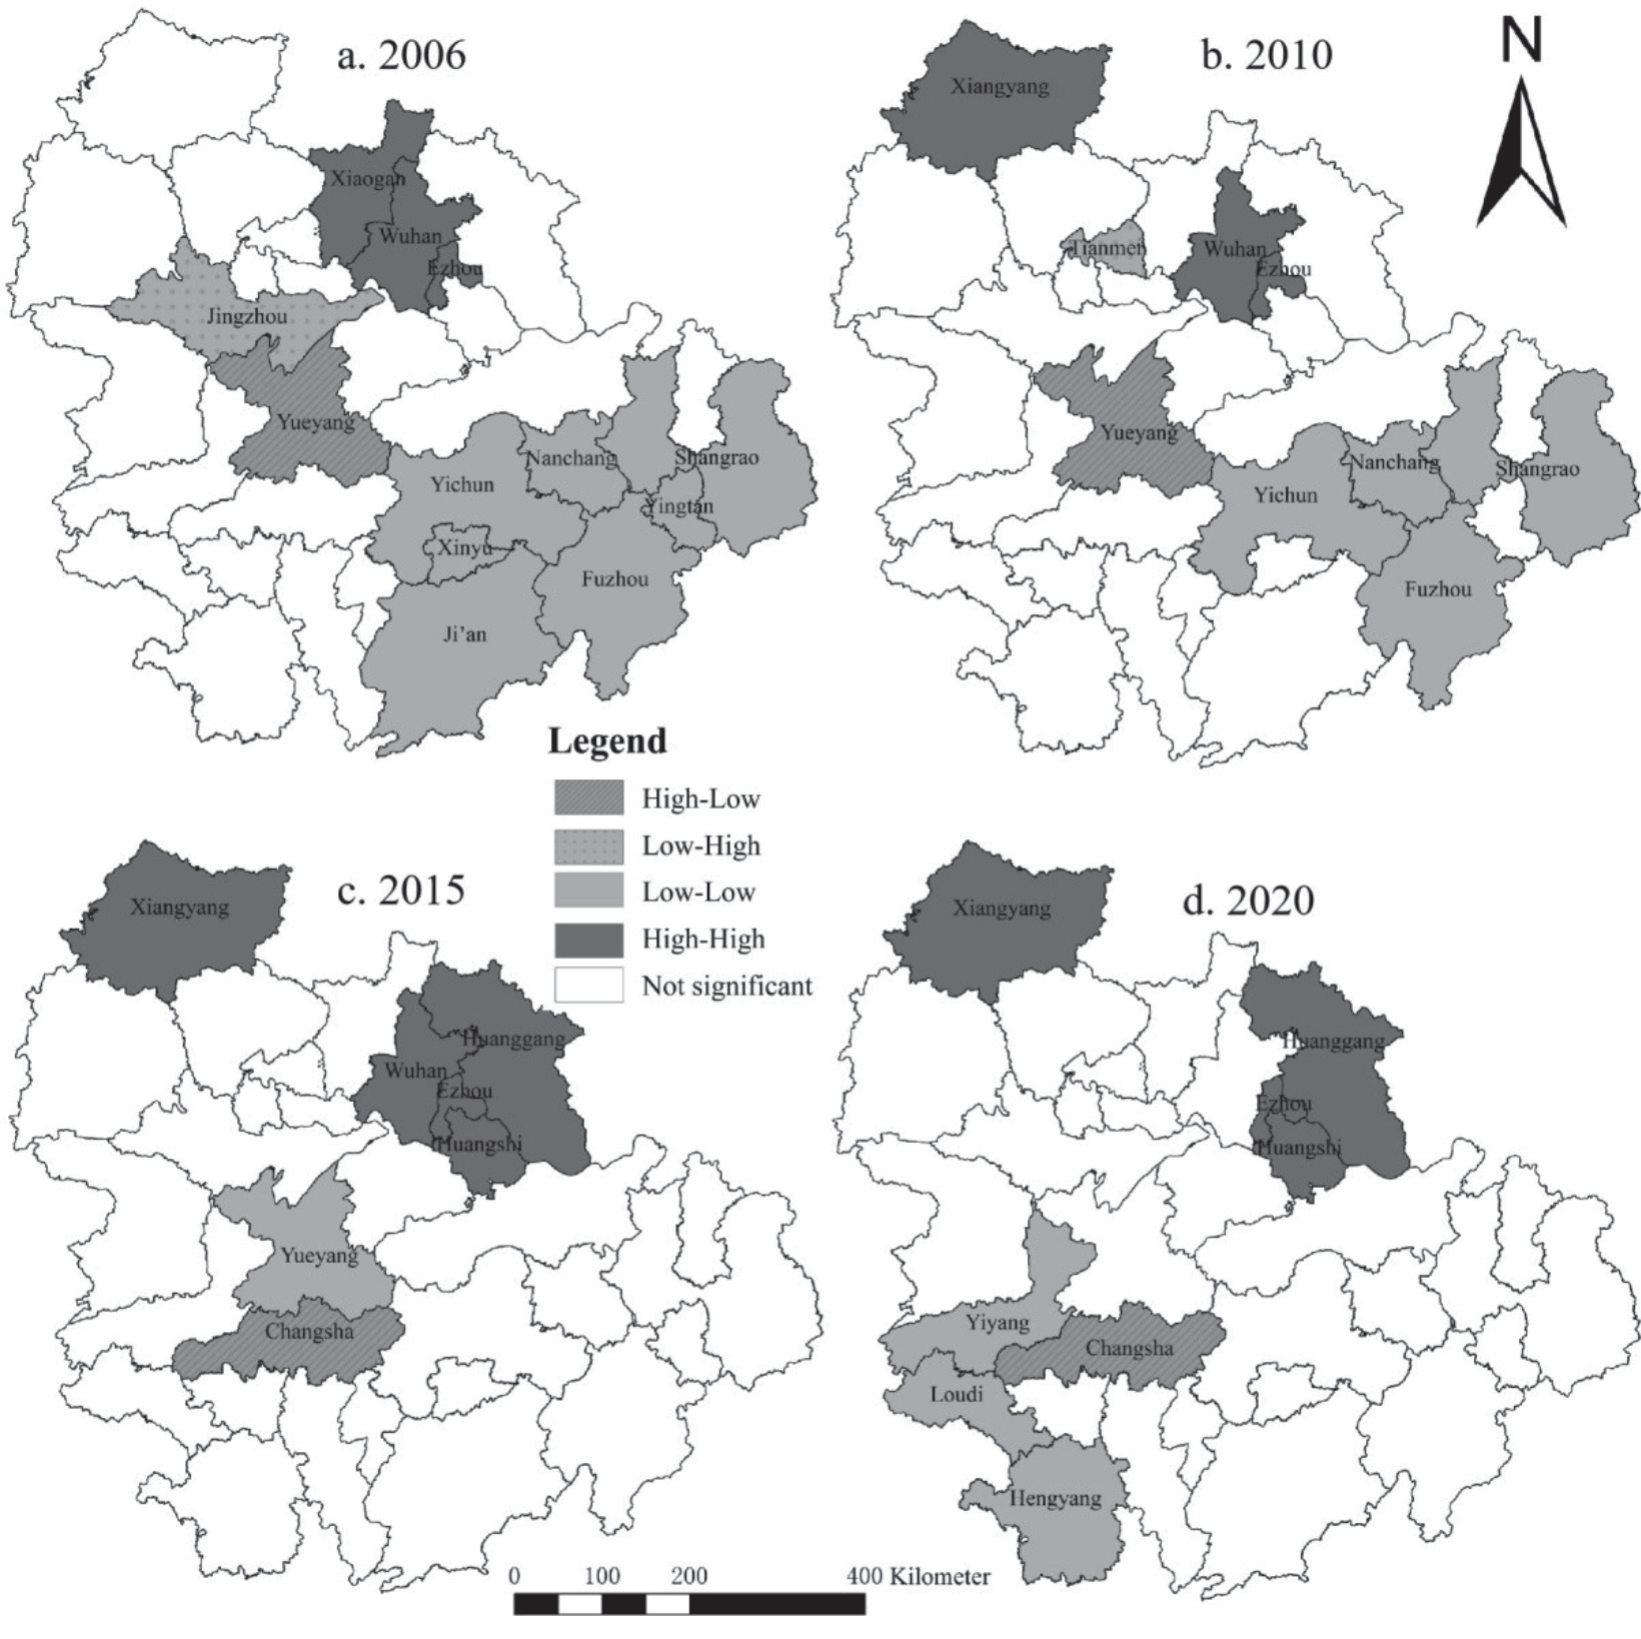
The global correlation and spatial differences of AWRUE were studied based on the Global Moran’s I and Local Moran’s I (LISA aggregation map) (Table 5). The global Moran’s I varied from 0.158 to 0.284, and it satisfied the significance exams, showing that there was an aggregation phenomenon of AWRUE.
Since the Global Moran’s I cannot indicate the spatial leap between different regions, this paper marked the LISA aggregation maps of AWRUE in the MGPA of the MRYR in 2006, 2010, 2015 and 2020 (Fig. 4).
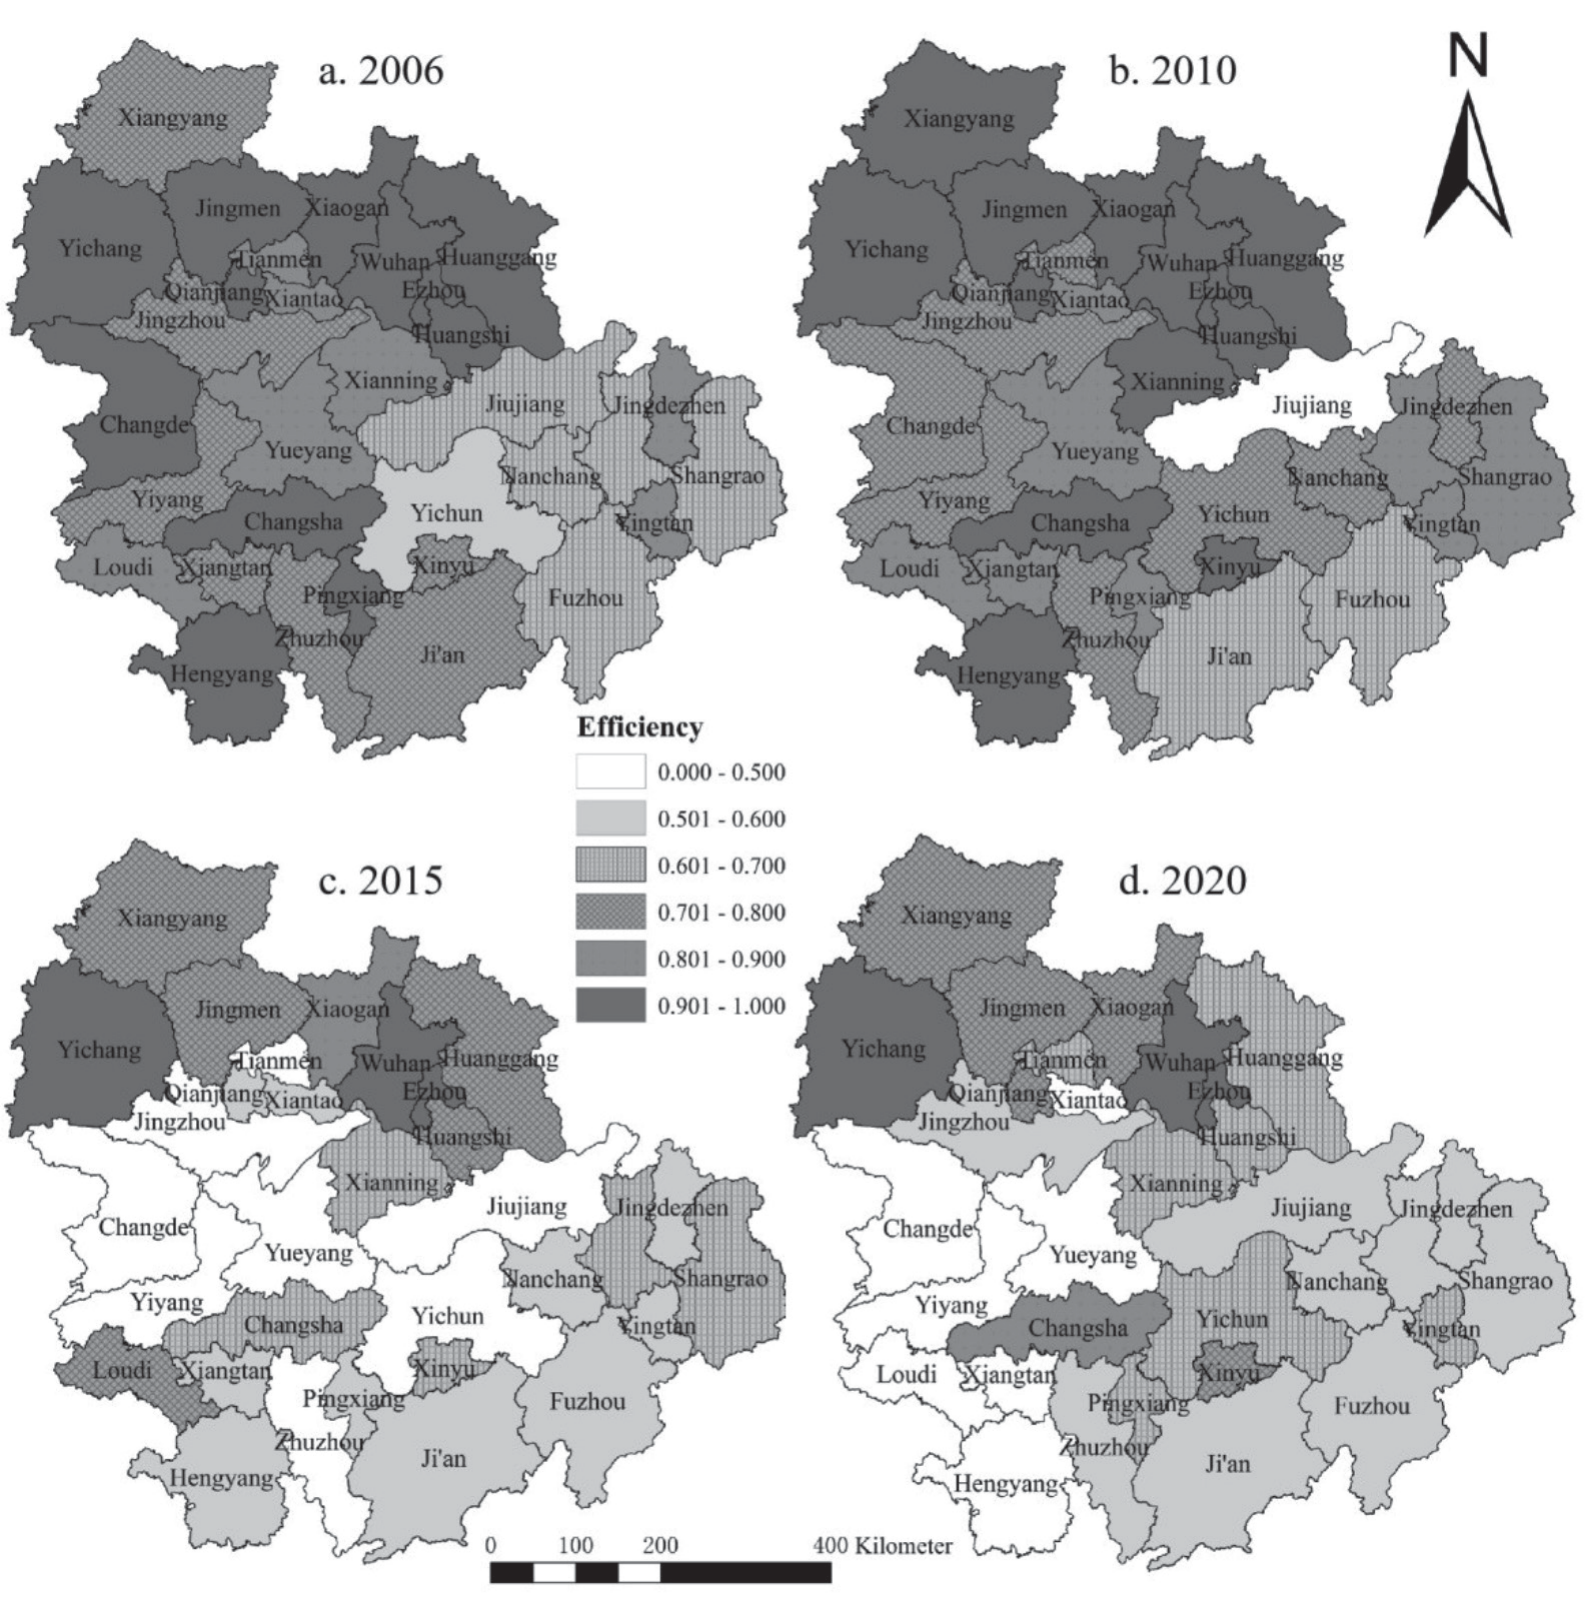
Table 4.
Global Moran’s I of AWRUE in MGPA of the MRYR.
| Year | 2006 | 2010 | 2015 | 2020 |
|---|---|---|---|---|
| Moran’I | 0.284 | 0.158 | 0.283 | 0.263 |
| P-value | 0.008 | 0.068 | 0.008 | 0.014 |
| Z-value | 2.7175 | 1.6237 | 2.8070 | 2.606 |
(1) The high-high aggregation area is mainly distributed in Xiangyang, Ezhou, Huangshi, Wuhan, and Huanggang in the northwestern part of the study area, belonging to Hubei Province, coinciding with the results of the AWRUE measurement and this area is considered a high-value aggregation area. These areas have high AWRUE, sufficient agricultural water resources, and mature agricultural water conservation technology and have a good diffusion effect.
(2) The low-low aggregation area is mainly distributed in Nanchang and Shangrao in the southeast from 2006 to 2010 and Yueyang and Yiyang in the southwest from 2015 to 2020, belonging to Jiangxi Province and Hunan Province. Jiangxi and Hunan have a lower level of economic development, unsophisticated water conservation techniques, and agricultural water conservancy facilities. Jiangxi is a traditional grain-producing province, and production of food consumes a large amount of water, but the economic output is low, so the AWRUE is low.
(3) The two low-high aggregation areas appearing are Jingzhou in 2006 and Tianmen in 2010. These two areas are adjacent to Wuhan and Ezhou high-high aggregation areas, improving the AWRUE through their positive spillover effects. The high-low aggregation areas are Yueyang and Changsha. Due to the adjacent low-low aggregation area, affected by its negative spatial and temporal spillover effect, Yueyang falls as a low value area in 2020.
Discussion
Hidden Causes of AWRUE
Based on Eviews10.0 software, Tobit regression analysis was performed (Table 6). All six factors satisfied the significance tests, among which the CW, EI, AWC, MCA, and DI had significant negative effects, and the PI showed a positive effect.
(1) CW’s estimated coefficient value is -0.0000378, indicating a relative relationship with AWRUE. This tendency might be caused by the rise in CW, that has facilitated relatively easy access to water, and decreased farmers’ understanding of water conservation, resulting in the misuse of agricultural water.
(2) The estimated coefficient of EI is -0.135, demonstrating a negative correlation between the effective irrigation rate and AWRUE, contrary to the expected effect, and this is perhaps related to the rough irrigation practices in the region. Agricultural irrigation in major grain producing areas is one of the most water-consuming activities in the region, accounting for up to 70% of the water consumption, there inevitably wasting water resources [32]. Therefore, an important way to improve AWRUE at present is to modify the water-saving irrigation technology and improve the water-saving irrigation level.
(3) The estimated coefficient value of AWC is -0.475, and hence it significantly prevents the improvement of AWRUE. The greater the agricultural water intensity is, the higher the agricultural water consumption, reflecting unsophisticated agricultural production methods, poor agricultural water management, and inefficient water utilization.
(4) With an impact coefficient value of -0.000169, the MCA significantly hinders the improvement of AWRUE. As cash crops require an abundance of water to flourish, their AWRUE is low.
(5) The estimated coefficient of DI is -0.0000167, which, albeit being very low in value, indicates that this variable plays a hindering role with its very low level of AWRUE. The MGPA of MRYR are traditional Chinese grain-producing areas and the increase in farmers’ disposable income will prompt farmers to prioritize increases in water sources for irrigation, and these farmers will not invest funds in water conservation, thus failing to raise AWRUE.
(6) The coefficient of the PI is 0.000282, and hence it resembles the expected effect. Increased PI indicates that higher output is obtained with certain resource inputs, and the agricultural production field has more sources of funding to invest in agricultural water conservation technology and improve the AWRUE.
Research Comparison
In terms of the choice of research regions, studies at the national level [17, 33], watershed or economic belt [4, 27], and provincial scales [34] have been fruitful. This paper conducts a study on the MGPA of the MRYR, complementing the lack of previous regional studies at the mesoscopic scale. Geographically speaking, the paper has major locational benefits focusing on the hinterland of the Yangtze River Economic Belt that occupies an indispensable part in the upstream and downstream linkages as well as the east-west transmission of the Yangtze River.
In the choice of time span, this paper studied the time change in AWRUE in 16 years with years as the basic unit. Ekrem Mutlu and Asli Kurnaz [35] selected the months as the data collection unit to evaluated the seasonal changes in the heavy metals and physicochemical parameters of Sakiz Pond, and drew valuable conclusions, thus prociding important implications for this article. Agricultural production is also a seasonal activity, which may aggravate the seasonal imbalance of agricultural water resources utilization. The use of monthly data to study the seasonal change in AWRUE is more accurate and helps to make more targeted suggestions.
According to the results, the AWRUE of the three provinces in the MGPA of the MRYR ranked Hubei, Hunan, and Jiangxi, according to the economic degree of the three provinces. This conclusion was further supported by Tong et al., [4] who found that the lower Yangtze River region had a much greater AWRUE than the upper and middle reaches. Agricultural water use and management technology is continually innovating because of the advanced economy, and farmers have a strong concept of water conservation awareness, causing AWRUE to continuously advance. The frequent floods and droughts in Jiangxi Province have caused a serious mismatch between water supply and demand, resulting in low WRUE.
Regarding the influencing factors, water endowment is one of the primary variables determining WRUE, and many scholars characterize it using CW. Luo et al. [36] argued that CW has a favorable effect on AWRUE, and higher crop water demand can be met with abundant water. Sun et al. [17] argue that the growth in CW is not helpful for WRUE and that when water resources are abundant and easily available, wasting resources becomes easy. This study concluded that CW, in this case, are considered an obstacle to increasing the AWRUE, and farmers’ knowledge of water conservation declines as a result of ample water supplies, leading to waste of agricultural water and lower AWRUE.
Table 5.
Tobit results of influencing factors of AWRUE.
Policy Implications
(1) Promote water-saving irrigation techniques and instruments and improve the degree of water-efficient agricultural output. Effch and Techch are the main reasons for the differences in AWRUE. Jiujiang, Fuzhou, and other places with low agricultural water utilization technology efficiency should comprehensively promote the renovation of agricultural water conservation facilities as well as the innovation of agricultural water conservation technology and vigorously promote efficient water conservation technologies such as undermembrane drip irrigation and rainwater harvesting and irrigation to establish a strong base of facilities and technical assistance for enhancing AWRUE.
(2) Strengthen agricultural water conservation education and publicity and increase knowledge of water-saving production among farmers. Every region in the area should actively carry out studies on the use of water conservation equipment and training on water conservation techniques to promote and guide farmers’ water use behavior. Knowledge of agricultural water conservation should be effectively popularized, and farmers should be guided to use irrigation water rationally and reduce water abuse and waste to improve the AWRUE.
(3) Eliminate the compartmentalized administrative system and achieve regional cooperation in water conservation technology. In the context of the “Rise of Central China” strategy and the “Yangtze River Economic Belt” development strategy, administrative barriers should be broken down among the three provinces in the MGPA of the MRYR, and cooperation in terms of the efficient utilization and conservation of agricultural water resources should be developed to realize the basin-wide sharing of advanced water conservation technologies.
(4) Develop appropriate and effective water conservation strategies and guide the effective use of regional water sources. The improvement of AWRUE relies on the guidance of policies. Local governments should widely learn from the beneficial experiences of Wuhan, Yichang, and Ezhou and formulate appropriate policies in the context of local realities to maintain the current level in areas of efficient utilization and shift to efficient utilization in areas of inefficient utilization, thus realizing effective AWRUE in the whole region. Strengthen regional water resources legislation, improve the system of laws and regulations, strengthen departmental supervision, and promote the implementation of regulations and effective implementation.
Table 6.
Comparison of the AWRUE.
Conclusions
This paper analyzes the spatial and temporal differences in AWRUE and its influencing factors in the MGPS of the MRYR based on the DEA, ESDA, and Tobit model and draws the following conclusions.
(1) The average crste, vrste and scale of AWRUE in the MGPA of the MRYR are all less than 1, indicating that they are not DEA effective, further showing that the AWRUE still needs to be increased and needs to be improved in terms of agricultural water saving technology and scale of capital investment. By decomposing the Malmquist index, it is concluded that technological progress is the key to improving AWRUE.
(2) The spatial pattern of the AWRUE in the MGPA of the MRYR is generally „high in the northwest and low in the southeast”. In the interprovincial comparison, the AWRUE is Hubei > Hunan > Jiangxi, and the cities with efficient water utilization play a better spatial driving role.
(3) The PI positively affects the AWRUE in the research area, while the EI, DI, and CW negatively affect it.
(4) To improve the AWRUE, it is beneficial to advocate water-saving irrigation technology and equipment to raise agricultural water-saving production; strengthen agricultural water-saving publicity and education to raise farmers’ awareness of water-saving production; eliminate the compartmentalized administrative system to achieve regional cooperation in water-saving technology; and establish appropriate water-saving strategies to guide the effective use of regional water sources.
This paper selects only the AWRUE of 31 regions in the MGPA of the MRYR as the object, but as a synergistic development economy of the Yangtze River Economic Belt, the coordinated linkage with the upper, middle, and lower reaches is not included in the index system, and the implementation of different national strategies for AWRUE has not been identified, and these could be directions for further exploration in future research.

