

Introduction
Air pollution is a global concern and poses a significant threat to public health and well-being. To improve air quality, countries around the world have implemented multiple related regulations, such as pollution discharge fees, environmental protection taxes, and environmental protection inspections, which have achieved a positive effect on reducing air pollutant emissions [1]. However, a contradictory phenomenon exists in current air pollution control. Namely, while overall air quality is improved, border air pollution remains serious, especially in the border zones between provinces [2]. In other words, air pollution at provincial jurisdictional boundaries is more severe than that in internal administrative regions [3]. Polluting enterprises often prefer to be located in border areas, forming a border pollution effect [4]. Border pollution is a regional environmental concern within a country, that is not restricted by administrative divisions. Previous research has argued that a lack of inter-jurisdictional collaboration leads to the failure of traditional environmental regulations in solving boundary air pollution [5]. Therefore, it is imperative to explore and establish an inter-jurisdictional air pollution control system. China has implemented efforts in this regard.
In October 2012, China released the Joint Atmospheric Prevention and Control Policy (JAPCP) in the 12th Five-Year Plan on Prevention and Control of Air Pollution in Key Regions (October 2012). The JAPCP emphasizes breaking provincial administrative jurisdiction barriers by requiring adjacent cities to form an inter-administrative air pollution control alliance (APCA) to collaboratively control air pollution. JAPCP implementation provides support for this study to explore the effect of regional joint cooperation to govern border pollution.
Existing literature has extensively examined border pollution and the JAPCP. Previous research on border pollution has confirmed the presence of the border effect by examining the differences in pollution emissions between border and non-border areas, and polluting firms’ site selection preferences [6-10]. Previous research has also investigated the causes of border pollution, identifying two major causes. First, it is difficult to internalize the externalities of pollution and governance [11]. Second, environmental administration decentralization (EAD) and political promotion incentives lead to local governments’ strategic emission reduction behavior [12]. A few studies have examined the governance of border pollution. It has been argued that establishing a negotiation and cooperation management model, reforming the performance appraisal system with an emphasis on economic growth, establishing a cross-border ecological compensation mechanism, and strengthening the central government’s vertical management can effectively reduce border pollution [13-15]. Research on the JAPCP can be roughly classified into two types. One category has examined the alliance scope from perspectives such as meteorology and geography [16-18]. The other category is dedicated to evaluating the effects of the JAPCP on emissions reduction. The majority of these studies agreed that the JAPCP has had a positive effect on improving air quality [19-21]. Existing literature has summarized the mechanism of the JAPCP as reducing pollution control costs, reducing “free-rider” behavior, increasing the intensity of environmental supervision, improving environmental governance efficiency, and internalizing externalities [22, 23]. However, some literature has been skeptical concerning the emissions reduction effect of the JAPCP, arguing that the JAPCP has not achieved an effective pollution control effect and even caused pollution transfer [24-26].
While previous research has also conducted substantial research on border air pollution and the JAPCP, the following three gaps remain to be addressed. First, these studies have focused more on fine particulate matter (PM2.5, PM10), carbon monoxide, nitrogen dioxide, and the Air Quality Index, ignoring SO2 emissions [19-23]. China is one of the countries with the highest levels of SO2 pollution [27]. Second, nearly all relevant studies have concentrated on border pollution’s existence, measurement, and causes, lacking investigations of border pollution governance [6-10]. Third, previous research on the JAPCP has been limited to macro-effects and has not examined its influence on micro-entities’ practices [16-18]. JAPCP implementation offers a rare opportunity to conduct a quasi-natural experiment to examine border SO2 pollution control. In the existing research and policy context, this study answers the following two research questions using Chinese industrial enterprise data and difference-in-differences (DID) models:
(1) Does JAPCP implementation reduce SO2 emissions in border areas? Does the JAPCP alleviate the problems that cause border SO2 pollution?
(2) If JAPCP implementation has a border SO2 pollution control effect, what are the influencing mechanisms?
This study makes the following three research contributions. First, we analyze enterprises’ SO2 emissions behavior to address the lack of research on border SO2 pollution. Second, we examine the border SO2 pollution control effect of the JAPCP from the perspective of inter-jurisdictional collaboration, providing a novel approach for addressing border air pollution effects and externalities. Third, considering that industrial pollution accounts for over 70% of China’s total pollution, our research on industrial enterprises reveals the micro-mechanisms of boundary air pollution control.
Policy Background and Theoretical Analysis
Background
Pollution’s spatial spillover features cause other regions to bear the costs of treating local environmental pollution. Consequently, no location is immune to the impact of regional environmental issues. As a result, adjacent local governments must break down administrative barriers and engage in collaborative environmental governance to improve overall environmental quality. The Chinese government has been dedicated to exploring effective models for coordinated air pollution governance. During the 2008 Beijing Olympics, Beijing cooperated with surrounding provinces to conduct large-scale governance on coal burning, motor vehicles, industrial pollution, and dust, which was referred to as “the Olympic Blue” project. This project ensured excellent air quality during the Olympic Games and fulfilled the solemn promise of a green Olympics. From then on, inter-jurisdictional cooperation measures have been implemented to control pollution during major events such as the 2010 Shanghai World Expo and the 2014 APEC meeting. Although the above-mentioned control measures were short-sighted and unsustainable due to a lack of normalized incentives and constraints [11], these experiences accumulated beneficial experience for implementing the JAPCP.
To effectively improve atmospheric quality, China released the JAPCP in its 12th Five-Year Plan on Prevention and Control of Air Pollution in Key Regions (October 2012). The key pollutants of the JAPCP are sulfur dioxide (SO2), nitrogen oxides, PM2.5 and PM10, volatile organic compounds, and other pollutant emissions, among which SO2 ranks first. The JAPCP breaks provincial administrative jurisdictions and advances coordinated governance of regional border air pollution by building a joint prevention and control mechanism. It requires adjacent cities to form an inter-jurisdictional APCA to collaborate on air pollution governance. For concrete illustration, the policy’s contents include five aspects.
First, the primary purpose of the JAPCP is to control pollutants such as SO2, nitrogen oxides, PM2.5 and PM10, volatile organic compounds, and other pollutant emissions, with SO2 ranking first. Second, the policy defines 13 APCAs, involving 19 provinces, autonomous regions, and municipalities (see Table 1 for the specific scope). The APCA adheres to the principles of unified planning, monitoring, supervision, evaluation, and coordination. Third, the JAPCP designates the responsible entities and implements differentiated emissions reduction tasks. Specifically, the policy proposed differentiated SO2 emissions reduction targets for each alliance member based on its pollution circumstances (see Table 1). Additionally, the JAPCP distinguished key control areas from non-key control areas, proposing stricter pollution control measures for the former. Fourth, the JAPCP implements an accountability system. At the end of each year, the central government assesses local governments’ pollution control performance and uses the results to evaluate government officials’ performance. Local governments achieving remarkable improvements in air quality are commended and provided with increased support, and those failing to meet the assessment standards are criticized, and any honorary titles related to environmental protection are revoked. Fifth, the JAPCP establishes an inter-jurisdictional joint supervision mechanism for atmospheric pollution. The policy upgraded the design of air quality monitoring websites and mandated the direct transmission of monitoring data to the China National Environmental Monitoring Centre, thereby boosting environmental information sharing and strengthening central government oversight.
Table 1.
The coverage scope of the 13 air pollution control alliances and their SO2 emissions reduction tasks.
Theoretical Analysis
Government and Pollution
Under the EAD system, the central government manages local environmental affairs, while local governments actively monitor pollution and enforce laws. The information asymmetry and high monitoring costs between the central and local governments endow local governments with substantial discretion in enforcing environmental regulations and pollution control [28]. This implies that local governments’ behavior and decision-making directly affect the success of pollution control measures. The government’s strict implementation of environmental regulations can reduce pollution, whereas a loose implementation may result in limited pollution control effectiveness. In practice, the political promotion system in China, which is centered on GDP growth, forces local officials to face the trade-off between economic growth and environmental protection [29]. Hence, local governments will not arbitrarily target polluting enterprises. Although these enterprises are major pollution sources, they stimulate economic growth and provide local governments with substantial tax revenues. This is especially true for polluting companies located near boundaries since they can disperse a large proportion of pollutants to adjacent regions. Without cross-provincial coordination among local environmental departments, relocating polluting enterprises to boundaries enables local governments to balance between economic growth and environmental protection. Consequently, local governments often adopt loose environmental regulations at provincial boundaries, and this strategic behavior leads to the boundary pollution effect.
Impact of JAPCP on Border SO2 Pollution
Three difficulties arise in the governance of border pollution: internalizing the externality of pollution, avoiding the strategic emissions reduction behavior of local governments motivated by EAD, and political promotion. However, the JAPCP can effectively alleviate these problems.
Externalities are important factors that cause border pollution. On the one hand, the natural spillover of pollutants caused by meteorological and topographical factors has caused serious cross-border pollution problems [30]. Cross-border pollution can save costs, which drives a large number of polluting enterprises to congregate near borders, resulting in border pollution [31]. On the other hand, the positive externalities of pollution control have led to free-riding [32]. Local governments with limited financial resources are more willing to invest in pollution control in inland areas to maximize advantages, resulting in poor pollution control in border areas [33]. In addition, problems such as ambiguous jurisdictions, inconsistent law enforcement standards, and information barriers in border areas exacerbate the difficulty of border pollution control [34].
The JAPCP’s design helps address externalities of pollution and pollution governance. Specifically, the policy breaks administrative barriers and is recognized as an APCA [35]. As noted above, APCA members act in accordance with the principles of unified planning, supervision, assessment, and coordination. In addition, inter-jurisdictional cooperation can lower pollution control costs and improve pollution control efficiency by optimizing natural resource allocation, sharing governance expenses, and increasing ecological compensation [36, 37]. Therefore, the externalities of border pollution can be internalized through local governments’ collective decision-making [38].
The political promotion system centered on economic growth provides an incentive for border pollution [39]. In China, officials’ promotion depends on political achievements. GDP has been the main indicator of such achievements for a long time. When environmental governance and economic development conflict, pollution boundaries become a “stopgap measure” [39]. For example, local governments have an incentive to locate polluting enterprises in border areas to gain economic income and minimize pollution [40, 41]. Previous literature has also demonstrated that a higher economic growth target is correlated with more serious environmental pollution [42].
The JAPCP can effectively constrain local governments’ strategic emissions reduction practices related to political promotion incentives. First, the JAPCP sets emissions reduction tasks for each alliance member, which can enhance the priority of environmental governance and directly motivate local governments to participate in pollution control. Second, setting emissions reduction targets and linking pollution control outcomes with official promotions will help ease local governments’ strategic emissions reduction behavior. However, the JAPCP has not fundamentally reversed the performance assessment system, which is mainly based on GDP. Therefore, local governments still face conflicting incentives for economic growth and environmental protection.
EAD is the institutional arrangement that exacerbated border pollution. In China, the central government implements unified supervision and management of national environmental protection work, while local governments are responsible for the environmental protection work within their jurisdictions. This context forms a territorial management model driven by local government officials (i.e. EAD); however, excessive decentralization may be detrimental to environmental governance [43]. First, EAD encourages local governments to improve environmental quality within their jurisdictions but lacks appropriate incentives for cross-regional pollution governance, making it difficult to internalize pollution’s negative externalities. Second, EAD grants local governments autonomy in environmental management. Local officials strategically implement emissions reduction strategies in border areas, resulting in border pollution [44]. Third, EAD weakens the central government’s supervision over local areas, exacerbating border pollution [45].
The JAPCP is an attempt by the central government to establish a balance between EAD and centralization. The unified planning and assessment by the central government can effectively weaken the autonomy of local governments’ strategic actions. In addition, the JAPCP emphasizes central government supervision and central-local information sharing, which can prevent spatial speculation by local governments.
Based on this, we propose the following hypotheses:
Hypothesis H1. The JAPCP can effectively control the border SO2 pollution.
Hypothesis H2. The JAPCP can effectively alleviate border SO2 pollution caused by externalities and EAD, but has limited effects on that caused by political promotion incentives.
Influencing Mechanisms of JAPCP on Border SO2 Pollution
Pollution control necessitates collaboration between the government and businesses. As the formulator and implementer of environmental policy, the government has a critical leadership role in reducing emissions. The preceding theoretical analysis demonstrates that the JAPCP may effectively constrain local governments’ opportunistic practices induced by environmental decentralization and political promotion incentives, indicating that the JAPCP encourages local governments to execute stringent environmental regulations. As primary polluters, firms’ emissions reduction can directly influence the real impact of environmental regulations. In theory, enterprises usually adopt strategic and substantial emissions reduction strategies to decrease pollution emissions.
Strategic emissions reduction (i.e., window dressing) primarily includes reduced production and pollution transfer. Enterprises may reduce production to control pollution emissions. Environmental regulation increases the cost of pollution control and compliance for enterprises [46]. Enterprises may adopt measures to reduce production and shorten working hours to offset pollution control and compliance costs brought by environmental regulations [47]. According to Greenstone (2002), the implementation of the Clean Air Act in the United States (US) altered the structure of economic resource allocation and hampered companies’ production activities [48]. Furthermore, the pollution haven hypothesis contends that enterprises may reduce pollution levels by transferring pollution [49]. To avoid pollution penalties, polluting enterprises often choose to relocate to countries or regions with lax environmental regulations [50]. Therefore, we propose the following hypothesis:
Hypothesis H3. The emissions reduction effect of the JAPCP on SO2 in border areas may be achieved through production reduction or pollution transfer.
Substantial emissions reduction can be divided into two types. The first is end-of-pipe treatment, referring to reducing pollutant emissions by improving and installing emissions treatment equipment. The second is source control, in which enterprises reduce the number of pollutants emitted by improving production technology or production processes. Innovation is the main form of source control. According to the Porter hypothesis, strict environmental regulation will stimulate technological innovation and contribute to the mutually beneficial outcome for economic development and environmental quality [51, 52]. In addition, the JAPCP breaks down regional administrative barriers, which promotes the flow of technology and enhances the emissions reduction effect of the JAPCP [53]. In the long term, source control is an important approach to fundamentally reduce environmental pollution. Based on this analysis, the fourth hypothesis is:
Hypothesis H4. The JAPCP may reduce border SO2 emissions through end-of-pipe treatment and source control.
Materials and Methods
Variables
(1) The explained variable is lnSO2. We use the logarithm of enterprises’ SO2 as the explained variable, as it is the most predominant pollutant in China and the primary target of the JAPCP.
(2) The core explanatory variable is DIDit; DIDit = treati × timet. Considering that the governance effects of border pollution are the subject of this study, we only focus on industrial enterprises located in border counties. We define border counties as counties adjacent to the provincial boundaries. This restriction ensures that the treatment and control groups are highly similar and comparable in terms of geographical location and economic development. treati is a group dummy variable. If enterprise i is located in a JAPCP-covered border county, treati equals 1; otherwise, it equals 0. timet is a time dummy variable that takes the value of 1 when t ≥ 2012 and 0 otherwise.
(3) Control variables. Referencing previous studies, we select eight control variables in three categories [20- 23]. First, enterprise-level variables include enterprise size (size), employees (emp), enterprise age (lnage) and equity nature (gq). Second, the county-level economic variable is economic development (lnGDP). Third, county-level meteorological variables include precipitation (lnrain), temperature (lntemper), and average wind speed (avgwind).
Data
We use Chinese industrial enterprises’ data to examine the effect of JAPCP implementation on border SO2 pollution. The sample period covers 2005–2014. The sample observation time begins in 2005 to fully cover the period prior to the policy shock. Our sample ends in 2014 due to the unavailability of industrial enterprise data. The enterprise financial data are obtained from the China Industrial Enterprise Database, the enterprise pollution emissions data are from the China Industrial Enterprise Pollution Emission Database, and the macro-level data are from local statistical yearbooks. The meteorological data comes from the US National Centers for Environmental Information.
In terms of the data matching process, we use information such as legal person code and company name to match industrial enterprise pollution emissions data with industrial enterprise data. The data processing process is as follows. (1) Only enterprises located in the border counties are retained. Notably, China’s administrative divisions are separated into province, prefectural, county, and township-level administrative areas. The JAPCP identifies pilot zones according to provincial administrative regions. Due to a scarcity of village-level data, we define border areas at the county level rather than the village level. (2) Samples with missing core variables are excluded. (3) We winsorize the continuous variables at 1% and 99% quantiles. Table 2 presents the definitions of these variables and their descriptive statistics.
Model Specification
To evaluate the border air pollution control effect of the JAPCP, we construct the DID model in Eq. (1), and to examine border SO2 pollution, we construct Eq. (2).
In Eq. (1), subscript i represents for the enterprise and t for year, and lnSO2it is the SO2 emissions of enterprise i in year t. If the county where the enterprise i is located is included in the JAPCP, the value of DIDit is 1 since 2012; otherwise, it is 0. Xit denotes the set of control variables. Given that enterprises’ pollution emissions are related to their industry, we control for three-digit industry fixed effect (indusi). λt and εit represent the year fixed effect and random error term.
In Eq. (2), subscript i stands for county and t for year. SO2it is the county-level SO2 emissions, which we obtain by aggregating the SO2 emissions of all industrial enterprises within the county. borderi is a dummy variable. If county i is a border county, borderi equals 1; otherwise, it equals 0. Xit represents the economic and meteorological control variables at the county level. μi, λt, and εit represent individual and time fixed effects, and the random error term, respectively.
Table 2.
Variable definitions and descriptive statistics.
Table 3.
Baseline regression.
Results and Discussion
Baseline Regression
JAPCP Impact
The premise of this study is to verify the existence of border SO2 pollution. Column (1) of Table 3 shows the results of Eq. (2), revealing that SO2 emissions in the border counties are significantly higher than those in the non-border counties, indicating that border SO2 pollution is widespread. We then evaluate the border pollution control effect of the JAPCP. Columns (2) and (3) of Table 3 show the impact of JAPCP on border enterprises’ SO2 emissions without and with control variables, respectively. The estimated coefficients of DID are significantly negative, at least at the 5% level. Specifically, after the JAPCP shock, the SO2 emissions of enterprises located in JAPCP-covered border counties decreased by 23.6% compared with those located in non-JAPCP-covered border counties. These results indicate that the JAPCP has had a positive control effect on border SO2 pollution, supporting Hypothesis H1.
Previous literature has indicated that externalities, political promotion incentives, and EAD are the primary causes of border pollution. Subsequently, we conduct a more in-depth examination of these claims.
The JAPCP and Border Pollution Caused by Externalities
Theoretical analysis suggests that the externality of border pollution can be internalized through local governments’ collective decision-making. If this holds true, we should observe a stronger effect of JAPCP on border pollution control in regions with more APCA members. Based on the number of alliance members, we divide into three categories: three provinces in the first, two in the second, and one in the third. We perform grouped regression, and the results are presented in columns (1) – (3) of Table 4. Obviously, the more provinces an alliance includes, the greater the absolute value of the DID coefficient and the higher its significance. This indicates that the JAPCP can alleviate the border pollution caused by externalities.
The JAPCP and Border Pollution Caused by Political Promotion Incentives
We next examine the influence of the JAPCP on border SO2 pollution generated by political promotion incentives. We quantify local governments’ economic growth pressure using prefecture-level cities’ economic growth targets. In particular, based on the 50% and 75% quantiles of economic growth targets, we divide the sample into the low (LEpres), medium (MEpres) and high (HEpres) economic growth pressure groups. As shown in columns (4)–(6) of Table 4, the JAPCP only reduces border SO2 emissions in regions with low economic growth targets. This demonstrates that, while the JAPCP can help to reduce border pollution caused by GDP-based political promotion incentives, it cannot fix the problem fundamentally, validating Hypothesis H2.
The JAPCP and Border Pollution Caused by EAD
Next, we test whether the JAPCP weakens local governments’ strategic emissions reduction practices due to EAD by strengthening central government supervision. If so, we should observe a more significant emissions reduction effect of the JAPCP on SO2 in areas with poor monitoring. The JAPCP disclosed how many air quality monitoring stations each alliance member had in 2010 and set a target number for each region to establish in future years. Therefore, we first use the mean of the existing number of stations as the standard. Samples above the mean are defined as the strict monitoring group (strsup), and those below as the loose monitoring group (loosup). The regression results are shown in columns (7) and (8) of Table 4. Furthermore, we measure the degree of supervision by using the difference between future and existing numbers of air quality monitoring sites. We define samples smaller than the mean as the well-monitored group (wellsup), and samples larger than the mean as the poorly-monitored group (bedsup). The results are presented in columns (9) and (10) of Table 4, revealing that the JAPCP can only suppress border SO2 emissions with poor monitoring. This means that the JAPCP can effectively mitigate the border pollution caused by EAD.
Table 4.
The impact of JAPCP on border SO2 pollution caused by externalities, political promotion incentives, and environmental administration decentralization.
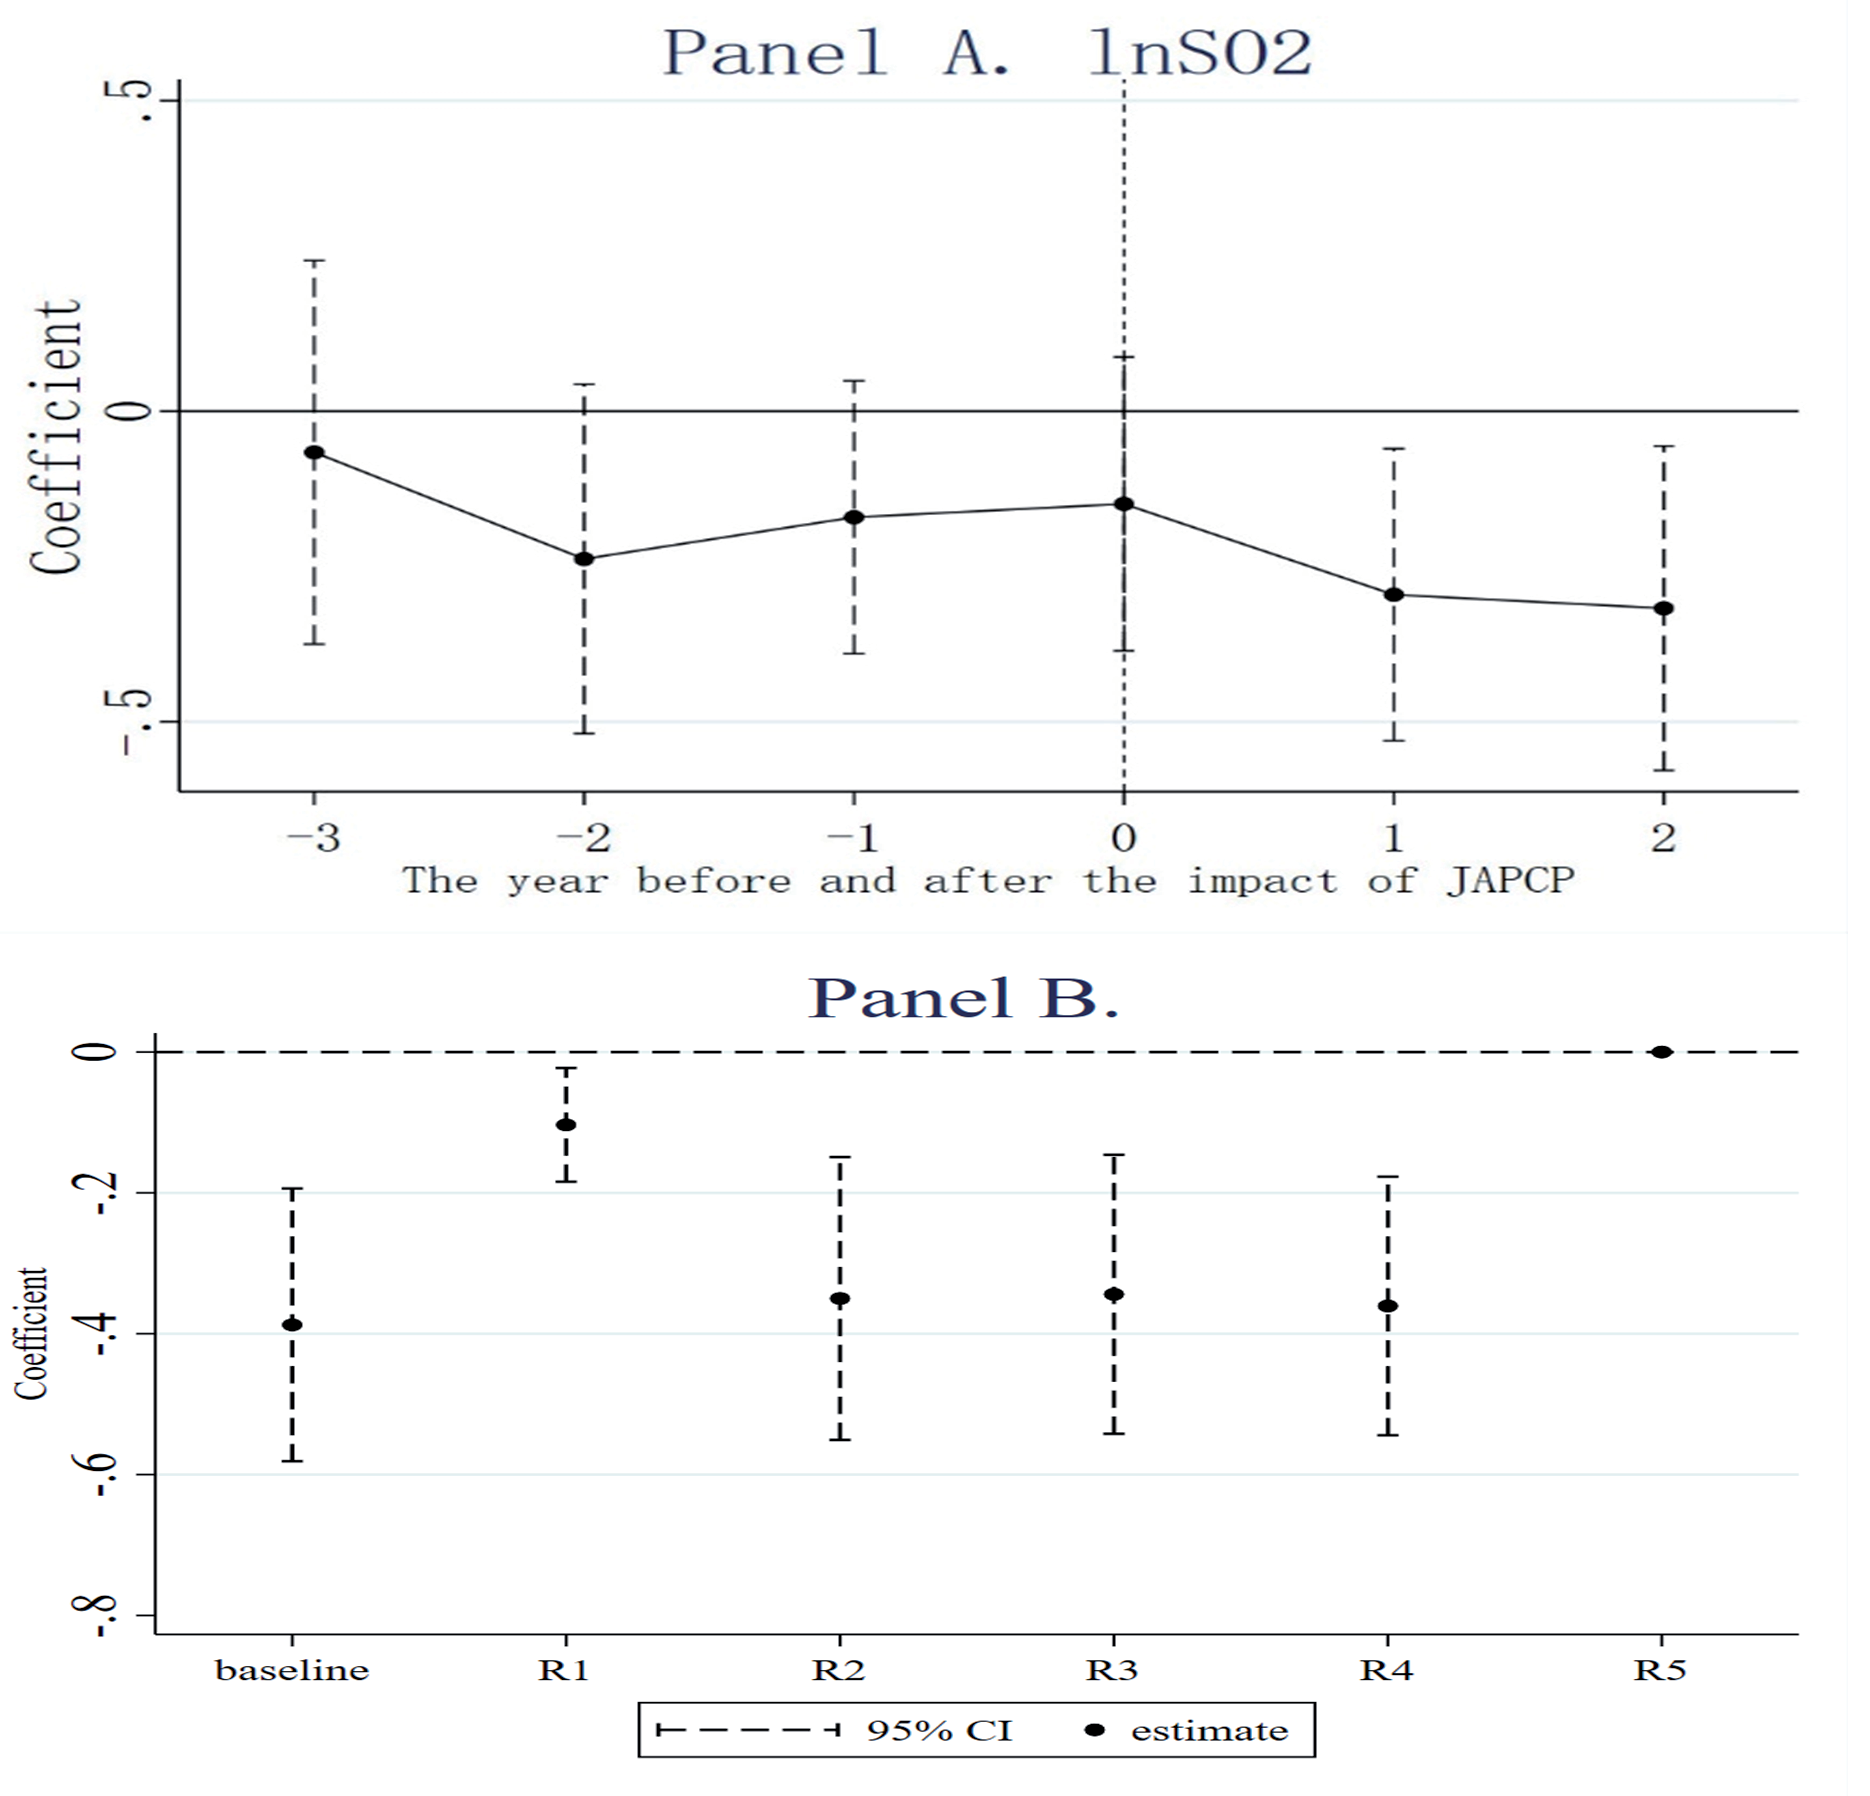
Parallel Trend Test
The prerequisite for using the DID model is that the explained variable must satisfy the parallel trend assumption. In this study, we need to verify that the SO2 emissions of enterprises within and outside the JAPCP scope had the same trend before JAPCP implementation. We use the following event study method for the parallel trend test:
where subscript k represents the year since JAPCP was implemented. We let k ≤ −4 be the−4th period and take the −4 year of the samples as the base period. Other variable settings are the same as those in Eq. (1). Panel A of Fig. 1 shows the pre-trend of lnSO2. Prior to JAPCP implementation, no significant differences in SO2 emissions are evident between the two groups of enterprises, satisfying the parallel trend assumption. Furthermore, we identify a policy lag, which may be attributable to the JAPCP being promulgated in the fourth quarter of 2012 and its influence not yet being exerted.
Robustness Tests
We employ four robustness tests; first, replacing the explained variable. To avoid measurement error interference, we use the logarithm of the ratio of SO2 emissions to total industrial output value to replace the explained variable. The result is shown in R1 of Panel B in Fig. 1. Second, we control high-dimensional fixed effects. To eliminate the interference of macro-omitted variables, we control fixed effects at prefecture and provincial levels. The respective results are shown in R2 and R3 of Panel B in Fig. 1. Third, we eliminate the interference of other policies. In 2007, China launched an SO2 emissions trading rights (ETSs) pilot policy in 11 provinces. Previous studies have found that ETSs have a positive effect on improving air quality [54]. To exclude the interference of ETSs on our conclusions, we control the impact of ETSs in the regression. The results are presented in R4 of Panel B in Fig. 1. Fourth, we employ the continuous DID model. The JAPCP has set SO2 emissions reduction tasks for each region (see Table 1); therefore, we construct a continuous DID by replacing the policy grouping dummy variable with the emissions reduction target. The regression result is shown in R5 of Panel B in Fig. 1. Fig. 1. shows that after these four tests, the JAPCP still has a significant inhibitory effect on border SO2 pollution, validating the robustness of our conclusions.
Mechanism Tests
Strategic Emissions Reduction: Production Reduction or Pollution Transfer
We examine whether the border pollution control effect of the JAPCP is achieved through enterprises’ strategic emissions reduction practices. The explained variable in column (1) of Table 5 is the average working hours of enterprises (lnwork). The coefficient of DID is significantly positive at the 1% level, indicating that enterprises did not reduce production or cut working hours in response to the JAPCP. Next, we examine whether pollution transfer occurred, which is measured by the number of newly registered polluting enterprises in the county (newEnter). If pollution transfer holds true, counties within the JAPCP will restrict the entry of polluting enterprises. We define manufacturing enterprises as polluting enterprises, referencing Cui et al. [26]. As shown in column (2), the number of polluting enterprises in JAPCP-covered counties increased following its implementation, ruling out the assumption that enterprises responded to the JAPCP by transferring pollution. The results in columns (1) and (2) of Table 5 indicate that enterprises did not adopt strategic emissions reduction to cope with JAPCP, rejecting Hypothesis H3.
Substantial Emissions Reduction: End-Of-Pipe Treatment and Source Control
The explained variable in column (3) of Table 5 is the SO2 disposal amount (lnproso2). The coefficient of DID is significantly negative, indicating that end-of-pipe treatment is not a mechanism of the JAPCP in suppressing border SO2 emissions. The explained variables in columns (4) and (5) are enterprises’ number of patent applications and authorizations, respectively. The coefficients of DID are significantly positive at 1%, indicating that the JAPCP can reduce enterprises’ SO2 emissions by enhancing their innovation capabilities, verifying the Porter hypothesis. The above conclusions demonstrate that source control is the mechanism by which the JAPCP reduces border SO2 pollution, partially supporting Hypothesis H4.
Table 5.
Mechanism analysis and heterogeneity analysis.
Heterogeneity Analysis
Sufficient fiscal revenue is an important support for the effective JAPCP implementation. China’s fiscal decentralization system causes a severe imbalance between local expenditure responsibilities and revenue capacity. When fiscal pressure is high, local governments are more prone to sacrifice long-term environmental benefits for short-term economic growth, ultimately weakening the control effect of environmental regulations [55]. Therefore, we expect that the JAPCP’s control effect on border pollution will be more pronounced in regions with less fiscal pressure. We measure local governments’ fiscal pressure by the ratio of municipal fiscal expenditure to revenue. Taking the average fiscal pressure as the criterion, samples with values above the average are defined as the high fiscal pressure group (Hfispres); otherwise, they are defined as the low fiscal pressure group (Lfispres). The results in columns (6) and (7) of Table 5 show that the pollution control effect of the JAPCP is only effective for the low fiscal pressure group, supporting our conjecture.
Most of the existing literature on JAPCP focuses on Beijing-Tianjin-Hebei (BTJ) alliance/region. As BTJ is the first national regional strategy and a model for governance reform, we predict that the environmental control effect of the JAPCP in BTJ will be greater than in non_BTJ alliances/regions. The results in columns (8) and (9) of Table 5 show that in the BTJ alliance/region, the JAPCP can reduce SO2 emissions by 40.5%, while in non_BTJ alliances/regions, the effect is 16.5%. More importantly, in the full sample, the emissions reduction effect of JAPCP is 23.6%, indicating that using only BTJ as the research object will overestimate the pollution control effect of the JAPCP.
Finally, we perform a group regression using the key and non-key areas delineated by the JAPCP. The results in columns (10) and (11) of Table 5 show that the coefficient of DID is significantly negative only in non-key areas, but not in key areas, demonstrating that pollution control in key areas requires more attention.
Conclusions
China established the JAPCP cross-jurisdiction air pollution control policy. In this study, we use industrial enterprise pollution data to evaluate the micro-governance effect and mechanism of the JAPCP on border SO2 pollution. The relevant results are fourfold. First, SO2 emissions in border areas are higher than in non-border areas, indicating that border SO2 pollution exists. Second, the JAPCP effectively suppressed the SO2 emissions of enterprises located in JAPCP-covered border counties, demonstrating that the JAPCP has a border pollution control effect. Third, the JAPCP can alleviate border SO2 pollution caused by externalities, EAD and political promotion incentives. Fourth, the JAPCP has a Porter effect and can control SO2 pollution by driving enterprise innovation, and the emissions reduction effect of the JAPCP is not due to enterprises’ strategic emission reduction practices. In addition, the emissions reduction effect of the JAPCP is greater in areas with lower fiscal pressure, the BTJ region, and non-key areas.
Our findings have valuable policy implications. First, our results demonstrate the effectiveness of inter-jurisdictional collaborative governance of air pollution. Therefore, environmental policies should consider inter-jurisdictional cooperation. Second, the Chinese central government should prioritize environmental protection in local governments’ performance evaluation system and improve direct supervision of local governments to prevent opportunistic environmental behavior. Third, governments should actively support enterprises’ innovation activities to better facilitate the JAPCP’s pollution control mechanism.

