

Introduction
Air pollution is a great environmental challenge in today’s society. Air pollutants are a complex combination of gases and particulate matter [1]. Particulate air pollution is a mixture of solid, liquid, or solid and liquid particles suspended in the air [2]. PM is emitted directly into the atmosphere (primary) or formed in the atmosphere through gas-to-particle conversion (secondary) [1]. PM particles often contain heavy metals such as Mn, Co, Ni, Cu, Cd, and Pb, with their concentrations significantly higher in industrial areas within urban settings [3]. Air pollution in cities is a serious environmental problem where the air quality is the result of a complex interaction between natural and anthropogenic environmental conditions, especially in developing countries [4, 5]. Today, Skopje is one of the most polluted cities in Europe [5], where numerous studies show that PM10 concentrations exceeded the annual limit value, peaking during the winter [5, 6]. Often, these pollutants cause severe conditions in human health, particularly respiratory diseases [7, 8]. The consequences of air pollution with particulate matter suggest that in selected North Macedonian cities 1,903 human lives (excess deaths) are lost annually due to PM exposures [9], while the estimated economic cost associated with mortality from exposure to air pollution in North Macedonia is in the range of US$ 500-900 million annually, equivalent to 5.2-8.5% of gross domestic product (GDP) in 2016 [10]. The air in Skopje is one of the most polluted in the world because of the city’s natural position and people’s reliance on fossil fuels [11]. The geographical position of the city plays a key role in the air pollution. Topography and meteorological conditions contribute to poor air quality in Skopje [12]. Skopje is geographically located in a basin surrounded by mountains, which entraps the pollution; there is insufficient aerial circulation that can otherwise help in diluting the toxic air [13, 14]. Contemporary studies have noted that the climate change impact is more influential in the mountainous areas [15], which is a main geographical characteristic in North Macedonia as a country with around 80% hilly mountain surface. The main anthropogenic sources of ambient PM air pollution in North Macedonia in 2014 were identified as: residential heating (36% of total primary emissions), industrial processes (33%), and energy production (20%). Traffic contributed 2% of the total emissions of PM particles [9]. The low traffic effect was proven elsewise in the neighboring countries [16]. The conducted studies for the air pollution in Skopje provide indicative data that domestic households’ biomass combustion has the largest impact on the disturbed air quality in Skopje, especially for the emission of suspended particles PM10. This also corresponds with the fact that households in Skopje are using stoves with inefficient fuel combustion and low-quality fuels of suspicious origin [17].
Many scientific studies confirm the impact of meteorological factors on air pollution [18-20].
Although previously mentioned anthropogenic factors contribute to the natural conditions in the city of Skopje, the meteorological parameters exert a substantial influence on the prevalence of air pollution in Skopje. This is confirmed by the fact that the highest concentrations of air pollution and PM10 pollutants are measured during the winter period. The high concentrations of air pollutants are observed during stable atmospheric conditions, with emitted substances accumulating in the basin. During these periods, there is reduced circulation in the atmosphere due to prolonged periods with weak winds, foggy days, and very little rain, as well as the occurrence of temperature inversion [21].
In general, the studies showed a negative correlation of PM10 with the air temperature and the atmospheric pressure, and a positive correlation with the relative humidity [22-26].
Wider European study analyzed the effect of geographical parameters on PM10 in European landscapes. The results showed that in the cooling season, air temperature, precipitation, and wind speed are the most important factors for PM10 concentrations in suburban regions. Although all of the previously mentioned climate parameters are important, the results showed that precipitation has the highest impact on the pollutant. In the urban areas, the effect of these three climate variables is significantly lower [27].
Despite these findings, the specific relationship between meteorological factors and PM10 concentrations in Skopje remains underexplored. Given that climatic factors influence each other as well as particulate matter concentrations – for instance, the speed and direction of the wind directly influence environmental factors such as air temperature, humidity, and dust transport [28], all of which play a crucial role in air pollution dynamics – this study aims to fill this gap by analyzing how meteorological parameters impact PM10 levels in Skopje’s unique geographical and climatic context.
This study enhances the understanding of PM10 variability by applying Multiple Linear Regression (MLR) to quantify the impact of meteorological factors while controlling for multiple variables simultaneously. Unlike generalized assessments, it ensures statistical validity through data transformation techniques and addresses autocorrelation issues, improving the reliability of the model. By tailoring MLR to Skopje’s unique geographical and climatic conditions, this research provides a more precise and data-driven approach to analyzing air pollution dynamics.
Understanding this relationship is vital for developing targeted strategies to manage air pollution in the city. The results will provide critical insights for authorities to mitigate air pollution through a better understanding of these correlations.
Study Area
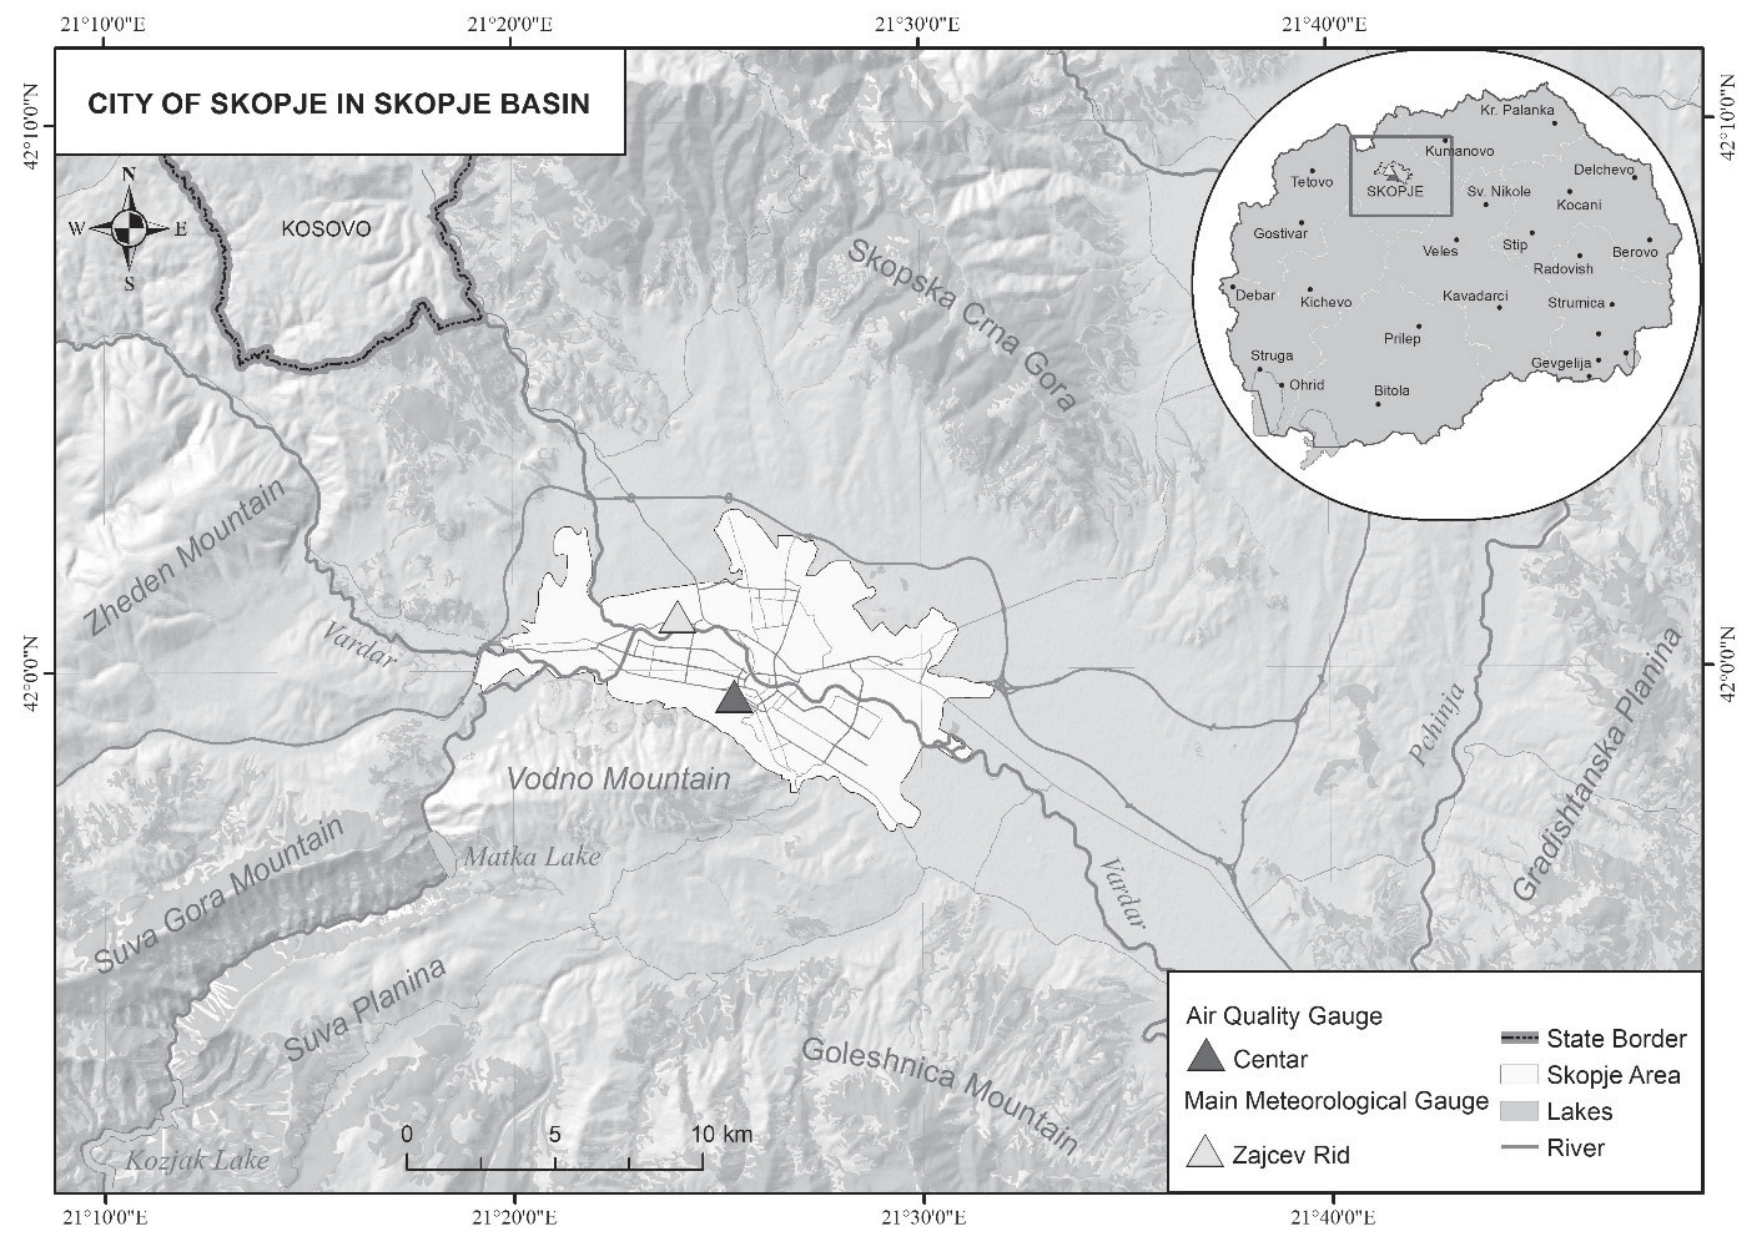
The City of Skopje is situated in the Skopje Basin, located in the northern region of the Republic of North Macedonia, between 41°42’15’’N and 42°16’20’’N, 21°09’40’’E and 21°49’15’’E., along Greenwich (Fig. 1 and 2). The geographical boundaries of this area are defined by the mountain massif Karadzica and Goleshnica from the south, Mountain Gradeshka from east to the Ovche Pole (plain), the Kumanovo Valley and the Skopska Crna Gora massif from north, and the Zheden Mountain from west separates it from the Polog Valley. Within this geographical frame, the Skopje basin covers an area of 1924.2 km2, of which 343.9 km2 are flatland located in a hypsometric belt of 150-300 m.a.s.l. [29].
From an administrative perspective, Skopje is a key component of the Skopje region, one of the eight statistical regions in the Republic of North Macedonia. Within its boundaries, Skopje encompasses ten municipalities, while the entire region covers an expanse of 1812 km2; the city extends over an area of 571.97 km2 [30].
As of the most recent census conducted in 2021, Skopje is home to a total population of 526,502 residents, which is 27.7% of the entire population of the Republic of North Macedonia [30]. However, it is estimated that on a daily basis, the number is higher due to the fact that a large number of residents from other regions often migrate and stay in the city due to work obligations, study, etc. Both the increasing population and migration from rural to urban areas lead to the inevitable opening of new areas for settlement in urban centers [31]. Constant internal migrations to the capital are also the main reason for the need to build new housing facilities.
Fig. 1.
Geographical position of the city of Skopje within the Republic of North Macedonia. DEM Source: USGS 2015, Data Source: OSM.
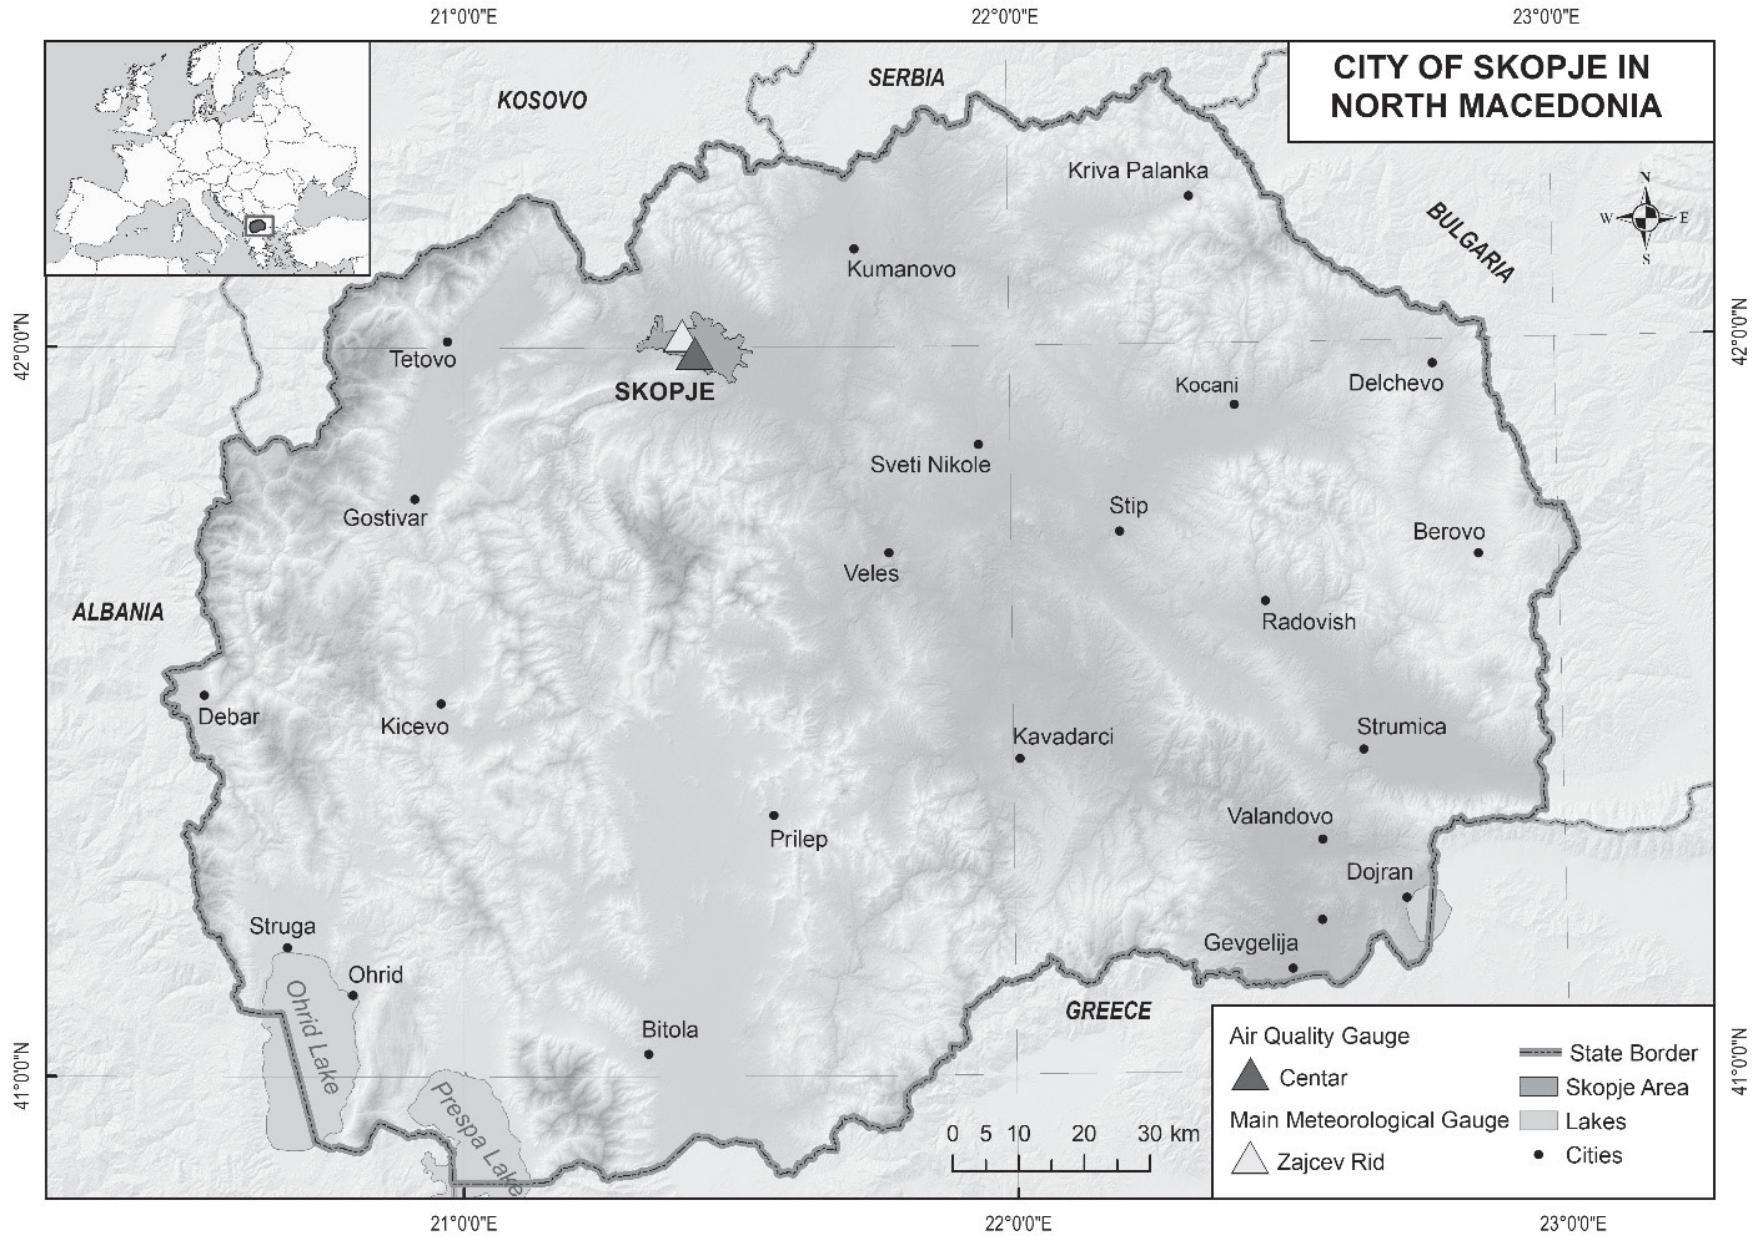
Fig. 2.
Geographical position of the city of Skopje within the Skopje Basin. DEM Source: USGS 2015, Data Source: OSM.
With the increase of the urbanization in the city, the air purification is additionally interrupted, and with the construction of high buildings in a narrow space in the central area of the city, the natural and necessary circulation of the winds, which would be used to purify the air in a natural way, becomes more difficult [32].
The majority of industrial, commercial, and service facilities are concentrated within the city. Functioning as the capital of the Republic of North Macedonia, Skopje serves as the nation’s economic, administrative, and cultural hub.
Due to the constant expansion of the city, rapid urbanization, and the adoption of a fast-paced, modern lifestyle, Skopje has become a subject of research regarding its longstanding issues with air pollution, mainly focusing on analyzing the causes, consequences, and potential solutions to address the present environmental challenges in the capital.
The geographical position and orographic peculiarities are the main modifiers of the climate in the city of Skopje.
The Skopje basin is influenced by the continental climate from the north, the Mediterranean climate from the south, and their modifications. The average annual air temperature is 12.7°C [33]. Air temperature inversions in the Skopje basin occur in all months, but they are strongly expressed in the winter months, most often during anticyclone weather situations.
The Skopje Basin is a specific area with frequent occurrences of fog and temperature inversions. In such weather conditions, air pollution increases. On the days with temperature inversions, it is coldest in the low parts of the basin, while the temperature increases with altitude towards the higher regions of Vodno and Skopska Crna Gora mountains [33].
Precipitation is unevenly distributed throughout the year (monthly and seasonally). The lowest values were registered in the months of February and July. The average annual amount of precipitation (1951-2010) ranges from 497.5 mm in the plains to about 700 mm in the highest parts of Vodno and the low slopes of Skopska Crna Gora Mountain [33].
In the Skopje Basin in the average multi-year wind time series, the most frequent wind directions are from the north and south, and a factor that contributes to the higher air pollution is the fact that the urban part of the Skopje basin has a much higher frequency of silences - conditions without wind [33].
Тhe relative humidity in the Skopje basin decreases from January to August and increases from August to December. The highest monthly values of relative humidity are in November, December, and January at 82-84%, and the lowest average monthly relative humidity values are in July and August, at 56- 57% [33].
The Skopje basin is characterized by an increased frequency of days with fog. Fog occurs throughout the day, but with the highest frequency in the morning.
The highest frequency of fog occurs in the winter period, in December, with an average of 15 days with fog, and in November, December, and January, with 61% of the total annual average number of days with fog occurring. On average, there are 63 days with fog in the Skopje basin [33].
Materials and Methods
In this scientific paper, the focus is placed on analyzing the data predominantly sourced from state institutions of the Republic of North Macedonia. The data analysis for the meteorological parameters for the period of nine years (2012-2020) was taken from the main meteorological gauge “Zajchev Rid” – Hydro meteorological Service of the Republic of North Macedonia and the data for the concentrations of the air pollutant PM10 was gathered from the gauge for air quality “Centar” – Ministry of Environment and Spatial Planning of North Macedonia for the same time period as the meteorological parameters. The problem of the relatively short analyzed period of the time series is a consequence of the short-term organized air pollution measurement in North Macedonia, where continuous measurement started in 2012.
The whole statistical analysis (descriptive statistics, testing normality and multiple linear regression, ANOVA testing) was run on the software “XLSTAT”.
Since all of the cities in the Republic of North Macedonia, including the city of Skopje, have serious issues with air pollution, especially with the concentration of PM10 in the winter period, the standards for permitted concentrations are shown in Table 1.
Descriptive statistics were used for summarizing, organizing, and presenting data meaningfully and concisely. It can be presented as measures of central tendency (mean, median, mode, and range). In order to complete the multiple linear regression on the meteorological variables and PM10, a normality analysis was conducted on the raw data using the Shapiro-Wilk test.
The Shapiro-Wilk test has two hypotheses:
– Null Hypothesis (H0): The data follows a normal distribution.
– Alternative Hypothesis (Ha): The data does not follow a normal distribution
The Shapiro-Wilk test is particularly suitable for small to medium-sized datasets [37].
Table 1.
Standards for permitted concentrations of PM10.
| Community/ Variable | Air Pollutant | Period | Limit Value (µg/m3) |
|---|---|---|---|
| MKD | PM10 | 24 h | 50 |
| Annual | 40 | ||
| EU | PM10 | 24 h | 50 |
| Annual | 40 | ||
| WHO | PM10 | 24 h | 45 |
| Annual | 15 |
The main statistic W is estimated as follows:
Where xi are ordered sample values, ai are constants derived from the covariance matrix, and xav is the sample mean.
For the Shapiro-Wilk test, the significance level is 0.05, which means that if the p value is higher than the significance level, the data has a normal distribution [37].
Since some of the parameters didn’t have a normal distribution, we used the Box-Cox transformation on the chosen data, and the results can be seen in Table 2. The Box-Cox transformation is applied to stabilize the variance and make the dataset closely approximate a normal distribution. It was necessary to transform this variable before attempting a multilinear regression [38].
λ determines the type of transformation (e.g., logarithmic when λ = 0). It is commonly used in regression and time series analysis to meet normality and homoscedasticity assumptions.
After the data had a normal distribution (tested again with the normality test Shapiro-Wilk), the transformed data of four meteorological variables and PM10 particles, similar time series data, were used in the multiple linear regression analysis.
Multiple regression analysis (MR) is a highly flexible system for examining the relationship of a collection of independent variables (or predictors) to a single dependent variable (or criterion) [39, 40]. The equation for multiple linear regression has the same form as that for simple linear regression, but has more terms:
As for the simple case, β0 is the constant, which will be the predicted value of y when all explanatory variables are 0. In a model with 𝑝 explanatory variables, each explanatory variable has its own β-coefficient. Again, the analysis does not allow us to make causal inferences, but it does allow us to investigate how a set of explanatory variables is associated with a response variable of interest [41].
The degree of association is measured by a correlation coefficient, denoted by r. It is sometimes called Pearson’s correlation coefficient after its originator and is a measure of linear association (Table 3). If a curved line is needed to express the relationship, other and more complicated measures of the correlation must be used [42].
The goodness of fit for the multiple linear regression (MLR) model was evaluated using several statistical metrics. The R2 value was analyzed to determine the proportion of variance in the dependent variable explained by the independent variables. It contains various variables, the most important of which are the F-statistic and p-value [37].
The F-statistic tests the significance of the MLR model as follows:
High F-value with a low p-value (<0.05) suggests that the model is significant and at least one independent variable is useful for predicting the dependent variable. Additionally, the Adjusted R2, AIC, and BIC values were examined to account for the number of predictors and ensure model accuracy and parsimony [41].
Following the MLR analysis, we conducted an Analysis of Variance (ANOVA) to test the significance of the overall model and to identify which meteorological parameters significantly influence PM10 levels. The ANOVA decomposes the total variability in PM10 concentrations into components attributed to the model and residual error, providing F-statistics to assess the explanatory power of the predictors [43]:
The MS model is usually used when testing the MLR model [44], which is the mean square of the model, and MS error is the mean square of the error. This two-step approach allowed us to evaluate the relationship between meteorological conditions and PM10 pollution rigorously.
Table 2.
Shapiro-Wilk normality test results.
| Distribution of Parameters | p–value |
|---|---|
| Tair | 0.051 |
| RH | 0.143 |
| WS | 0.1 |
| P | 0.6 |
| PM10 | 0.06 |
Table 3.
Detailed classification of Pearson correlation coefficient (r) values.
Results
The descriptive statistics of the data collected from January 2012 to December 2021 of the data collected from the gauges Zajchev Rid and Centar are given in Table 4.
The mean air temperature (Tair,) measured at the gauge Zajchev Rid was 13.8ºC while the standard deviation was 8.3ºC. There is a huge range between the minimum, which is -4.0ºC, and the maximum, which is 27.7°C. The mean RH was 65.3% while the standard deviation was 10.9%. The minimal range for the measured period was 39.0%, and the maximum was 88.0%. The mean WS has a mean value of 2.5 m/s, and the standard deviation is 0.4 m/s. The minimum was 1.8 m/s while the maximum was 3.5 m/s. The mean precipitation measured for the given period was 44.8 mm/m2, and the standard deviation was 34.0 mm/m2. For the PM10, the mean was 61.0 µg/m3 while the standard deviation was 40.0 µg/m3. The minimal range was 23.9 µg/m3 and the maximum was 238.3 µg/m3, which is a difference of 214.4 µg/m3 (Table 4 and Fig. 3).
Since the descriptive analysis was made on raw data, the next step was the normality test, which was applied to the data. All of the parameters, except the data for wind speed, didn’t follow a normal distribution, so the Box-Cox transformation was applied to the chosen data.
After the data had a normal distribution, the Shapiro-Wilk normality test was applied, which is shown in Table 2.
After the normality test, the multiple linear regression was conducted in order to test the significance of the independent variables, i.e., the meteorological parameters, in a linear regression where PM10 is chosen as the dependent variable.
From Table 5. It can be seen that air temperature has the strongest negative correlation in comparison with the other observed meteorological parameters, with PM10, which is r = -0.76, (p = 0.0001), where, according to the classification given in Table 3, is classified as a moderate negative linear correlation. The negative correlation between air temperature and PM10 concentration indicates that higher average temperatures are associated with lower PM10 levels, while lower temperatures correspond to higher PM10 concentrations. The second strongest correlation of all climate parameters is the positive correlation between relative humidity and PM10, which according to the classification signifies a moderate positive correlation with correlation coefficient r = 0.42 (p = 0.24). Contrary to the negative correlation between air temperature and PM10, the positive correlation between relative humidity and PM10 means that when the relative humidity percentage is higher, the concentrations of PM10 in the air are also higher, and when the relative humidity percentage is lower, the concentrations of PM10 in the air are also lower.
The other climate parameters – wind speed (WS) and precipitation (P) have weak negative correlation with PM10 where the correlation coefficient between wind speed and PM10 is r = -0.32 (p = 0.06), while the correlation coefficient between precipitation and PM10 is the lowest of all previously analyzed climate parameters, which is r = -0.19 (p = 0.01).
From the previously analyzed results, it can be noticed that in the investigated period for the given gauges, the meteorological parameters: air temperature, wind speed, and precipitation have a negative correlation with PM10, while relative humidity has a positive correlation with PM10. The obtained MLR equation is as follows:
Table 4.
Descriptive statistic of the collected data.
Fig. 3.
Box plots 1. The median (denoted by a horizontal bar in the box), the 25th percentile (denoted by the bottom edge of the box), the 75th percentile (denoted by the top edge of the box), the 5th percentiles (denoted by the bottom edge of the whisker), the 95th percentiles (denoted by the top edge of the whisker). Source: authors.
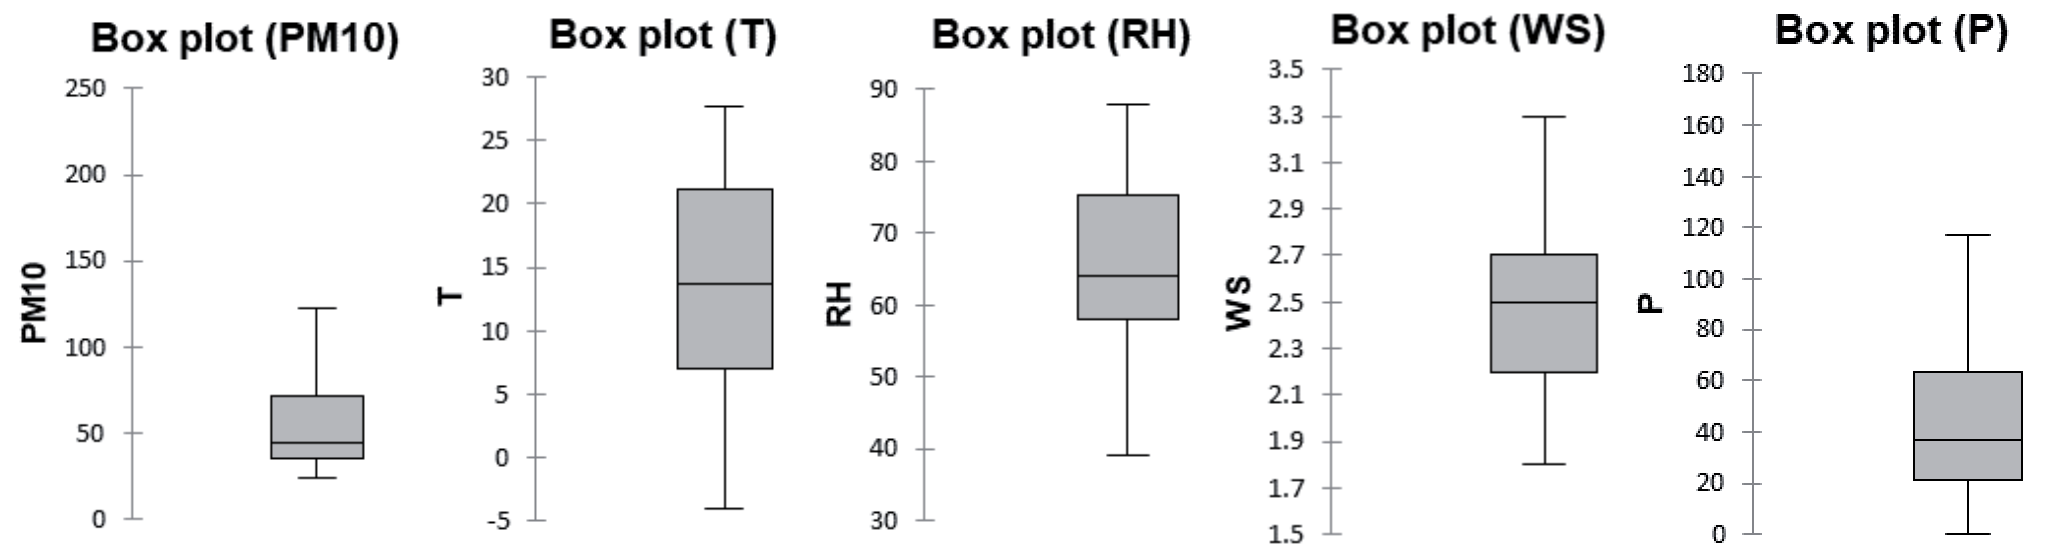
Table 5.
Pearson correlation (r) between meteorological parameters and PM10 concentrations.
| RH | P | WS | Tair | PM10 | |
|---|---|---|---|---|---|
| RH | 1 | 0.010 | 0.097 | -0.659 | 0.415 |
| P | 0.010 | 1 | -0.071 | -0.007 | -0.192 |
| WS | 0.097 | -0.071 | 1 | 0.246 | -0.316 |
| Tair | -0.659 | -0.007 | 0.246 | 1 | -0.763 |
| PM10 | 0.415 | -0.192 | -0.316 | -0.763 | 1 |
This Equation represents the relationship between PM10 concentration and the meteorological factors (Relative Humidity, Precipitation, Wind Speed, and Air Temperature) based on the coefficients obtained from the regression analysis.
Where:
– The constant term (0.164) represents the intercept of the regression equation, indicating the value of PM10 when all independent variables are zero;
– The beta values, or regression coefficients, indicate the expected change in the dependent variable for a one-unit change in the corresponding independent variable, while holding other variables constant.
The goodness of fit procedure was performed (see Table 6).
The sum of weights indicates that each observation is equally weighted (weight of 1 per observation). Degrees of freedom for the error term, which is the total number of observations minus the number of parameters estimated (including the intercept).
R² (Coefficient of Determination): 0.648 indicates that 64.8% of the variability in PM10 levels is explained by the model.
Adjusted for the number of predictors in the model, providing a more accurate measure than R² when multiple predictors are involved. This value indicates that 63.5% of the variability is explained by the model after adjusting for the number of predictors. The average of the squared differences between observed and predicted values. This value, being very close to zero, indicates a good fit. The square root of the MSE provides a measure of the average magnitude of the error in the same units as the response variable (PM10). A small RMSE indicates a good fit of the multiple linear regression, the average absolute percentage error between observed and predicted values. A MAPE of 3.476% indicates that, on average, the predictions are within 3.476% of the actual values. The Durbin-Watson statistic is a measure of autocorrelation in the residuals. Values close to 2 indicate no autocorrelation, while values closer to 0 or 4 suggest positive or negative autocorrelation, respectively. A DW of 0.587 indicates potential positive autocorrelation. Cp is a measure used to assess the fit of regression models, ideally close to the number of predictors plus the intercept. Here, Cp being 5 suggests a model with potentially 4 predictors is well-specified. AIC (Akaike Information Criterion) is a measure of model quality, with lower values indicating a better fit. Negative values suggest a very good model fit.
Table 6.
Goodness-of-fit of the data.
SBC (Schwarz Bayesian Criterion/BIC) is similar to AIC but includes a penalty for the number of parameters. Lower values indicate a better model. PC (Prediction Criterion) is another measure of model fit, with lower values indicating better predictive accuracy.
The p-value (<0.0001) in ANOVA indicates the probability that the observed F-value would occur if the null hypothesis were true. A very small p-value (less than 0.05) suggests strong evidence against the null hypothesis, indicating that the model is statistically significant. The ANOVA results (Table 7) indicate that the model is highly significant (p<0.0001), meaning that the variations explained by the model are much greater than would be expected by chance. The model explains a significant portion of the variability in PM10 levels. A high F-value (47.449) suggests that the model provides a good fit to the data. The degrees of freedom and the sum of squares give insight into how much variation is being explained by the model versus the error.
The results section offers a detailed analysis of meteorological factors and their relationship with PM10 concentrations. Air temperature showed a moderate negative correlation with PM10 (r = -0.76), indicating reduced concentrations during warmer conditions. In contrast, relative humidity displayed a moderate positive correlation (r = 0.42), suggesting that higher moisture levels contribute to increased PM10. Wind speed and precipitation had weaker negative correlations, indicating limited effects on PM10 dispersion or removal. The multiple linear regression model explained 64.8% of the variability in PM10 levels, with goodness-of-fit measures supporting its reliability.
The findings indicate a statistically significant relationship between meteorological parameters and PM10 levels, yet the model’s explanatory power (R² = 64.8%) suggests that nearly 35% of the variation remains unexplained, potentially influenced by unaccounted emission sources or secondary aerosol formation. The strong negative correlation between air temperature and PM10 may reflect seasonal heating and emission patterns rather than a purely meteorological effect, warranting further investigation into emission inventories. Additionally, the positive autocorrelation (DW = 0.587) suggests potential temporal dependencies in PM10 levels, indicating the need for time-series modeling or non-linear approaches for improved predictive accuracy.
Discussion
Several scientific studies proved that the meteorological conditions can affect air pollution. More precisely, some meteorological parameters affect the atmospheric pollution [46-51]. Multiple linear regression has been widely applied in various cities to investigate the relationship between meteorological factors and air pollution, as urban areas often face challenges with poor air quality. Some other scientific research that analyzed the correlation between the meteorological parameters (Tair, WS, RH, and P) on PM10 proved similar results to this research (Table 8).
Table 8 contains the correlation data between PM10 levels and key meteorological parameters - air temperature (Tair), precipitation (P), relative humidity (RH), and wind speed (WS) - across various locations, including cities and regions. For instance, in Tirana and Skopje, a strong negative correlation with temperature indicates that higher temperatures correspond to lower PM10 levels, likely due to enhanced atmospheric dispersion. In contrast, regions like Northern Thailand and cities such as Athens show positive correlations between air temperature and PM10, suggesting that warmer conditions may contribute to increased particulate matter concentrations. Wind speed generally has a negative correlation with PM10 in most areas, including Athens and Transylvania, indicating that stronger winds help disperse pollutants. These correlations highlight the varied influence of meteorological factors on PM10 levels, shaped by local geographical and climatic conditions.
Table 7.
Analysis of variance, ANOVA (PM10).
| Source | DF | Sum of squares | Mean squares | F | Pr > F |
|---|---|---|---|---|---|
| Model | 4 | 0.006 | 0.002 | 47.449 | < 0.0001 |
| Error | 103 | 0.003 | 0.000 | ||
| Corrected Total | 107 | 0.010 |
Table 8.
Correlation coefficient (r) between PM10 and meteorological parameters in the researched cities.
In the Table 8, samples of research in different cities are presented, using the same methodology.
From the given table, it can be noticed that the correlation between air temperature (Tair) and PM10 varies from strong negative correlation (r = -0.88) in Tirana to moderate positive correlation in Northern Thailand (r = 0.53) and in Athens (r = 0.44). In the city of Skopje, the correlation between the two variables is (r = -0.76), which is a moderate negative correlation. The similarity between the results from Tirana and Skopje can be explained by the geographical closeness between the two cities, although the cities have different climates, they have similar population rates, and both cities have bad air quality due to some anthropogenic factors such as urbanization and residential heating. In all of the researched areas, the correlation between PM10 and air temperature was negative.
Skopje indicated a weak negative correlation between PM10 and precipitation (r = -0.19), suggesting that rainfall marginally helps reduce PM10 levels by washing particles out of the air. In comparison, regions like Pune (r = -0.17) and Moldova (r = -0.06) show similar weak negative correlations. In contrast, Transylvania (r = 0.34) shows a moderate positive correlation, which is unusual since rainfall typically reduces particulate matter. This discrepancy may be related to local factors such as soil composition or post-rain re-suspension of particles. Other cities, such as Sosnowiec (r = 0.03) and Athens (r = 0.17), also show weak positive correlations.
Considering the fact that relative humidity has seasonal variability, which shapes the dynamics of the local ecosystems, which then affects the urban life quality [60], Skopje has a moderate positive correlation between PM10 and relative humidity (r = 0.42). As mentioned before, the Skopje basin has a lot of days with fog, which suggests that in the winter period, the fog could keep the PM10 pollutant longer in the air, which could explain the positive correlation between relative humidity and PM10.
This trend is mirrored in almost all of the researched areas, for instance, regions like Izmir (r = 0.70), where it was concluded that the RH affects the natural deposition process of PM10, and Northern Thailand (r = 0.60), where higher humidity is linked to higher PM10 levels. This could be due to moisture facilitating the aggregation of particles, increasing their size and concentration in the air. However, in some cities such as Athens (r = 0.01) and Istanbul (r = 0.01), the correlation is almost negligible. In some studies, relative humidity has been found to exhibit a negative correlation with PM10 levels [61-63]. However, in locations such as Pune (r = -0.23) and China (r = -0.18), the relationship is more varied, displaying a weak inverse correlation.
The Pearson correlation between wind speed and PM10 is generally negative, ranging from a moderate negative correlation (r = -0.59) in Athens to a weak positive correlation (r = 0.04) in Northern Thailand. In most of the studied areas, the correlation remains negative, as observed in Skopje, where the correlation coefficient is (r = -0.32).
We took into consideration the fact that the relationship between PM10 concentrations and meteorological parameters differs between seasons, as well as between years, i.e., have seasonal and annual variation [64] and also the geographical position of the region has a key role in the impact of the meteorological parameters on PM10 as previously mentioned.
Comparing the seasonal differences, research made in Shenyang, China, showed results where PM10 had a negative correlation with wind speed and air temperature in autumn and winter, but no significant correlation in spring and summer [48].
The very low number of MSE<0.0009 confirmed that the model of MLR in this research is very well fitted, which is complementary with a previous study about the impact of meteorological factors on PM10 in Kocaeli, Turkey, where MSE varies from 0.00019 to 0.00086 [61].
The results of RMSE show a much lower value of 0.0006 and an excellently fitted MLR compared with the results from Pune, India, where the RMSE = 20.5 [59].
Although, in the city of Skopje, air pollution is a consequence of the geographical position, anthropogenic factors such as high population density, urbanization and the frequent usage of fossil fuels, in this paper was also proved the contribution of the meteorological parameters (air temperature, precipitation, wind speed and relative humidity) on the concentration of PM10 with the correlation between all observed meteorological parameters.
In future studies, these results could be combined with other complementary methodologies like canonical correlation analysis, which determines air temperature as the best-correlated factor to PM10 concentrations [65].
Conclusions
Air pollution is a significant problem in today’s city of Skopje. A lot of factors cause the bad air quality, which also has great consequences for the residents of the city.
The Skopje basin is surrounded by mountains, which entrap the pollution that is affected by insufficient aerial circulation. The climate conditions, which are characterized by frequent occurrences of fogs and temperature inversions, worsen the air pollution.
To the mentioned geographical conditions, huge contributors to the bad air quality are the anthropogenic factors, which play a key role in the air pollution that occurs during the winter, such as residential heating, which is overall the main cause of the air pollution in the city.
The results of the multilinear regression between the meteorological parameters and PM10 showed that, mostly in the researched areas, the meteorological parameters were in negative correlation with PM10, except relative humidity, which in the researched areas mostly had positive correlation with PM10. The results showed that in the city of Skopje, as the air temperature lowers, the PM10 values go higher, i.e., the air quality worsens as a consequence of frequent use of non-environmentally friendly ways of residential heating. Precipitation and wind speed also have a negative correlation with PM10. Although the correlation between precipitation and wind speed is not significant it also showed that precipitation and wind speed can have an impact on the concentrations of PM10, which can be explained with the fact that wind speed and direction significantly influence local microclimates, thermal comfort and air quality [28] where stronger winds help disperse airborne pollutants, thus lowering PM10 levels, while rainfall cleans the air by washing away particulate matter. Humidity is positively correlated with PM10 as a result of the frequent days with fog, which can be explained by the fact that the fog entraps the PM10.
The methodology in this paper is complementary to many studies that explored the correlation between meteorology and PM10 in many urban cities. It can be concluded that variations in correlation may arise due to differences in climate, geographical location, topography, and socio-economic factors in the region. The strong negative correlation between air temperature and PM10 concentrations may be influenced not only by meteorological conditions but also by seasonal variations in emissions, such as increased heating-related pollution in colder months. This highlights the need for a more comprehensive analysis incorporating emission inventories to distinguish meteorological effects from anthropogenic influences. Additionally, the positive autocorrelation (DW = 0.587) suggests that PM10 levels exhibit temporal dependencies, meaning past concentrations may influence future values. This indicates that traditional regression models may not fully capture the underlying patterns, and more advanced time-series or non-linear modeling approaches could improve predictive accuracy.
This study could be extrapolated to all Balkan capitals in order to investigate the main causes for air pollution, since the Balkan Peninsula, as a geographical region, has the most polluted air in Europe.

