

Introduction
Vegetation is an important part of terrestrial ecosystems and plays an important role in water conservation and environmental protection [1]. In recent years, the global climate is changeable, natural disasters occur frequently, unreasonable human activities occur, and vegetation degradation occurs locally or globally, resulting in a reduction of vegetation coverage, soil organic carbon (SOC), and total nitrogen (TN) content [2, 3]. Therefore, carrying out regional vegetation related research and investigation is the premise and foundation of natural ecosystem restoration, which is very effective in improving regional soil quality and curbing the deterioration of the ecological environment. Ecological stoichiometry focuses on the balance and coupling of the main elements, such as carbon, nitrogen, and phosphorus, and organically unifies the research theories of different levels of molecules, cells, organisms, popula-tions, and ecosystems based on the ratio between elements and elements [4–6]. Soil ecological stoichiometry provides a basis for understanding ecosystem processes, such as primary production and nutrient cycling, through the relative proportion and balance of C elements in soil, N, and P [7]. Soil C:N:P stoichiometry can represent the characteristics of nutrient cycling in different vegetation soil microenviron-ments [8]. C:N and C:P affect the growth rate of vegetation [9], which also reflects the utilization efficiency of vegetation on soils N and P. Previous studies have conducted a lot of research on soil stoichiometry in the central Himalayas [10], the Loess Plateau of China [11], southwestern China [12], and South China [13], with few studies on Karst areas [14, 15]. Most of the existing studies have focused on the effects of different land use patterns [16–18], vegetation recovery patterns [19], and fertilization measures [20–22] on soil stoichiometric changes. Climate conditions, terrain, parent material, anthropogenic, and many other factors will affect the soil stoichiometry [2, 23–25]. For example, warming increases in soil N:P and vectorial angle (reflecting P limitation by soil microbes) of 4.2% and 2.0%, respectively [26]. A large number of studies have shown that soil carbon, nitrogen, and phosphorus content and reserve changes respond to vegetation [19, 22], and different vegetation have found inconsistent C, N, and P content and their stoichiometry.
The ecosystem of the Karst region in southwest China is extremely fragile, with low disaster threshold elasticity and sensitivity that is susceptible to adverse factors. Vegetation restoration is an important ecological management measure in this region, and vegetation restoration is considered to be an effective measure to increase the retention of SOC [27, 28]. Vegetation species can affect the number, composition, and law of litter and ultimately affect soil carbon, nitrogen, and phosphorus [17, 19, 28].
At present, the research on soil stoichiometry in Karst areas mainly focuses on different vegetation types [19, 29] and restoration measures [15]. However, the C, N, and P content, reserves, and stoichiometric evolution of limestone soil in Karst areas are rarely reported. We hypothesized that the C, N, and P stoichiometric characteristics in Karst lime soil varied according to the vegetation. This paper veri-fies the hypothesis of different vegetation recovery types, recovery years (15a), terrain, and soil types and discusses the stoichiometry of soil C:N:P under different vegetation of adjacent agricultural land control (ZM), grassland (IC), shrub land (PF), and orchard (AP).
Experimental
Study Area
Pingba District, Anshun City, Guizhou Province, in the central part of Guizhou Province, Southwest China, is the study area of this project (26°11′07″~26°36′56″N, 105°56′20″~106°39′10″E), and has a humid subtropical climate with an average annual rainfall of 1165 mm and a temperature range of 12.80 to 16.20°C. The mountain system is part of the Miaoling mountain range, which is mostly northeast-southwest oriented, non-parallel, and poorly continuous. The mountain system belongs to the Miaoling mountain range and is mostly north–east– south–west oriented, non-parallel, and poorly continuous. Most of the area is hilly, and the Karst landscape is very pronounced, with a thin layer of soil and a high proportion of gravel in the soil. The parent rocks of the area are mainly limestone and muddy gray rocks, and the soil type is predominantly calcareous. There are diverse vegetation types, dominated by scrub, arable, woodland, and grassland, with vegetation dominated by hawthorn, artemisia, raspberry, rowan, parkland, and white fescue.
Sample Sampling and Determination
Soils of three vegetation types (15a) were selected in the study area through a survey of the main vegetation types in the area in August 2022, identifying grassland (Imperata cylindrical (L.) Beauv., IC), shrubs (Pyracantha fortuneana., PF), and orchards (Amygdalus persica L., AP), with an adjacent agricultural field as a control (Zea mays., ZM) (Table 1). The selected sampling sites had the same time of vegetation restoration and geographic characteristics, including elevation, slope, and parent material, except for the different vegetation types. The vegetation types and years of restoration at the sample sites were determined by research and visits.
Soil sampling is to select a typical sample point according to the 0~5, 5~10, 10~20, 20~30, and 30~40 cm soil layers. Using the “S” shaped distribution points, each sample point repeated sampling 3 times. Roots, pebbles, and plant and animal remains visible to the naked eye were removed from the soil samples to ensure that the mass of each soil sample was ≥1 kg. After collection, soil samples were naturally air-dried to remove roots, stems, and pebbles. They were then ground and sieved through 2 mm mesh for indoor chemical analysis.
Table 1.
Basic information on the sample plots in the southwest karst area
Soil organic carbon (SOC) was determined using external heating, total nitrogen (TN) using semi-micro Kjeldahl, total phosphorus (TP) using NaOH melting, alkaline nitrogen (AN) was determined by the alkaline diffusion method, and quick-acting phosphorus (AP) by the 0.5 mol L-1 NaHCO3 method [30], pH using potentiom-etry (water:soil = 2.5:1), and soil moisture content (SMC) using the desiccation method, Soil bulk density (BD) was determined by the ring knife method [31]. Soil texture was estimated using the hydrometer method [31].
Statistical Analysis
Soil SOCstock(Cs), TNstock(Ns), and TPstock(Ps) (t hm-1) were calculated [32, 33] as follows:
where Ci, Ni, and Pi are the SOC, TN, and TP contents in soil depth i (g kg-1), BDi is the BD of soil depth i, and Di is the soil depth of soil depth i.
Excel 2019, SPSS 22.0, and OriginPro 2021 software were used for data processing and plotting. One-way analysis of variance (ANOVA) with the LSD method was used to test the significance (α = 0.05) of SOC, TN, and TP stock characteristics and soil stoichiometric ratios in the 0~40 cm range of the soil layer under different vegetation. The effects of vegetation type and soil depth on soil physico-chemical properties and on SOC, TN, and TP stocks and stoichiometric ratios were investigated using a two-way ANOVA.
Results and Discussion
Results
Different Vegetation Soil Profile Stoichiometry
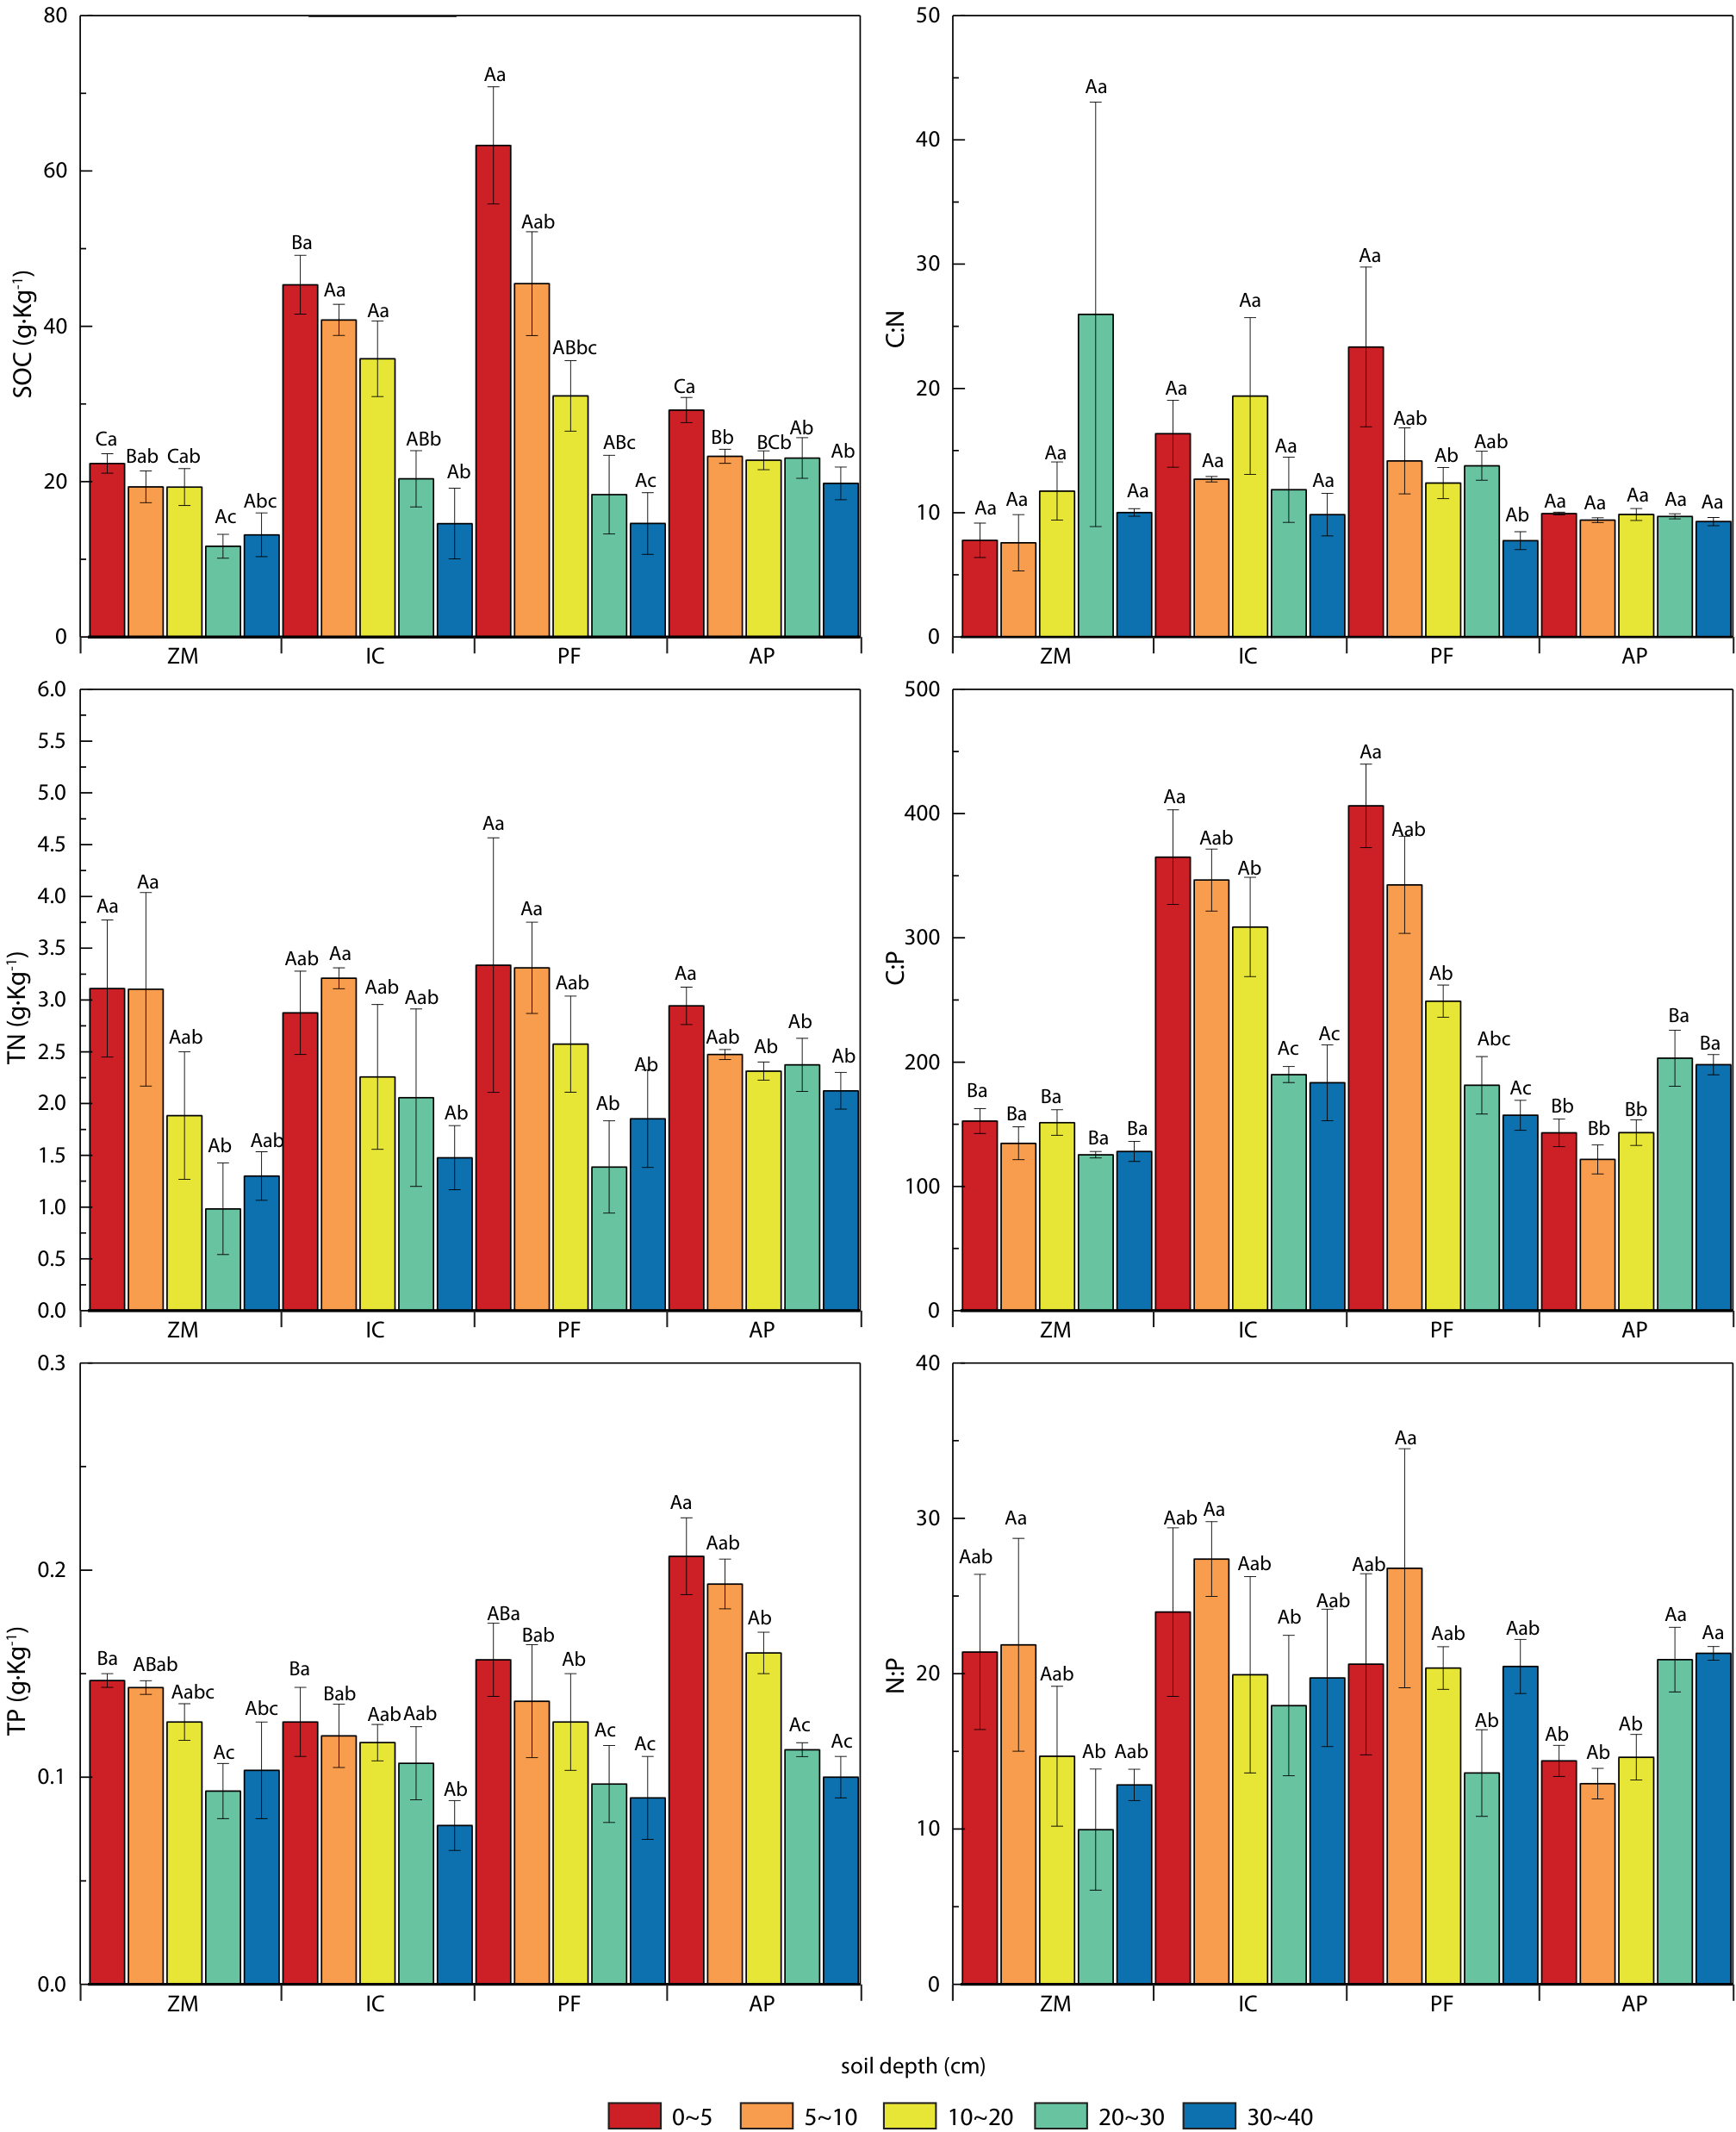
The study found that the carbon, nitrogen, and phosphorus content of ZM, IC, PF, and AP soils all decreased with the increase in soil depth. According to Fig. 1, the content of carbon, nitrogen, and phosphorus in 0–10 cm in each vegetation is significantly higher than that at the bottom (10~20 cm, 20~30 cm, 30~40 cm), showing the surface aggregation phenomenon. PF soil SOC content peaked at 0~5 cm, and IC and PF soil SOC content were significantly greater than AP at 0~20 cm (P < 0.05). IC, PF, and AP soil TN content varied not significantly between different soil layers. The TP content of AP soil was significantly greater than IC and PF (P < 0.05). IC and PF soil C:P values decrease with the deepening of the soil layer and are significantly greater than the C:P values of ZM and AP. From 0~40 cm, C:N, N, P, C:N:ZM soil were not significantly different (P > 0.05). In the soil profile, the orders of SOC and TP content in different vegetation were PF > IC > AP > ZM, AP > ZM = PF > IC, and the difference in TN content was not significant (P > 0.05) (Table 2). The mean SOC content of IC, PF, and AP compared to ZM increased by 80.93%, 37.59%, and 101.34% at 0~40 cm soil depth, respectively.
Table 2.
C, N, P content, ratio and stocks of 0~40cm soil layer in different vegetation(V).
Fig. 1.
Soil stoichiometry changes in different vegetation species Note: Different capital letters indicate significant differences among different vegetation types at the same depth (P < 0.05). Different lowercase letters indicate significant differences among different soil depths under the same vegetation (P < 0.05). The same is true below. Abbreviations: soil organic carbon (SOC), total nitrogen (TN), total phosphorus (TP), SOC:TN ratio (C:N), SOC:TP ratio (C:P), and TN:TP ratio (N:P).
Stoichiometric Stocks of Different Vegetation Soil Profiles
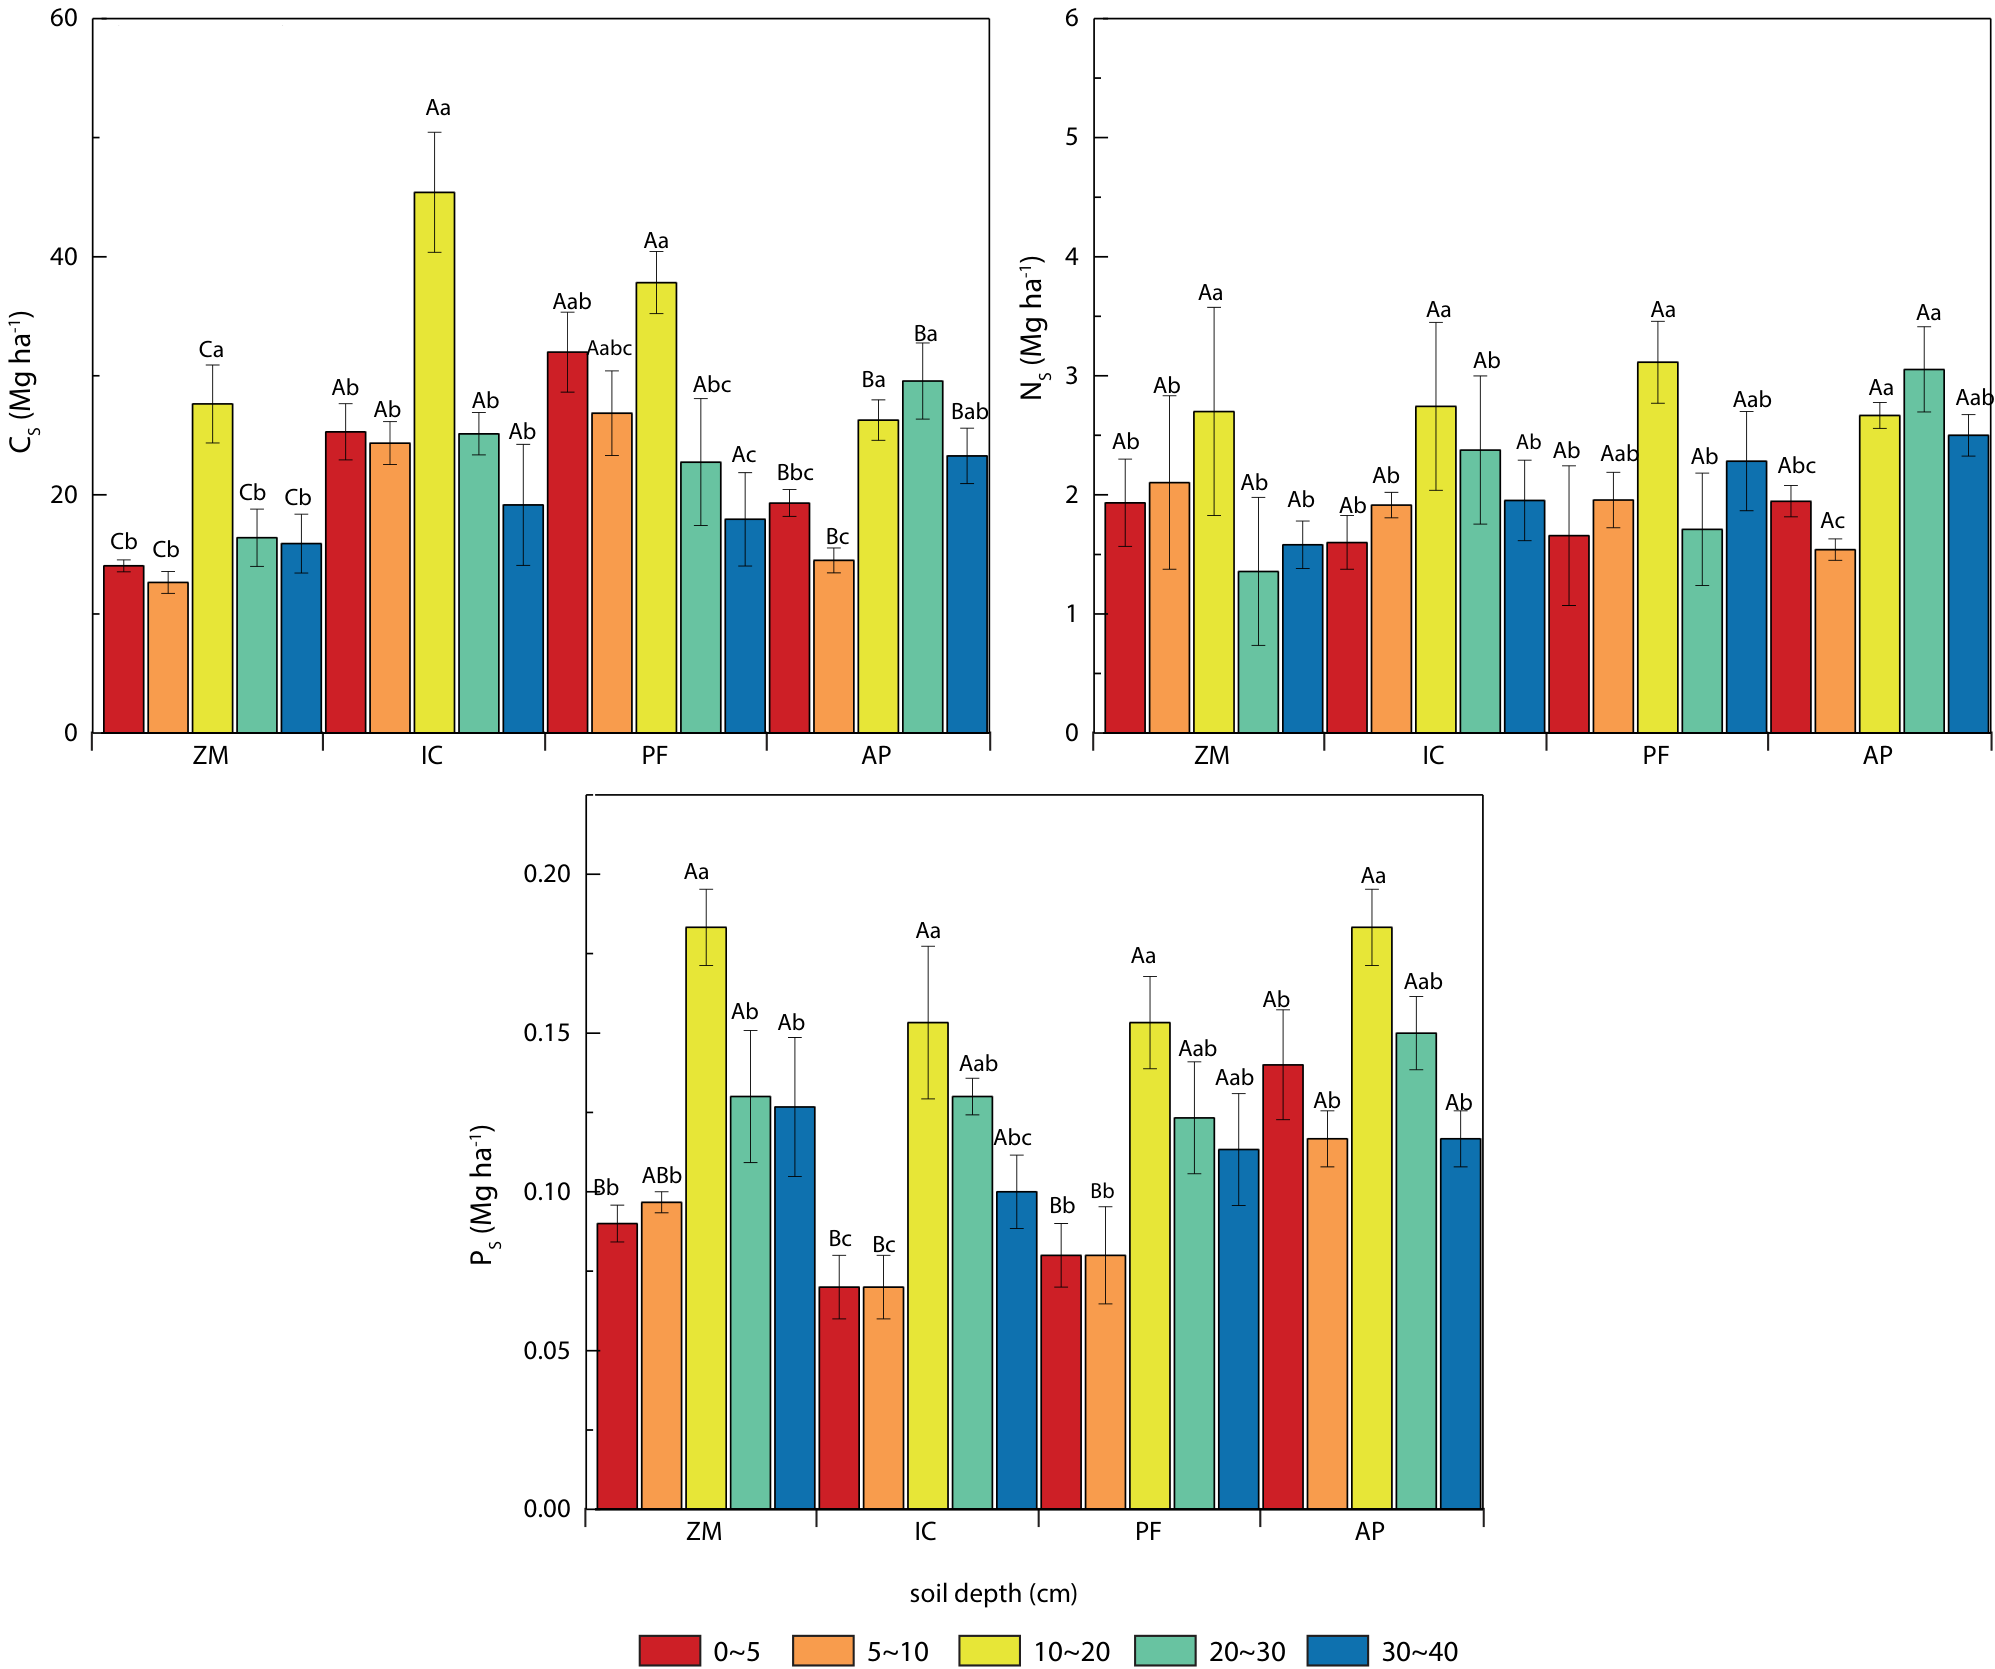
The SOCStock, TNStock, and TPStock ranges of the soil profile depths in the study area were 12.65–45.40, 1.36– 3.11, and 0.08–0.18 Mg ha-1, respectively, and from 0–40 cm soil depth, their reserves were 131.88, 11.70, and 0.64 Mg ha-1. IC, PF, and AP soil SOCStock and TNStock were higher than those of ZM compared to the control. The C, N, and P reserves of IC, PF, and AP all peaked at 10~20 cm in the soil depth, and in terms of carbon accumulation capacity, the trend of soil SOCStock was IC, PF > AP, with no significant difference in SOCStock between IC and PF, making them important soil “carbon sinks “in the region”. From the effect of N fixation, the trend of TNStock of IC, PF, and AP was not significant. From the effect of P fixation, the trend of TPStock change was AP > PF > IC, and AP was a soil “phosphorus sink” in the region (Table 2, Fig. 2).
Soil Carbon, Nitrogen, and Phosphorus Relationships Among Different Vegetation
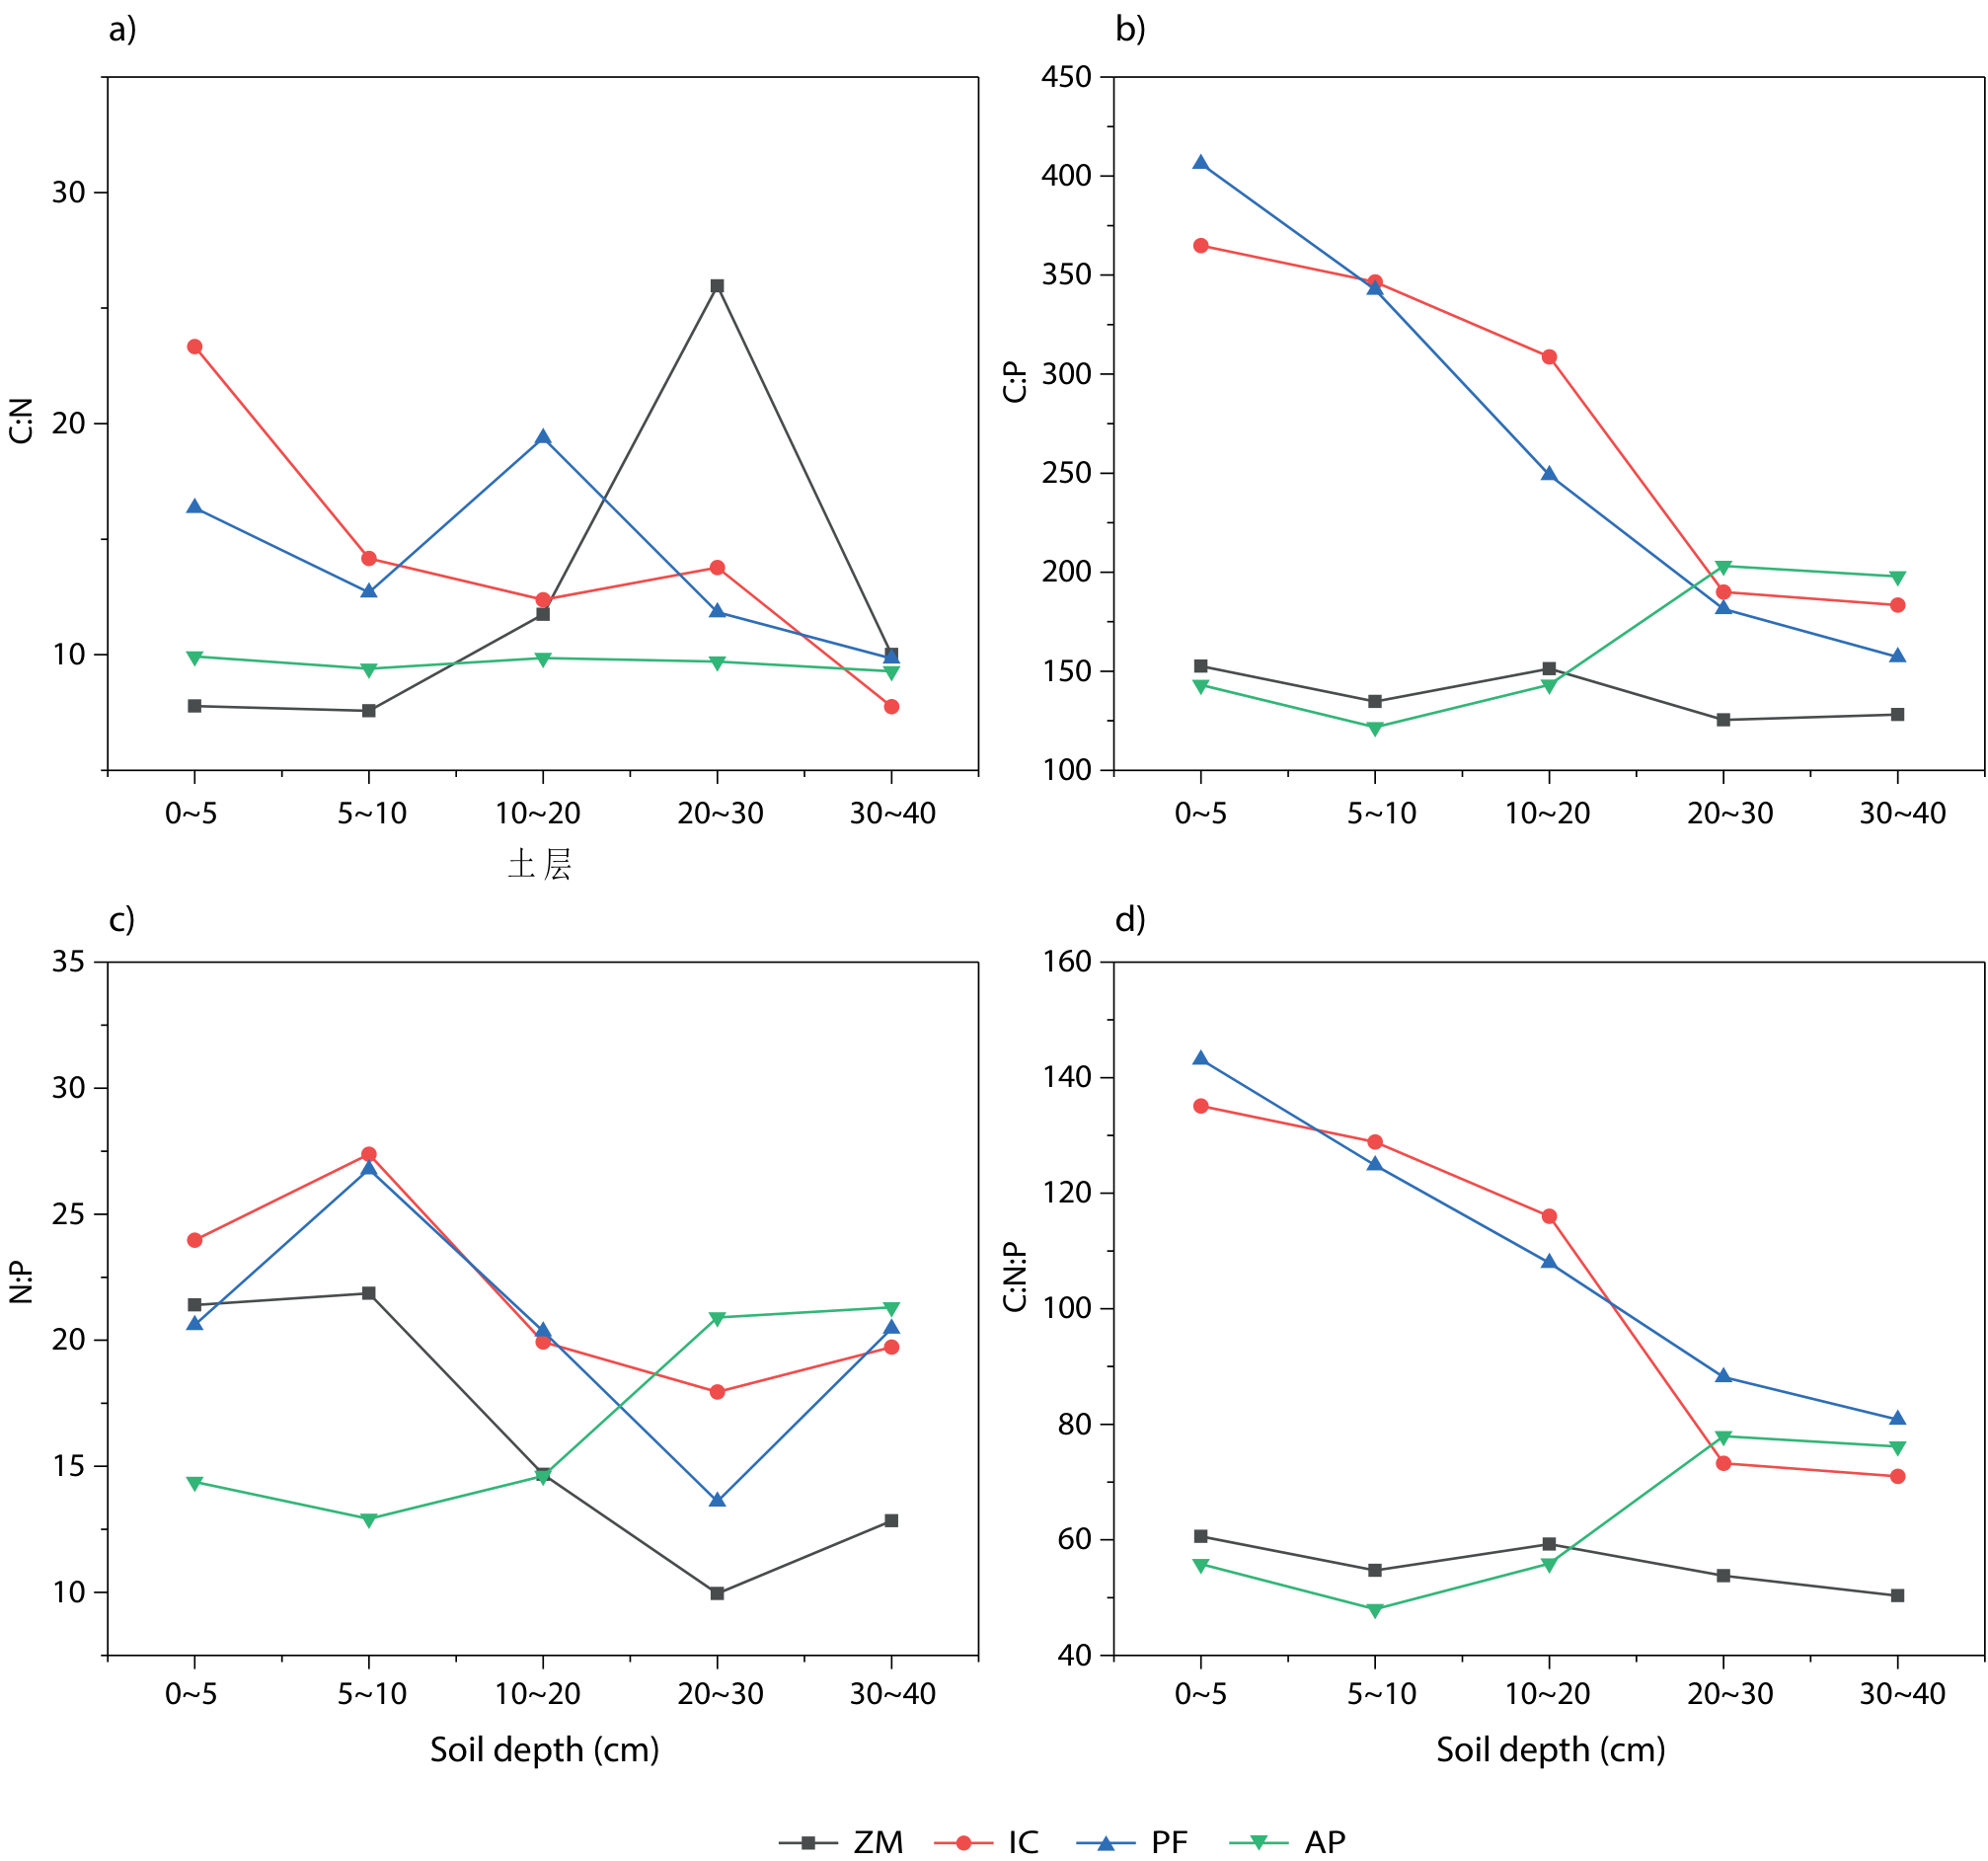
As shown in Table 3–3, by two-way ANOVA, vegetation type had a highly significant (P < 0.001) influence on soil SOC, TP, C:P, and SOCStock, and soil depth had a significant influence on SOC, TN, TP, C:P, SOCStock, TNStock, and TPStock indicators. Soil SOC, C:P, and SOCStock were significantly (P < 0.01) influenced by the combination of vegetation type and soil depth. C:N and N:P are not affected by the interaction of vegetation, soil layer, or SD (P > 0.05). From 0 to 10 cm, the C:N ratio size is sorted as IC > PF > AP > ZM (Fig. 3a). The C of PF and IC:P values decreased with the deepening of the soil layer (Figures 3–3b). From 0~10 cm, the N:P value of IC, ZM, and PF is greater than the bottom layer (Fig. 3c). C:N for IC, ZM, and PF:P values decreased with the deepening of the soil layer, but the opposite was true for AP (Fig. 3d).
Fig. 2.
Stoichiometric stocks of different vegetation soil profiles Note: Different capital letters indicate significant differences among different vegetation types at the same depth (P < 0.05). Different lowercase letters indicate significant differences among different soil depths under the same vegetation (P < 0.05). The same is true below. Abbreviations: SOCstock (Cs), TNstock (Ns), TPstock (PS).
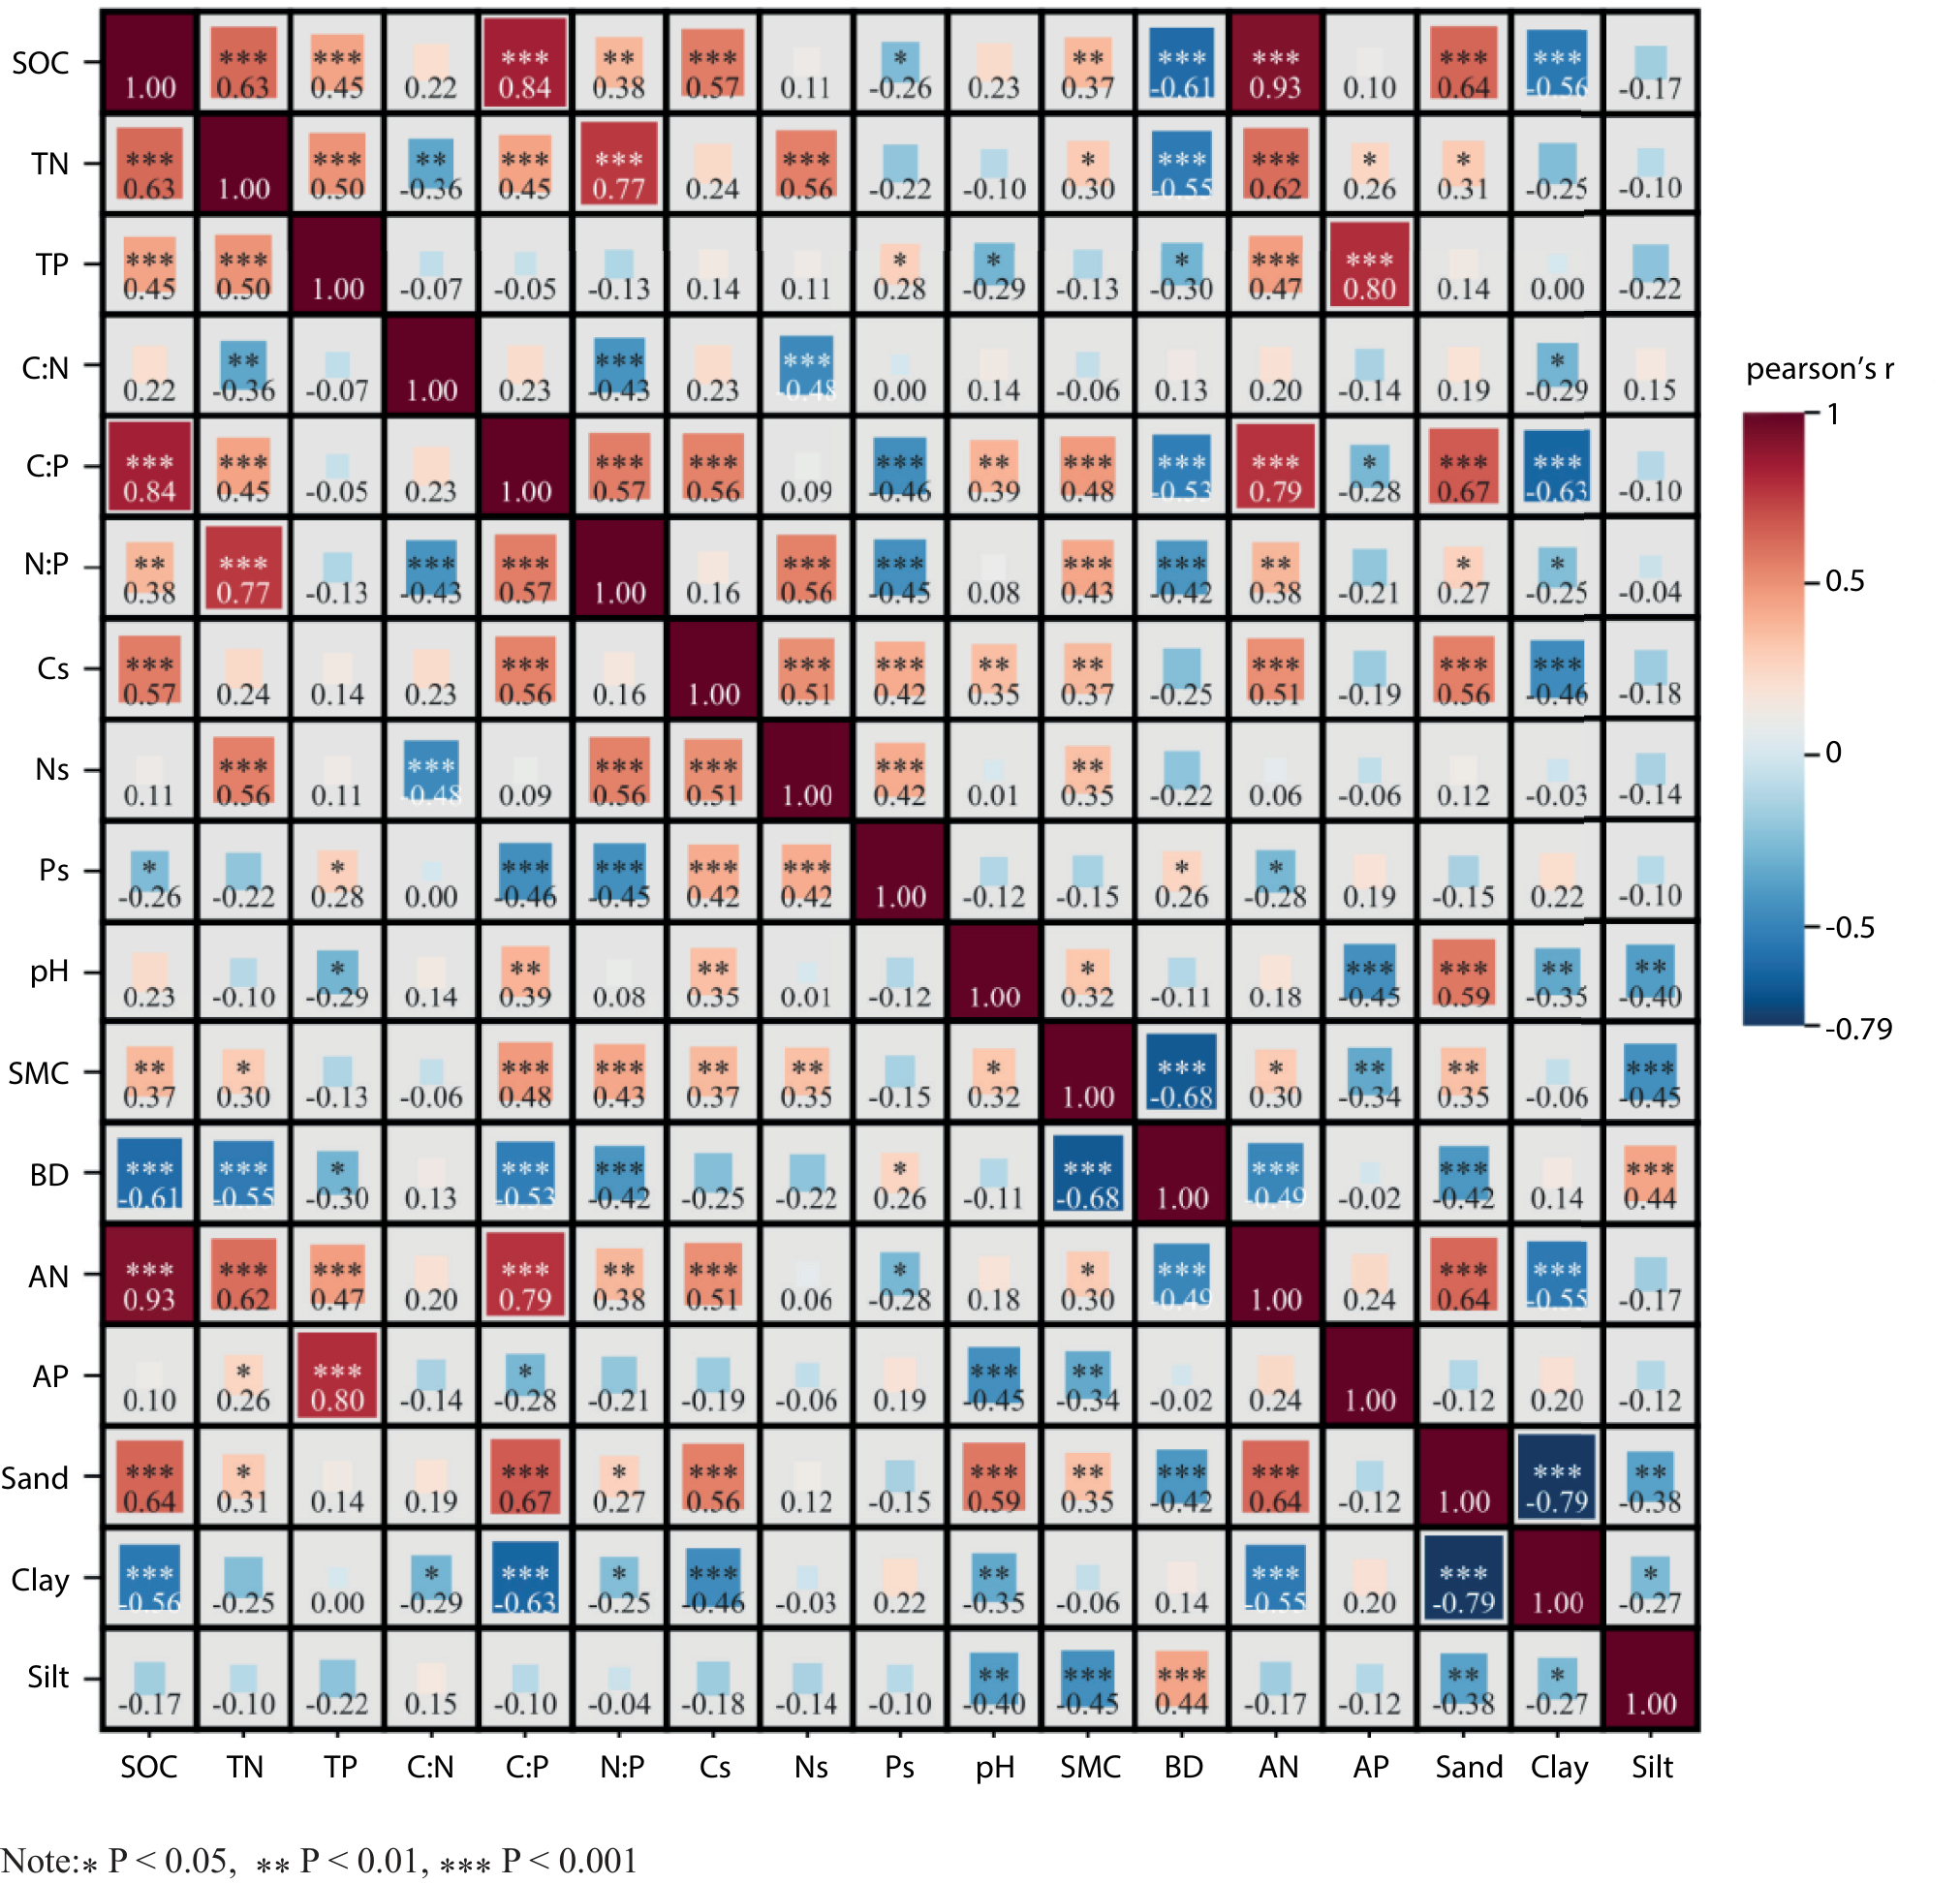
As can be seen in Fig. 4, SOC showed a highly significant positive correlation (P < 0.01) with TN (R2 = 0.63), TP (R2 = 0.45), N:P (R2 = 0.38), C:P (R2 = 0.84), Cs (R2 = 0.57), SMC (R2 = 0.37), Sand (R2 = 0.64), and AN (R2 = 0.93), and highly significant negative correlation (P<0.01) with BD (R2 = 0.61), Clay (R2 = 0.56) were highly significant negatively correlated (P < 0.001); and significantly negatively correlated with Ps (R2 = 0.26); TN showed highly significant positive correlation (P < 0.001) with SOC (R2 = 0.63), TP (R2 = 0.50), N:P (R2 = 0.77), C:P (R2 = 0.45), Ns (R2 = 0.56), AN (R2 = 0.62); significant positive correlation (P <0.001) with SMC (R2 = 0.30), Sand (R2 = 0.31), AP (R2 = 0.26) were significantly positively correlated (P < 0.05); TP showed highly significant positive correlation (P < 0.001) with SOC (R2 = 0.45), TN (R2 = 0.50), AP (R2 = 0.80), AN (R2 = 0.47); and significant positive correlation (P < 0.05) with Ps (R2 = 0.28).
C:N showed highly significant negative correlation (P < 0.01) with TN (R2 = 0.36), N:P (R2 = 0.43), Ns (R2 = 0.48) and significant negative correlation (P < 0.05) with Clay (R2 = 0.29); C:P showed highly significant positive correlation (P < 0.001) with SOC (R2 = 0.84), TN (R2 = 0.45), N:P (R2 = 0.57), Cs (R2 = 0.56), pH (R2 = 0.39), SMC (R2 = 0.48), AN (R2 = 0.79), Sand (R2 = 0.67), and highly significant positive correlation (P < 0.001) with BD (R2 = 0.53), Ps (R2 = 0.46), and Clay (R2 = 0.63) were highly significant negatively correlated (P < 0.001); and with AP (R2 = 0.28) were significantly negatively correlated (P < 0.05); N:P was significantly positively correlated (P < 0.01) with SOC (R2 = 0.38), TN (R2 = 0.77), C:P (R2 = 0.57), Ns (R2 = 0.56), SMC (R2 = 0.43), AN (R2 = 0.38); significantly positively correlated (P < 0.05) with Sand (R2 = 0.27); significantly positively correlated (P < 0.05) with BD (R2 = 0.42), Ps (R2 = 0.45), C:N (R2 = 0.43) were highly significant negative correlation (P < 0.001); and with Clay (R2 = 0.25) were significant negative correlation (P < 0.05).
Discussion
Characteristics of C, N, and P Content and Stocks of Different Vegetation Soil Profiles
The average contents of SOC, TN, and TP in the 0–40 cm soil layer in the study area were 26.68±4.14, 2.35±1.05, and 0.13±0.04 g kg-1, respectively, which were comparable to the mean values of SOC, TN, and TP in terrestrial soils of China (29.51, 2.30, and 0.53 g kg-1), and to the soils of the Karst region of southwestern China (6.44–45.17 g kg-1, 0.56–2.57 g kg-1, and 0.30–1.83 g kg-1). TN, TP range values (6.44–45.17 g kg-1, 0.56–2.57 g kg-1, and 0.30–1.83 g kg-1) were compared with the mean values of SOC, TN, and TP in Chinese terrestrial soils [34, 35]. Chinese terrestrial soil mean, SOC content was lower than the Chinese terrestrial soil mean in the Southwest China Karst area range value, and TP content was lower than the Chinese terrestrial soil mean and the Southwest China Karst area range value in the Southwest China Karst area range value.
Table 3.
ANOVA results of soil C-N-P stoichiometries influenced by restored vegetative (S), soil depth (D) and their interaction.
Fig. 3.
Change of soil stoichiometric ratio under different vegetation Abbreviations:SOC:TN ratio (C:N), SOC:TP ratio (C:P) and TN:TP ratio (N:P).
In this study, the contents of SOC, TN, and TP decreased with the deepening of the soil profile, and the positive correlation between SOC, TN, TP, and AN was highly significant (P < 0.001), and the positive correlation between TN, TP, and AP was significant (P < 0.05), which indicated that the total amount and effectiveness of carbon, nitrogen, and phosphorus in the top 0–5 cm layer had the phenomenon of “surface aggregation”, which retarded the cycling of these elements to a certain extent. This indicates that the total amount and effectiveness of carbon, nitrogen, and phosphorus in the top 0–5 cm layer had the phenomenon of “surface aggregation”, which retarded the cycling of these elements to a certain extent. This may be due to the fact that plant and animal residues mainly accumulate in the soil surface layer, and thus higher biological activ-ity in the surface soil may be a key factor contributing to this phenomenon [7]. In addition, the presence of surface apoplastic litter can significantly improve soil structure and nutrient cycling [36].
In the study area, soil SOC content and storage between 0–20 cm soil layers were significantly higher in natural recovery (PF, IC) than in anthropogenic intervention (ZM, AP), on the one hand, because the vegetation was richer under natural recovery and the nutrients would be concen-trated in the soil surface layer before being transported to the lower layer [37]. On the other hand, the upper layer of the soil had more microorganisms in the soil relative to the bottom layer, better aeration of soil structure, and faster nutrient cycling, which are conducive to the accumulation of organic carbon, suggesting that biological action has a more significant role in the regulation of SOC and TN [19]. In soils where ZM and AP are highly influenced by humans, the decrease in organic carbon may be due to the increase in soil permeability caused by agricultural operations, which promotes soil SOC mineralization and re-lease, leading to a decrease in soil carbon stock. The TN content in the study area showed PF > AP > IC > ZM, but there was no significant difference, indicating that vegetation restoration in the area had little effect on elemental N cycling. The TP content showed that AP was higher than PF, IC, and ZM, and there was no significant difference in the soil P content of each vegetation type among the soil layers except for the 0–5 and 5–10 cm soil layers, indicating that the P cycle was greatly affected by anthropogenic influ-ences; however, in natural restoration, the soil P content of PF was higher than the soil P content of IC soil P content was higher, which may be related to the low bioavailability of soil P [38], suggesting that perennial shrub vegetation is more conducive to the biosmall cycle of P than annual herbaceous vegetation.
Ratios of Soil Profiles C, N, and P in Different Vegetation
The total stoichiometric mass ratio of soil carbon, nitrogen, and phosphorus can not only be used as a judgment indicator of soil nutrient supply, but also reflect soil quality and composition. Soil carbon and nitrogen are key elements required for vegetation growth, most of which exist in the form of organic matter, and their ratios are relatively stable due to strong coupling [39, 40]. Although organisms may not be able to directly regulate soil TP, TP can indirectly link SOC and TN by directly affecting the reactive phosphorus available for plant productivity and leading to strong coupling between SOC, TP, and TN [41]. However, due to the different turnover rates of SOC, TN, and TP along the soil profile, C:N, C:P, and N:P ratios may also increase with vertical depth, decreasing significantly, suggesting that changes in SOC, TN, and TP did not vary proportionally across different soil horizons [19].
The average value of soil C:N in China is in the range of 10.00–12.00 [34], and the average value of soil C:N in the study area is 12.64, which is higher than the national average. The higher C:N indicates that the decomposition and mineralization rate of soil organic matter in the study area is slower, which is conducive to the accumulation of soil nutrients. Soil C:P is a sign of phosphorus mineralization capacity [42]. The mean value of soil C:P in this study area was 211.56, which was significantly higher than the average level in China (61) [34], and the C:P ratio differed significantly among vegetation types and depths, and the C:P ratio was greater than 200 and significantly higher than that of anthropogenic interventions (ZM, AP) in the profile (0–40 cm) and among soil layers (Fig. 1, Table 2–3), indicating that the phosphorus effectiveness in naturally restored (PF, IC) soils was lower, the mineralization rate was slower, and plant growth was restricted by phosphorus, which may be related to the fact that total phosphorus in Karst areas is not easy to convert into effective phosphorus [42]. N:P can reflect the decomposabil-ity of organic matter and determine the status of nutrient limitation in soils, and it is generally considered that N:P of less than 10 or greater than 20 is used as an indicator of the evaluation of vegetative productivity restricted by N or P limitation. Soil N:P (18.78) in the study area ranged from 10 to 20, indicating that the soil was limited by both nitrogen and phosphorus, natural restoration (PF, IC) soil N/P ratio > 20, the soil was limited by phosphorus and anthropogenic intervention (ZM, AP) soil N:P ratio ranged from 10 to 20, the soil was limited by both nitrogen and phosphorus.
The medium and primary productivity of most terrestrial ecosystems is constrained by TN or TP [43], and the stable functioning of these ecosystems relies on the availability of TN, TP to sustain soil SOC accumulation [7, 43, 44]. In agricultural systems, nitrogen and phosphorus deficiencies are usually addressed through the application of fertilizers as a way to maximize productivity. However, harvested agricultural products take away large amounts of nutrients, which need to be replenished through fertilizer application to prevent nutrient deficiencies over time. Unlike agriculture, large nutrient losses are not usually experienced under naturally restored vegetation because the amount of removal is small. As a result, soils under naturally restored vegetation are sufficient to maintain the nutrient levels they inherited from previous land uses. Nevertheless, the reduction of Ps in the naturally restored (PF, IC) substrate suggests that phosphorus may be a limiting factor for vegetation growth under naturally restored (PF, IC) conditions.
Factors Regulating the Ecological Stoichiometry of Different Vegetation Soils
Soil C content can be determined by the coefficients of humus and organic matter entering the soil, where-as N comes from biological nitrogen fixation or enters the soil through precipitation, and the main sources of P are leaching and rock weathering [45, 46]. Similar to the results of many previous studies, SOC and TN had an extremely significant correlation because soil C and N are important components of soil organic matter, and SOC is the main source of N that affects the level of TN [47]. The significant correlation between SOC and TP was different from the results of Qiao et al. [48], which proved that SOC did not affect the spatial distribution. Notably, TN was also significantly correlated with TP (P < 0.01) and AP (P < 0.05). The C:P and N:P ratios were highly significantly positively correlated with a correlation coefficient of 0.57; similar to the relationship between SOC and TN, the C:P and C:N ratios were non-significantly correlated with a correlation coefficient of 0.23, as well as the C:N and N:P ratios were highly significantly negatively correlated with a correlation coefficient of 0.43. The correlation between C, N, and P stoichiometry values actually corresponds to the correlation between their nutrient contents.
Soil C, N, and P content, storage, and stoichiometry usually vary with vegetation type, soil depth, and soil properties [49]. Soil texture also affects the variation of C, N, and P content and their storage [49, 50]. In this study, soil SMC, Sand, and AN showed highly significant positive correlation (P < 0.01) with SOC and TN, and BD and Clay showed highly significant negative correlation (P < 0.001) with SOC, which was in agreement with the results of the previous study [46]. Soil capacity reflects the re-sistance, permeability, and aeration of the soil during root extension [51]. Soil water content can directly or indirectly affect soil nutrient content by altering ion transport, organic matter decomposition, and air heat transfer [52]. Soil C, N, and P stoichiometric ratios are affected by a combination of environmental factors such as soil-forming factors, soil water content, vegetation type, and human disturbance [53]. Therefore, the study of soil stoichiometric characteristics under different vegetation types under the same growing environmental conditions is of great significance in re-vealing the soil nutrient supply capacity under different vegetation types and the effects of different plant species on soil improvement.
Conclusions
The results of this study showed that vegetation type and soil depth had a significant effect on SOC and TP content and storage. SOC, TN, and TP content all decreased with increasing soil depth and had a significant surface aggregation effect. TN content and storage were less affected by vegetation type. Soil C:N values were relatively stable, while soil C:P and N:P values were correlated with changes in SOC and TN contents. Soil phosphorus effectiveness is lower, and vegetation restoration is more affected by phosphorus. Soil carbon and nitrogen contents are higher under the PF vegetation type than other vegetation types, so shrubs are more suitable for ecological restoration and environmental reconstruction in this area. Vegetation restoration in Karst areas of southwest China should first consider shrub vegetation types and pay attention to soil P levels; soil texture, soil water content, and soil bulk weight should also be considered in the process of vegetation restoration with regard to the impacts of soil C, N, and P.

