

Introduction
The importance of water scarcity as a factor limiting plant growth and terrestrial ecosystem productivity in future climate change scenarios may increase worldwide, especially in arid and semiarid regions. According to this, the study of intraspecific variability in growth and drought-related physiological responses is crucial for understanding the adaptation potential of forest trees to climate change. The carbon isotope composition (δ13C) in plant tissues provides an integrated measure of the ratio between chloroplastic and atmospheric CO2 concentrations (Cc/Ca) and therefore the determination of carbon isotope ratios can be used to estimate the ratio between the net CO2 assimilation rate (A) and stomatal conductance for water [1]. When plants are subjected to any environmental impact that causes a decrease in stomatal conductance or photosynthesis (drought, shade, etc.), atmospheric carbon dioxide concentrations will be reflected in a change in the 13C/12C isotope ratio in this organic matter (e.g., increased drought will lead to stomatal closure and a decreased ci/ca ratio). The 13C value is thus indicative of changes in photosynthesis and stomatal conductance in response to environmental changes. A value of 13C is accepted as an indicator of water scarcity [2]. Since plant tissue is known to contain fewer carbon 13 isotopes than ambient air, studies of 13C sequestration by plants have become a powerful tool in plant ecology and global carbon cycle studies [3]. The isotope content of leaf tissue can give us predictions about plant water relationships [4].
Plant responses can only be modelled successfully when species are divided into life groups [5]. The most common and simplest method of classifying plants is by life forms. Raunkiaer proposed the term biological spectrum for plant life forms [6]. According to Raunkiaer (1934), the biological spectrum is an indicator of climates and the environment in general. Phanerophytes constitute more than 60% of tropical flora. In Mediterranean countries there are 30% phanerophytes and 40% therophytes, in temperate regions there are 50% hemicryptophytes, 30% cryptophytes and 20% therophytes. At the poles, phanerophytes and therophytes disappear and haemicryptophytes become dominant (60%). In general, the classification of plants is based on characteristics that are easy to identify but ineffective against environmental changes [7]. Ehleringer & Cooper (1988) found in their study that water use efficiency varies with life span: short-lived shrubs have lower water use efficiency than long-lived shrubs [8]. Ehleringer (1994) suggested that in desert environments, perennials that persist through multiple droughts should have lower hydraulic conductivity than short-lived annuals [9]. They also noted that life form diversity is positively correlated with the climatic diversity of a site and indicate some forms. Leaf carbon isotope ratio (δ13C) and carbon isotope partitioning (∆) give information about how a plant regulates carbon dioxide and water fluxes in relation to its ratio to intracellular CO2 (ci/ca) [10]. In addition, ∆ is more stable over time than absolute fluxes, thus providing a better indication of whole-plant constraints rather than environmental constraints. For example, Cernusak (2020) examined how δ13C changes in plants along a rainfall gradient and found that the δ13C of a community reflects the long-term average of rainfall for that region [11]. Schubert et al. (2018) predicted that vegetation type would significantly influence carbon isotope discrimination on a global basis [12]. He et al. (2017) used carbon isotope ratios to examine elevational and longitudinal effects on plant physiological processes for a wide range of plants worldwide and found that δ13C values varied with elevation and latitude [13]. Natural resources and biodiversity are decreasing due to land use increase, human population pressure, and climate change. Over the last fifteen years, carbon isotopic analyses have been used as an effective tool to investigate the distributions of C3 and C4 photosynthetic pathways within different plant species [14]. Some researchers suggested that carbon isotope ratios in C3 plants indicate the average intercellular CO2 concentration [15, 16]. There are studies that support this view [4, 9, 17]. Yenice Forests, located in the northwestern part of Anatolia, is one of nine different biodiversity hotspots in Turkey. These forests need to be protected, especially to protect monumental trees, deep canyons, in-forest streams and the rich animal and plant diversity they contain, old forests, and endemic species. Within the scope of the study, it is aimed to determine the C13 and O18 isotope ratios of plant species belonging to different life forms in different forest types in Yenice Forests hot spot, to determine water use efficiency and carbon and water relationships in forest ecosystems.
Materials and Methods
Karabük-Yenice area is located in the Western Black Sea Subregion of the Black Sea Region as a geographical area, between 41°00’14”-41°05’06” northern latitude and 32°21’06”-32°27’45” eastern longitude. Plant samples were collected from 3 different forest areas selected in Yenice Forests between 2017- 2018 vegetation seasons. Plant species collected from the field were identified according to the book titled “Flora of Turkey” by Davis [18]. Life-forms of the plant samples were defined according to the classification made by Raunkiaer (1934) on main life-forms and subdivisions [6]. Climate related data from the area were acquired from the climate station (TFA 35.1075) situated in the forest, collecting average forest temperatures and average precipitation of the forestland between 2017- 2018. Based on the data obtained, the climatic characteristics of the forest were determined according to the Thornthwaite formula (Table 1, Fig. 1). According to Thornthwaite, in addition to the amount of precipitation and temperature that play a role in precipitation efficiency, it is important to graphically show the precipitation efficiency with factors such as the water accumulation capacity of the soil and the latitude of the geographical region. In addition, the determination of the water balance of a site by this method provides the determination of important climatic characteristics of the study area [19]. Thornthwaite Drought Index (Ia) is calculated using the formula Ia=100d/n (d: annual water deficiency cm; n: annual PE cm) to measure the degree of drought in humid areas [20]. Annual PE (cm) in Yenice forests was calculated as 649.63 cm and annual water deficit was calculated as 39.22 cm. Accordingly, Yenice Forests represent the Megathermal climate type as climate type, and the drought index of 6.03 represents the area type with little or no water deficiency. The annual precipitation regime covers the winter, spring, autumn and summer seasons: The Eastern Mediterranean Precipitation Regime (type 2) prevails within the forest. We used the Emberger formula to determine drought intensity. Although biogeographically the flora of the area is in the auxin province of the European Siberian phyloristic zone, large forest locations under the influence of the Mediterranean climate can be found along microclimatic areas within the forest.
Stable Isotope Analyses
Carbon and oxygen stable isotope ratios of leaf dry matter were measured at the Stable Isotope Laboratory of Siirt University, Technology Application Laboratory. For the 13C and 18O analyses, approximately 3 mg powder samples were combusted in an NC2500 elemental analyzer connected to a Delta Plus isotope ratio (δ13C and δ18O) mass spectrometer (FinniganMAT, Bremen, Germany) operating in continuous flow mode. Isotope ratio values are expressed as (‰).
Table 1.
Water balance of Yenice Forests according to Thornthwaite method.
Results and Discussion
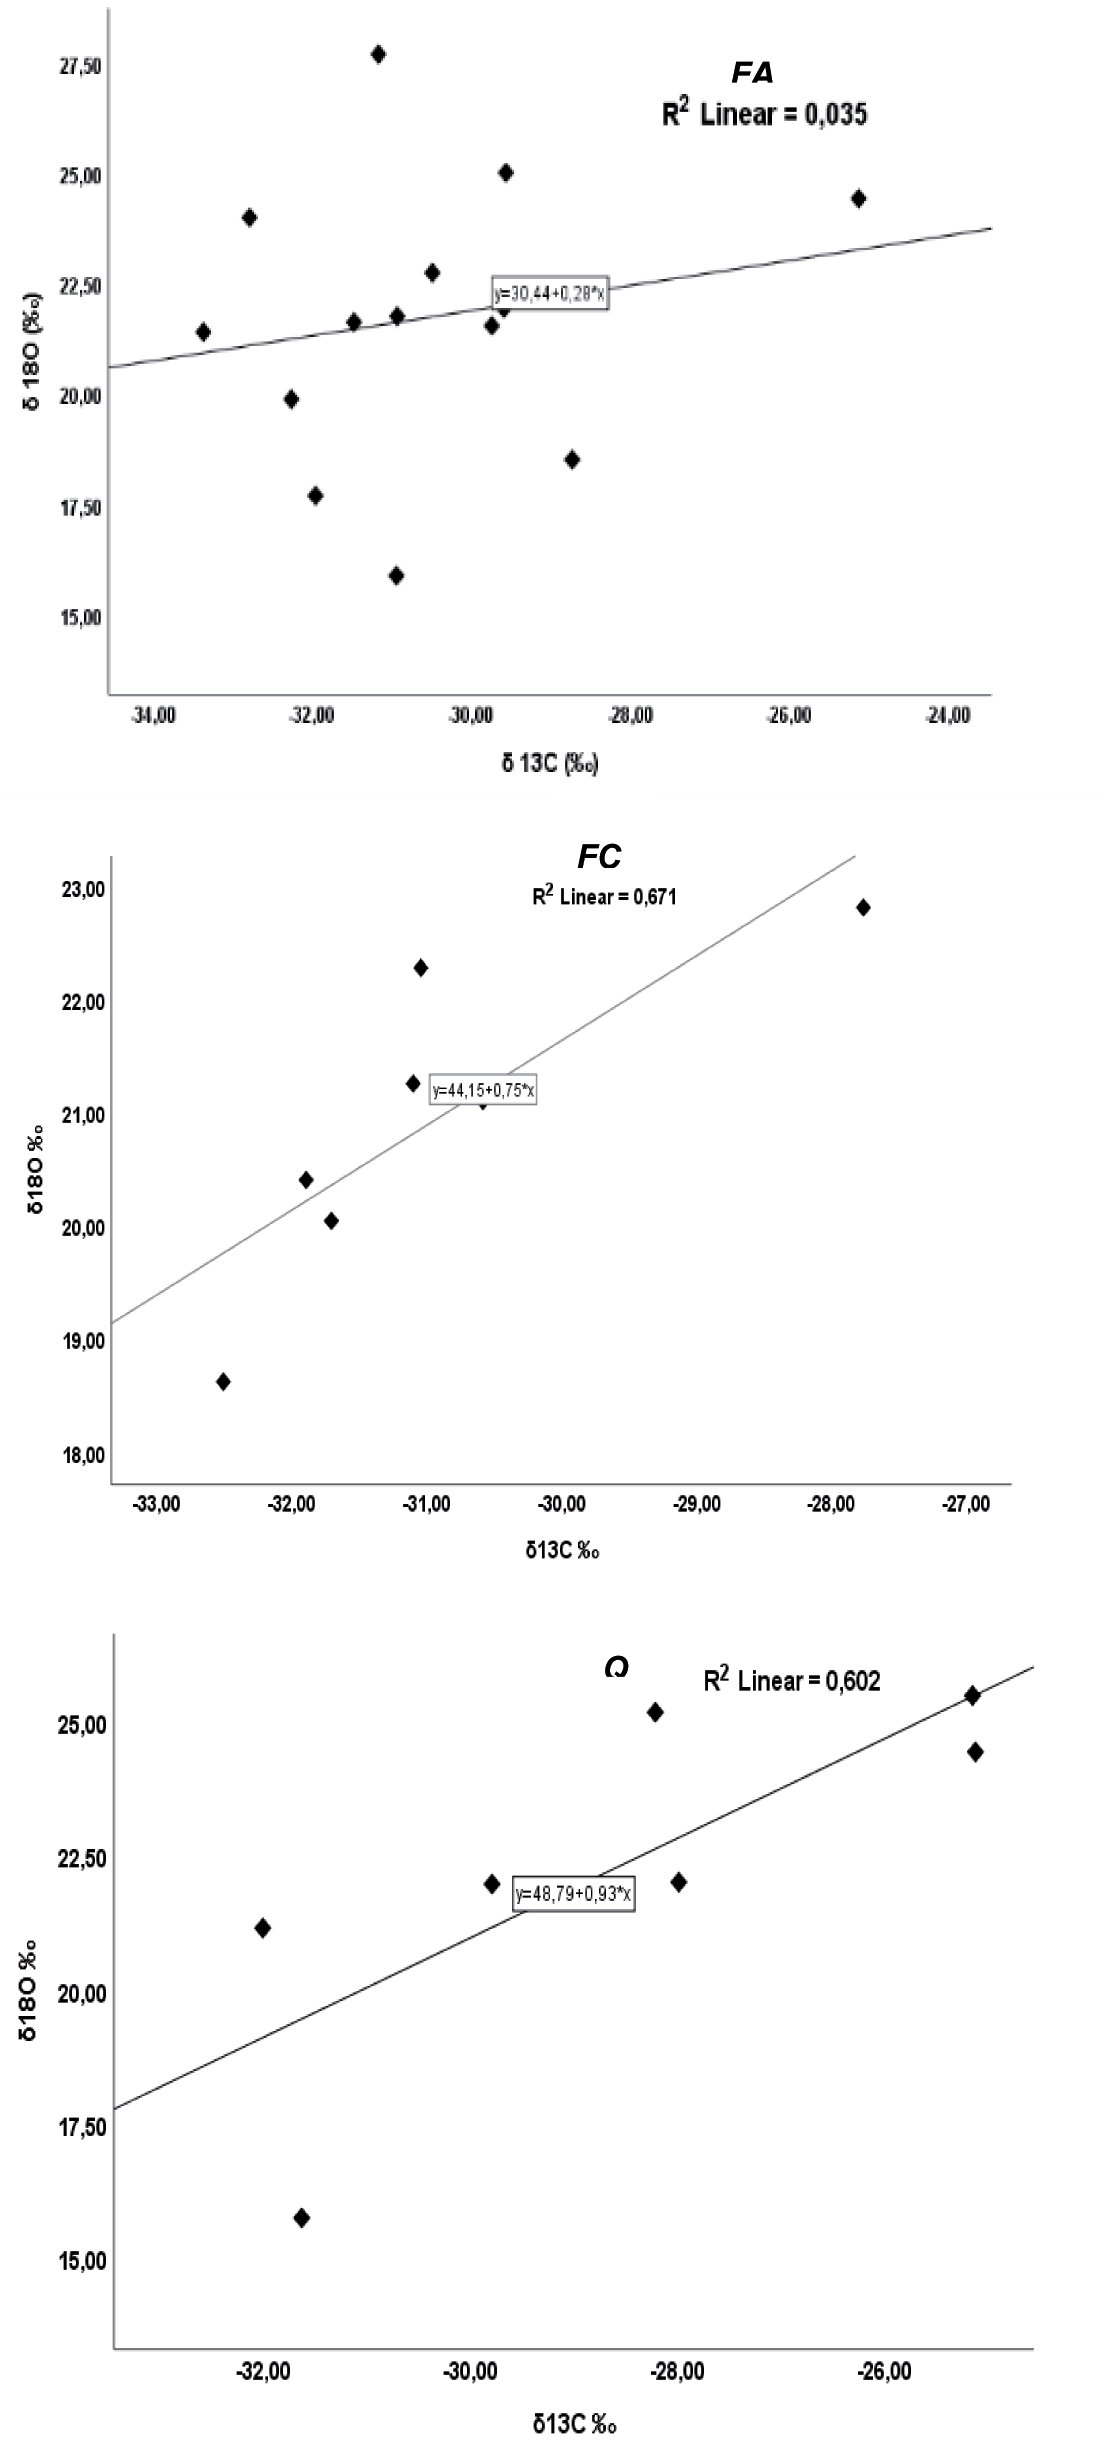
Changes in carbon and oxygen isotope ratios were analyzed based on life form differences in forest layers in Yenice Forests (Table 2). In terms of life forms, ANOVA test results show significant differences at p<0.05 level for both carbon isotope ratios and oxygen isotope ratios. According to Tukey test, the groups causing the difference were 1st (hemicryptophyte) and 4th (geophyte) groups for carbon ratio and 1st (hemicryptophyte) and 5th (terophyte) groups for oxygen isotope ratio. In terms of these life forms in different forest habitats, the group with the highest carbon 13 isotope ratio was the geophyte life form with -27,38±2,27. The lowest carbon isotope ratio was the hemicryptophyte life form with -31,29± 0,98. The groups that showed a difference in terms of oxygen isotope 18O ratios were hemicryptophytes with the lowest amount (19,58±2,32) and therophyte life form with the highest amount (24,06±3,92) (Fig. 2, 3). When the areas were examined in terms of forest layers, significant positive correlations were found between the oxygen and carbon isotope ratios of the species in beech-hornbeam forest areas (0.819*) and pure oak forests (0.776*) at p<0.05 level. No correlation was detected in beech-fir mixed areas (Fig 4).
Stable carbon isotope ratios of terrestrial plants have the potential to provide unique insights into physiological processes and interactions between plants and the environment [21]. The study of stable isotopes of carbon, nitrogen, and oxygen composition provides a better understanding of the biogeochemical cycle of plant ecosystems [22]. To date, various techniques have been used to investigate the mechanisms and strategies adopted by plants. Numerous studies have used plant WUE (the ratio of carbon assimilated by the plant to water excreted by the plant) inferred from δ13C signatures (i.e. the 13C to 12C ratio) of plant leaves and other materials to analyze plant performance under varying water stress conditions [21, 23, 24]. The advantage of measuring carbon 13 isotope ratios in plant tissues is that it provides information on ci/ca values over time rather than instantaneous ci/ca estimation. Hussain et al. (2019) stated that the simultaneous analysis of carbon and oxygen isotope ratios of leaf material in tropical rainforests is important for long-term information on assimilation and evapotranspiration regimes for plants [22]. Transpiration is a critical physiological mechanism involved in water conservation strategies and allows plants to grow and survive [25].
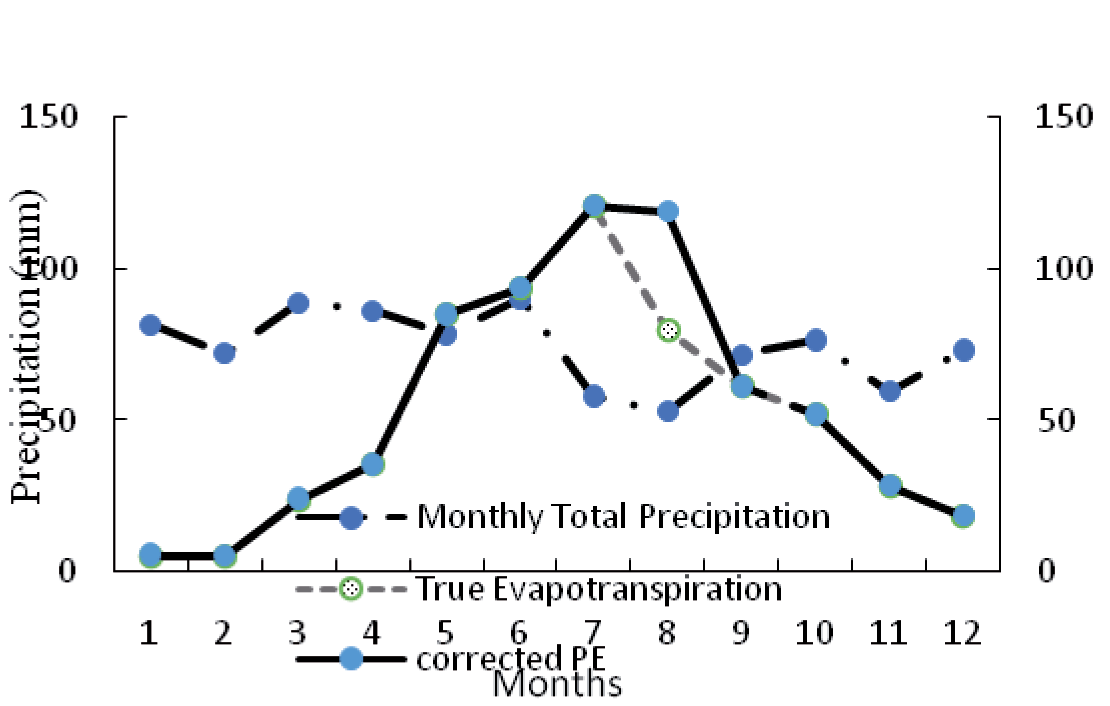
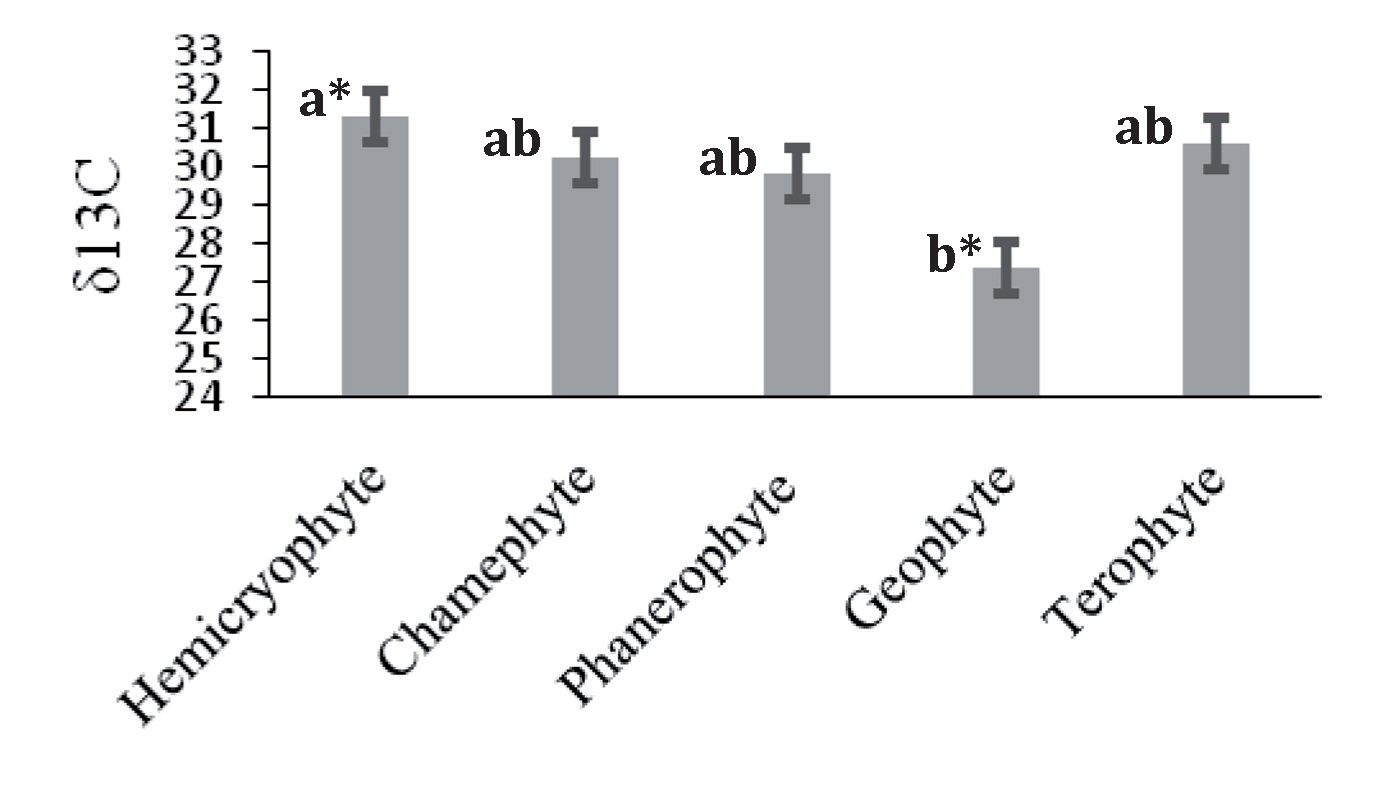
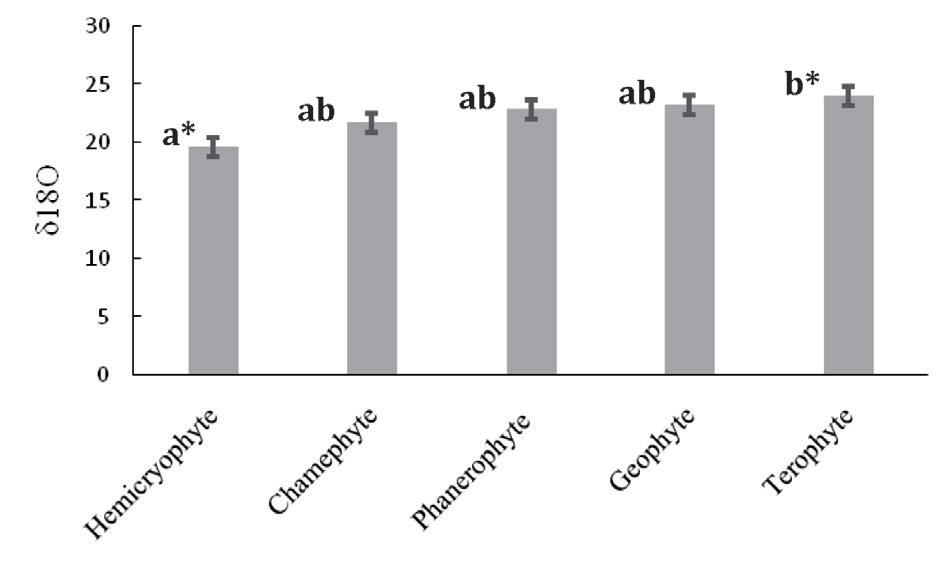
Table 2.
Carbon isotope ratio, Oxygen isotope ratio, life form of plants from the Yenice Forests.
It has been reported that the forest understory is more humid and has higher levels of respirable carbon dioxide than the forest top [22]. Within the scope of this study carried out in different forest habitats, the change in isotope values for plant species belonging to different life forms in different forests was investigated. In this study, highly positive correlations (p<0,05) were found between C13 and O18 isotope ratios in beech-hornbeam and pure oak forest habitats. There was no correlation between C13 and O18 isotope ratios in beech-fir forests. Plants growing under high humidity have about 2.7% more negative C13 values than those growing under low humidity due to higher stomatal conductance [22]. This condition has led to correlations between relative humidity and the uptake of isotopically spent carbon dioxide in different forest habitats [13]. Similar results were also observed in our study. Different forest habitats allow variation in soil moisture content due to different biochemical and morphological characteristics of different species of trees. Beech-hornbeam, oak, and beech-fir have the highest variation in moisture content, respectively. Forests with a positive correlation were found in habitat areas with high moisture content. The impact of global changes on forest ecosystem processes depends on the species-specific responses of trees to the combined effect of multiple stressors and the capacity of each species to adapt and cope with environmental change [26]. Furthermore, seasonal cycles linked to different leaf phenology, as well as the presence of periods of stress (e.g. summer drought) during the growing season, can also lead to vastly different rates of dependence on stored carbon [27-29]. The rapid development of deep roots seems to be an important strategy for evergreen tree species to obtain water during the dry season, while deciduous trees during drought minimize water loss from the remaining leaves, in addition to losing some of their leaves [30, 31].
Fig. 4.
Relationship between carbon (δ13C) and oxygen (δ18O) isotope ratios for different forest layers in Yenice Forests. FA: Fagus--Abies Forest; FC: Fagus-Carpinus Forest; Q: Quercus Forests
Determination of the carbon isotopic ratios of leafs have proved useful in ecological research because they can provide insight into long-term carbon-water flux rates integrated over the entire lifetime of a leaf or needle. All plant water relationships can be studied by analyzing carbon isotope abundances in leaf tissue [10]. Plants experiencing water stress typically close their stomata to minimize water loss through transpiration, thus reducing the inner CO2 ratio (ci/ca). Under conditions of reduced ci/ca, plants are largely indiscriminate towards 13C during photosynthesis, and thus plant tissue becomes relatively enriched in 13C. It is stated that a heavier δ value under stress indicates stomatal closure for almost all species [32].
The implication of this for water resource studies is that abundant and reliable water sources (e.g., soil water in the upper layers) are likely to become enriched in 13C as drought conditions progress. Reducing the internal CO2 ratio (ci/ca) is the reason why stomata are closed to reduce water lost through transpiration. Under reduced ci/ca conditions, the 13C used in photosynthesis increases [1]. There is an increase in C13 when distress conditions occur with water [32.]. Within the scope of the study, the highest 13C isotope ratios were found in geophyte species in different forests. This clearly shows the reason why the large genome size and increased stomatal size in the geophyte life form forms a measure against drought even in humid temperate forests. In other words, geophyte species show sensitivity (measure of protection) to drought in tolerance ranges narrower than other life forms. Raunkiaer (1934) selected buds according to their longevity [6]. This is the degree and measure of protection provided to meristematic tissues during the unfavorable season. Monitoring the variation of carbon isotope ratios according to life forms allows the identification of the most sensitive groups within the areas. Thus, it is possible to predict the plant groups that will be first affected by global climate change in the three major different temperate humid forests in Yenice Forest, which is defined as a hot spot. Therefore, the fact that geophytes keep the carbon 13 isotope ratio high makes them indicator groups. There was a significant difference between the 18O oxygen isotope ratio at the p<0.05 level in terms of therophytes. The therophyte life group sample E. farctus has determined values with low oxygen isotope ratio in species [33]. Similar results in our study also revealed low oxygen isotope values as an indicator of low water use efficiency, since the use of surface water is dependent on surface water. The frequency of therophytes existing in a given area manifests itself after the completion of the vegetative developmental stage in the short period before the onset of the dry period [34]. This is an indication that Δ13C variation in the same growth conditions may also be due to genotypic differences [32].
Plant stem growth is achieved by the rate of cell division and rapid growth of the geophytic stem by pumping water into the non-photosynthetic subterranean divided tissues. Geophytes overcome unfavorable growth conditions by persisting in the form of an underground organ capable of accumulating sufficient nutrients available for the rapid development of the aboveground body. The reserves stored during annual cycling periods in favorable conditions [35, 36] enable geophytes to develop successfully even at very low initial external energy supply. This feature provides them with a favorable strategy in steppe vegetation in the seasonally arid Mediterranean climate or in temperate, deciduous forests where the light phase is limited to cold seasons characterized by a low initial level of sunlight. The genomes of geophytes are very large, and their evolution is closely related to specific life forms. Since a large genome leads to a large stomatal structure, the regulation of carbon dioxide uptake by stomata is related to stomatal length, as large stomata are known to increase plant sensitivity to drought [37]. In higher plants, stomatal guard cell length is known to be very closely related to genome size [38]. Life forms are closely related to environmental factors, and this is interpreted as a strategy for acquiring resources [39]. Life forms reflect the adaptation to climate and distribution of plants and translate these forms into micro and macro climate indicators [40]. This means that they are the group that uses water most economically, even if there are no restrictions on the use of water in the environment, and this group actually proves efficient water use with the type of climate it represents. Soil C models are mainly driven by soil temperature and moisture. These factors are generally excellent predictors of soil respiration rate R over short temporal scales and under certain conditions [41]. However, over larger spatio-temporal scales, plant activity and other factors may become increasingly important. Therefore, taking advantage of plant-soil relationships in further studies may help to accurately represent seasonal variation in plant C allocation among different functional groups, by modelling regional or global scales over longer time scales [42]. Climate change forecasts in Europe are unanimous in predicting significant warming for every season. The most important impact of climate change is that it affects the water cycle by changing precipitation patterns and evapotranspiration processes at various scales.
In the coming years, this indicates that less soil water will be available for plant growth in forest interior areas during the summer months [43, 44].
Conclusions
Determining the life forms that can exhibit the most strategic behavior against the decreasing amount of water in climate change is important in terms of the measures that can be taken. Determination of isotope ratios preferred by life forms can be an indicator for sensitive areas such as Yenice Hotspot forests in climate change monitoring.

