

Introduction
The Yellow River Basin holds a crucial position in China’s economic and social development, as well as ecological security. The ecological protection and high-quality development of the basin have been designated as a national strategic priority. In 2021, the State Council released the Outline of the Plan for Ecological Protection and High-Quality Development of the Yellow River Basin, which proposes more stringent requirements for the basin’s development. The plan emphasizes the need for environmentally-friendly industrial development and promotes synergistic development between the environment and industry.
In recent years, the Yellow River Basin has made significant progress in various aspects. With the implementation of state policies, there has been a continuous improvement in the quality of the ecological environment. The basin has also achieved sustained economic growth and actively facilitated the transformation and upgrading of the industrial economy. Moreover, there is great potential for the development of specialty agriculture, leading to the emergence of new growth points in the service industry. These advancements have contributed to a substantial improvement in the industrial scale and industrial structure within the basin [1]. The Yellow River Basin is currently facing a complex set of challenges. These include a severe scarcity of water resources, conflicts between industrial layout and environmental protection, and ecosystem degradation, among other long-standing issues. Furthermore, the increasing intensity of environmental regulations and the trend towards personalized and diversified consumer demands in the new era have contributed to the gradual blurring of boundaries between the environmental system and industrial system in the basin [2]. As a result, there is an urgent need to guide the synergy between environmental and industry development within the region, as well as upstream and downstream.
Given the discrepancy between the goals and reality, it is crucial to address how to achieve synergistic development of environment and industry in the Yellow River Basin. The sustainable development of the basin depends on the coordinated promotion of industry and environment. The environment and industry in the Yellow River Basin form a complex adaptive system. By coordinating and integrating the environmental systems and industrial systems, they can operate in synergy to promote the organic integration of the system functions, thus leading to the sustainable development of the Yellow River Basin.
This study aims to investigate the synergistic development of the environment and industry in the Yellow River Basin. By analyzing the current state of environmental and industrial development in the region, we will explore how these two sectors can work together in a composite system to achieve synergistic growth. Additionally, we will evaluate the level of synergistic development between the environment and industry in the Yellow River Basin, providing valuable insights for provinces in the region seeking to balance industrial growth with environmental sustainability.
Literature Review
Study on the Relationship between Industry and the Environment
The existing literature on environment and industry studies primarily analyzes the relationship between the environment and industry.
The impact of industry on the environment can be observed in two ways. Firstly, the growth of the industrial economy leads to an increase in ecological pollution [3]. Meadows’ book “The Limits to Growth” published in 1971 is a notable example, as it argues that environmental pollution resulting from economic growth affects people’s quality of life, which in turn affects the economy and the continued development of industries. Secondly, the significant expansion of industrial scale and agglomeration results in a substantial release of pollutants, leading to environmental hazards [4]. Secondly, industrial development can also contribute to environmental improvement. As the economy develops, technological advancements and changes in industrial structure have significant environmental effects. Technological progress leads to the research and development of clean technologies and the phasing out of traditional industrial processes. This enables the efficient use of resources and reduces pollution emissions per unit of economic output [5]. Additionally, as the industrial structure shifts from energy-intensive heavy industries to knowledge- and technology-driven manufacturing and service industries, the environmental impact of economic activities is reduced [6].
The impact of environment on industrial development can also be observed in two ways. Firstly, the state of natural resources can constrain industrial development. For instance, Wang et al. [7] argues that one of the major issues with national industrial development is that resource consumption is too high, leading to a resource-intensive regional industrial economy that relies heavily on resource-based industries. This hinders the further development of industries. Secondly, appropriate environmental protection policies, such as environmental regulations, can improve industrial performance and international competitiveness by stimulating technological innovation within enterprises. Porter & Linde (1995) [8] argue from a dynamic perspective that while environmental regulations may increase production costs for enterprises, when these regulations have appropriate and reasonable standards, they effectively motivate enterprises to engage in technological innovation. This leads to innovation compensation effects, ultimately enhancing the competitive advantage of enterprises, known as the “Porter’s Hypothesis”. This viewpoint is supported by the majority of scholars. Rubashkina & Galeotti et al. [9] conducted a study on the European manufacturing industry sector and found that environmental regulation has a positive impact on technological innovation. Krysiak [10] developed a two-sector model that combined technology demand and supply guided by environmental regulation. This model included the production sector and the R&D sector and analyzed the equilibrium of technological demand and R&D under three types of regulations: pollution taxes, environmental standards, and market emission permits. The study found that the R&D sector would be biased towards different technological R&D under different intensities of environmental regulation. Testa & Daddi (2011) [11] categorized technological innovation into process innovation (investment in environmental technologies) and product innovation. The study found that environmental regulation significantly contributes to the “investment in technological innovation” and “technician capability” variables.
Research on Synergistic Development
Research has been conducted on the connotation of synergistic development. The concept of synergy is derived from the theory of synergism, which refers to the process of mutual collaboration within a system to promote its benign development. Synergism was originally proposed by German physicist Hermann Haken in the 1960s [12]. Synergistic development refers to the state or trend of mutual coordination and synchronization among elements within different entities, presenting a synergistic structure and reflecting a synergistic function. This promotes the evolution of entities or systems through a certain dynamic regulatory mechanism to achieve coordinated and synchronized development. Current research on synergistic development focuses on various areas, including regional economic or city cluster synergistic development [13- 16], industrial synergistic development [17-20], and synergistic development of economic-environmental composite systems [21-23], among others.
Research on synergistic development employs various methods, including gray system theory, input-output theory, and synergistic theory. Gray system theory is often used by scholars to assess the level of synergy in uncertain systems where “some information is known and some information is unknown”. One specific method within gray system theory is gray correlation analysis, which measures the level of synergy by evaluating the strength of the connection between samples [24]. Some scholars evaluate synergy from an input-output perspective by considering one system factor as an input variable and another system factor as an output variable. They then reverse the roles of the input and output variables to measure the effectiveness between the systems, where higher effectiveness indicates synergy and vice versa. For instance, Moutinho et al. [25] employed Data Envelopment Analysis (DEA) to predict the eco-efficiency scores of 24 German cities and analyze the synergistic effects they generate in reducing climate change impacts and noise. According to the theory of synergism, some scholars define the order parameter and order degree and measure the synergism of the system by the degree of progress of the order degree of the existing state of the system compared with the order degree of the base state. The specific methods include the Harken model, the composite system synergism model, and the coupling coordination degree model. For example, Leydesdorff and Ivanova [26] evaluated the synergy between science and technology innovation and science and technology finance based on the principle of synergistic dominance by determining the order parameter and constructing the synergy measurement model.
In summary, first, while scholars have conducted research on the relationship between environmental protection and industrial development, most of the research has focused on analyzing the influence of one party on the other. There is a lack of research on the synergistic development of environmental protection and industry. Secondly, current research on synergistic development is mainly focused on national or city clusters. Few studies have been conducted from the perspective of watersheds. As an important watershed ecosystem and resource base in China, studying synergistic industrial development and environmental protection in the Yellow River Basin provinces is crucial for China’s high-quality development.
In light of the aforementioned gaps in research, this paper aims to investigate whether there is a synergistic effect between industry and the environment in the Yellow River Basin. If such a synergy exists, the paper seeks to determine which factor is in the leading position and what the development law is. To address these scientific questions, this paper employs the Topsis method to quantitatively measure and analyze the levels of industry and environment in the Yellow River Basin provinces from 2011 to 2021. The paper also explores the synergistic relationship between the two factors and their development law using the Harken model. Furthermore, kernel density estimation is used to analyze the distribution of the level of synergistic development between industry and the environment. The findings of this study will provide a reference for achieving a mutually beneficial interaction between industry and the environment in the Yellow River Basin.
Study Area and Data
The Yellow River Basin encompasses nine provinces, namely Qinghai, Sichuan, Gansu, Ningxia, Inner Mongolia, Shaanxi, Shanxi, Henan, and Shandong. However, it is important to note that only two counties in Sichuan Province, namely Aba and Ganzi, are part of the Yellow River Basin. Therefore, this paper primarily focuses on the other eight provinces within the region. The upper reaches of the Yellow River Basin include Qinghai, Sichuan, Gansu, and Inner Mongolia. The middle reaches consist of Shaanxi and Shanxi, while the lower reaches comprise Henan and Shandong.
The Yellow River Basin plays a critical role in protecting China’s ecological security, with 12 national key ecological function areas and nearly 100 water-related protected areas located within its borders. The ecological barriers of the Tibetan Plateau, the Loess Plateau-Chuan-Yunnan, and the Northern Sand Control Belt also pass through or are situated in the Yellow River Basin [27]. As a significant ecological corridor connecting the Qinghai-Tibet Plateau, Loess Plateau, and North China Plain, the Yellow River Basin serves as an essential protector of the ecological security of the North China Plain and the Yellow and Huaihai Plains.
The Yellow River Basin is an important grain-producing area in China and a major production base for cotton, oilseeds, and livestock products, which is of great economic importance. It is also an important energy production center [28]. The upper reaches of the Yellow River are rich in hydropower resources; the middle reaches possess a large amount of coal resources and the lower reaches are rich in oil and natural gas reserves. There are 6,835 coal- producing areas (wellfields) with a combined reserve of 449.24 billion tons in the base, accounting for 46.5% of the national coal reserves, which can meet half of the national coal demand. In addition, the proven reserves of oil and natural gas in the basin are 4.1 billion tons and 67.2 billion cubic meters, respectively, accounting for 26.6% and 9% of the national total geological reserves.
The Yellow River Basin holds strategic importance in terms of national unification and stability [29]. It is a region characterized by its multiethnic and multireligious composition, with the main ethnic groups including Hui, Mongolian, Tibetan, Yi, Manchu, Qiang, and Salar. According to the data from the sixth population census, ethnic minorities in the Yellow River Basin make up approximately 4% of the total population. Qinghai Province has the largest population of ethnic minorities, accounting for 47% of the province’s total population, with 98% of the area designated as a regional ethnic autonomy. In Ningxia, the Hui population represents 33% of the total population of the region and 34% of the total population of the province. The Yellow River Basin exhibits a diverse ethnic composition and a variety of religions, with Islam being predominantly practiced by the Hui and Salar ethnic groups, while Tibetan Buddhism and Confucianism are followed by Tibetans, Turks, and Mongolians. Therefore, the protection of the ecological environment in the Yellow River Basin is not only crucial for the well-being of its inhabitants but also plays a significant role in realizing the Chinese dream of the great rejuvenation of the Chinese nation.
Research Methodology and Data Sources
Research Methodology
Entropy Weight-Topsis Method
The TOPSIS method is a ranking method that approximates the ideal solution through positive and negative ideal solutions and distances to obtain relative closeness. Based on the value of the advantages and disadvantages, it ranks the solutions. This method has an advantage over other evaluation methods, as it considers the importance of each attribute, avoids subjectivity and uncertainty, and improves the accuracy and reliability of decision-making. It can also handle attributes with negative values, making it widely applicable. In this study, the entropy weight method is used to objectively determine the weight of evaluation indexes, where the smaller the entropy value, the larger the weight. The TOPSIS method is then employed to conduct a comprehensive evaluation of the development level of environmental and industrial systems. The specific steps are as follows:
1. Standardization of indicator data:
Positive indicators:
Inverse indicators:
2. Solve for the proportion of each indicator in each sample, i.e., the variability of the indicator:
3. Calculate the information entropy of each indicator:
4. Determine the weights of each indicator:
5. Construct the weighted normalization matrix of evaluation indexes:
6. Determine the positive ideal solution (Z+j) and the negative ideal solution (Z−j) using the TOPSIS method as follows:
denotes the most preferred solution value and the least preferred solution value obtained by the j-th indicator at the i-th object.
7. Calculate the distance of the evaluation index from the positive and negative ideal solutions:
8. Calculate the relative closeness:
The relative closeness indicates the difference between the evaluated object and the ideal state, and its value is between 0 and 1.
Harken Model
Haken’s model is an important model in the study of synergy theory. Compared to other research models, this model not only effectively reveals that the sequence parameter is the primary control element driving the system’s synergy but also depicts the system’s position away from equilibrium under the influence of the sequence parameter. This allows for a better understanding and analysis of the interactions and synergistic mechanisms between the various components within the system. The modeling process is as follows:
1. Propose hypotheses and construct motion equations. In the Haken model, the sequence parameter is the slow variable driving the system’s development. The slow variable influences the fast variables in the system and determines the overall evolution direction of the system. Let’s assume q1 represents the slow variable in the system, and q2 represents the fast variable. The motion equations for the coordinated development of q1 and q2 are as follows:
Where: a, b indicates the degree of synergistic influence between q1 and q2. When a>0, it means that q2 hinders the development of q1, when a<0, it means that q2 plays a role in promoting q1; when b>0, it means that q1 boosts the development of q2, when b<0, it means that q1 plays a role in hindering q2; the larger the value of a, b, the more obvious the degree of action. γ1, γ2 are damping coefficients. When γ1< 0 indicates that q1 evolves a positive feedback mechanism on the two systems; the larger the value of γ1, the higher the degree of system order. When γ1> 0 indicates that the evolution of q1 on the two systems is a negative feedback mechanism; the larger the value of γ1, the higher the system disorder. When γ2< 0 indicates that the evolution of q2 on the two systems is a positive feedback mechanism, and the development of q2 can enhance the order of the system; when γ2> 0 indicates that the evolution of q2 on the two systems is a negative feedback mechanism.
2. Solve the parameters of the motion equations and determine if the “adiabatic approximation condition” is satisfied to obtain the system’s sequence parameter. Based on the fitted values of the industrial development and environmental protection system data from various provinces in the Yellow River Basin, the parameters of the motion equations can be determined. Then, equation (14) and (15) can be evaluated to determine if they satisfy the adiabatic approximation condition:
3. Solve the system evolution equation and potential function. If the adiabatic approximation condition is satisfied, the system evolution equation is obtained by making
4. Solve for the system score value. In equation (14), make
To facilitate the measurement of the degree of synergy between the two systems, d is normalized, resulting in the score of the synergy development between the two systems:
The range of the synergy development score calculated using Equation (16) is (0,1). To facilitate the evaluation of the specific level of environmental and industrial synergy development, the score is divided into three stages: low-level synergy (0.000,0.333), moderate synergy (0.334,0.666), and high-level synergy (0.667,1.000) [30].
Nuclear Density Estimates
Kernel density estimation is often used to characterize the dynamic evolution characteristics of the research object. It is a non-parametric estimation method that uses a smooth curve to estimate the density function of a random variable. Compared to other estimation methods, it has the advantages of strong robustness, weak model dependence, and no need for any prior knowledge of data analysis [31]. Kernel density estimation can effectively reflect the overall distribution of the level of synergy development between industry and environment in the Yellow River Basin. It is usually expressed in the form of a Gaussian function as the kernel function, with the following formula:
In the equation, K(x) represents the kernel function, n is the number of observed values, Y is the observed value, x is the mean of the observed value, h is the bandwidth, and the larger its value, the smoother the curve and the lower the estimation accuracy. f(x) is the marginal kernel density function of x, and f(x,y) is the joint kernel density function of x and y.
Indicator System and Data Sources
An indicator system can help establish a systematic and comprehensive research framework. By selecting a set of relevant indicators, it is possible to comprehensively consider various aspects and dimensions of the research object, thereby better understanding its characteristics and changes. It helps clarify the key areas of environmental and industrial synergy development and provides an actionable framework for further analysis and interpretation.
Construction of the Indicator System
This paper assesses the environment based on three interrelated aspects: environmental pressures, environmental state, and environmental governance (Table 1). They form the elements of an environmental system. Environmental pressure reflects the extent of the impact of human activities on the environment, while environmental state reflects the quality and health of the environment. Environmental governance, on the other hand, pertains to the measures taken to mitigate environmental pressure and improve the environmental state. By considering all three aspects together, a more comprehensive environmental assessment can be obtained.
The assessment of environmental conditions should primarily encompass indicators that effectively gauge environmental quality and the state of natural resources. As such, four key indicators have been chosen: the total volume of available water resources, the extent of forested areas, the green coverage within urban developments, and the per capita area of urban parks and green spaces. When it comes to evaluating environmental pressures, the focus should primarily be on the impacts stemming from human activities, including issues related to environmental pollution and resource consumption. As humanity transitioned from an agricultural-based era to the industrial age, industrial activities emerged as the primary source of pressure on the ecological environment. This is particularly evident in the concentration of polluting industries within the Yellow River Basin, which are notorious for their substantial emissions of various pollutants, notably the “three wastes“. Within the context of assessing the current environmental status, six pertinent indicators have been selected, aligning with existing research and data availability. These indicators encompass the total quantity of discharged wastewater, emissions of industrial sulfur dioxide and industrial particulate matter, the generation of general industrial solid waste, water consumption per unit of GDP, and energy consumption per unit of GDP. When addressing environmental governance, the emphasis should primarily be on implementing measures that support environmental protection. Keeping data accessibility in mind, the following six indicators have been identified: the comprehensive utilization rate of general industrial solid waste, the rate of centralized treatment for urban sewage in treatment plants, the proportion of domestic garbage subjected to harmless treatment, investments made in industrial pollution control, investments in the construction of urban environmental infrastructure, and investments in ecological construction and protection.
This paper conducts an assessment of industrial development through a triad of dimensions: industrial structure, industrial competition, and industrial agglomeration. These three aspects are intricately intertwined and collectively form the fundamental elements of the industrial system. Industrial structure pertains to the composition and arrangement of industries within a specific region or country. Meanwhile, industrial competition delves into the competitive dynamics among different enterprises operating within the marketplace. Lastly, industrial agglomeration addresses the phenomenon of related industries clustering within a particular geographic area. By comprehensively considering these three dimensions, a deeper understanding of their interplay and correlations can be achieved. An all-encompassing evaluation of industrial development within the realms of industrial structure, industrial competition, and industrial agglomeration serves as a cornerstone for informed decision-making. This approach facilitates an examination of the rationality and adaptability of industrial structure, the degree of industrial competition, and the impact of industrial agglomeration. Identifying issues through this comprehensive evaluation allows for the formulation of pertinent industrial policies and development strategies.
In this regard, this paper employs a selection of prominent indicators to characterize each dimension: Industrial Structure: This dimension is characterized by the utilization of the most representative indicators such as the industrialization rate, the industrial structure advancement index, and the industrial structure rationalization index. Industrial Agglomeration: It is assessed through commonly used indicators that describe agglomeration, specifically, the market agglomeration scale and the advantages of industrial division of labor. Industrial Competitiveness: The evaluation of industrial competitiveness takes into account multiple factors, including industrial input, industrial output, industrial technological innovation, the industrial policy environment, the industrial technical support environment, and the incubation environment.
Data Sources and Processing
This paper focuses on analyzing the data from the other eight provinces and regions in the Yellow River Basin, covering the period from 2011 to 2021. The study includes various environmental indicators such as total water resources, afforestation area, green coverage rate of built-up areas, and per capita green park area in cities. Additionally, it examines industrial factors such as the R&D expenditure of large-scale industrial enterprises, technology market turnover, new product development projects, effective invention patents, and the proportion of R&D expenditure to GDP. The data sources for these indicators are the China Statistical Yearbooks and local statistical yearbooks. Furthermore, the study considers key environmental metrics like wastewater discharge, industrial emissions of SO2 and particulate matter, and general industrial solid waste production. These figures are obtained from the China Environmental Statistical Yearbook. Additionally, it explores the comprehensive utilization rate of general industrial solid waste, the centralized treatment rate of municipal sewage treatment plants, and the harmless treatment rate of household waste, which are sourced from the China Energy Statistical Yearbook. The number of high-tech industry enterprises is derived from the China High-Tech Industry Statistical Yearbook, while the count of national science and technology business incubators are obtained from the Torch Center of the Ministry of Science and Technology.
In this study, the water consumption per unit of GDP and the energy consumption per unit of GDP are calculated by dividing the water consumption and energy consumption figures from each local statistical yearbook by the corresponding GDP values of each year. The industrialization rate is determined by dividing the industrial added value of each local area by its GDP. The calculation of the Herfindahl Hirschman Index (HHI) and the industrial location quotient coefficient is based on the work of scholar Han Yunhong [32]. To address missing data, the interpolation method was used to complete the number of high-tech industrial enterprises in the Inner Mongolia Autonomous Region for the years 2017 to 2018.
Results and Discussion
Measurement Results of the Development Level of Industry and Environmental System in the Yellow River Basin
Based on the TOPSIS model, the industrial and environmental development levels of the eight provinces in the Yellow River Basin were measured as shown in Fig. 1:
Based on Fig. 1, it can be observed that there has been a significant increase in the comprehensive evaluation of the environmental and industrial systems in the eight provinces and regions of the Yellow River Basin during the study period. This indicates that the ecological environment and industrial development in the Yellow River Basin have improved and will continue to improve. However, the environmental and industrial development levels of each province during different periods are not synchronized.
Shandong Province and Henan Province have better ecological environment levels compared to other provinces. During the study period, Qinghai Province showed the largest increase in the environmental system level, while Inner Mongolia had the smallest increase. In the middle of the study, the ecological environment in the Yellow River Basin had already improved, with Inner Mongolia and Henan leading the way, followed closely by Shandong, Shaanxi, and Gansu. There was a significant improvement compared to the early stage, with the gap between them and the leading provinces narrowing. In the late stage of the study, except for Inner Mongolia, Shaanxi, and Shandong, the environmental development level was relatively low compared to other provinces. In terms of the comprehensive evaluation index of the industrial system, Shandong Province initially had a higher level compared to other provinces. During the study period, Ningxia showed the largest increase in the environmental system level, while Shandong had the smallest increase. In the middle of the study, there was no significant improvement in the industrial system in the Yellow River Basin, with relatively large increases seen in Ningxia and Henan. In the late stage of the study, all provinces had relatively high levels of industrial development, with Ningxia having the highest level of industrial system development.
Fig. 1.
Level of industrial and environmental development in the Yellow River Basin by province, 2011-2021.
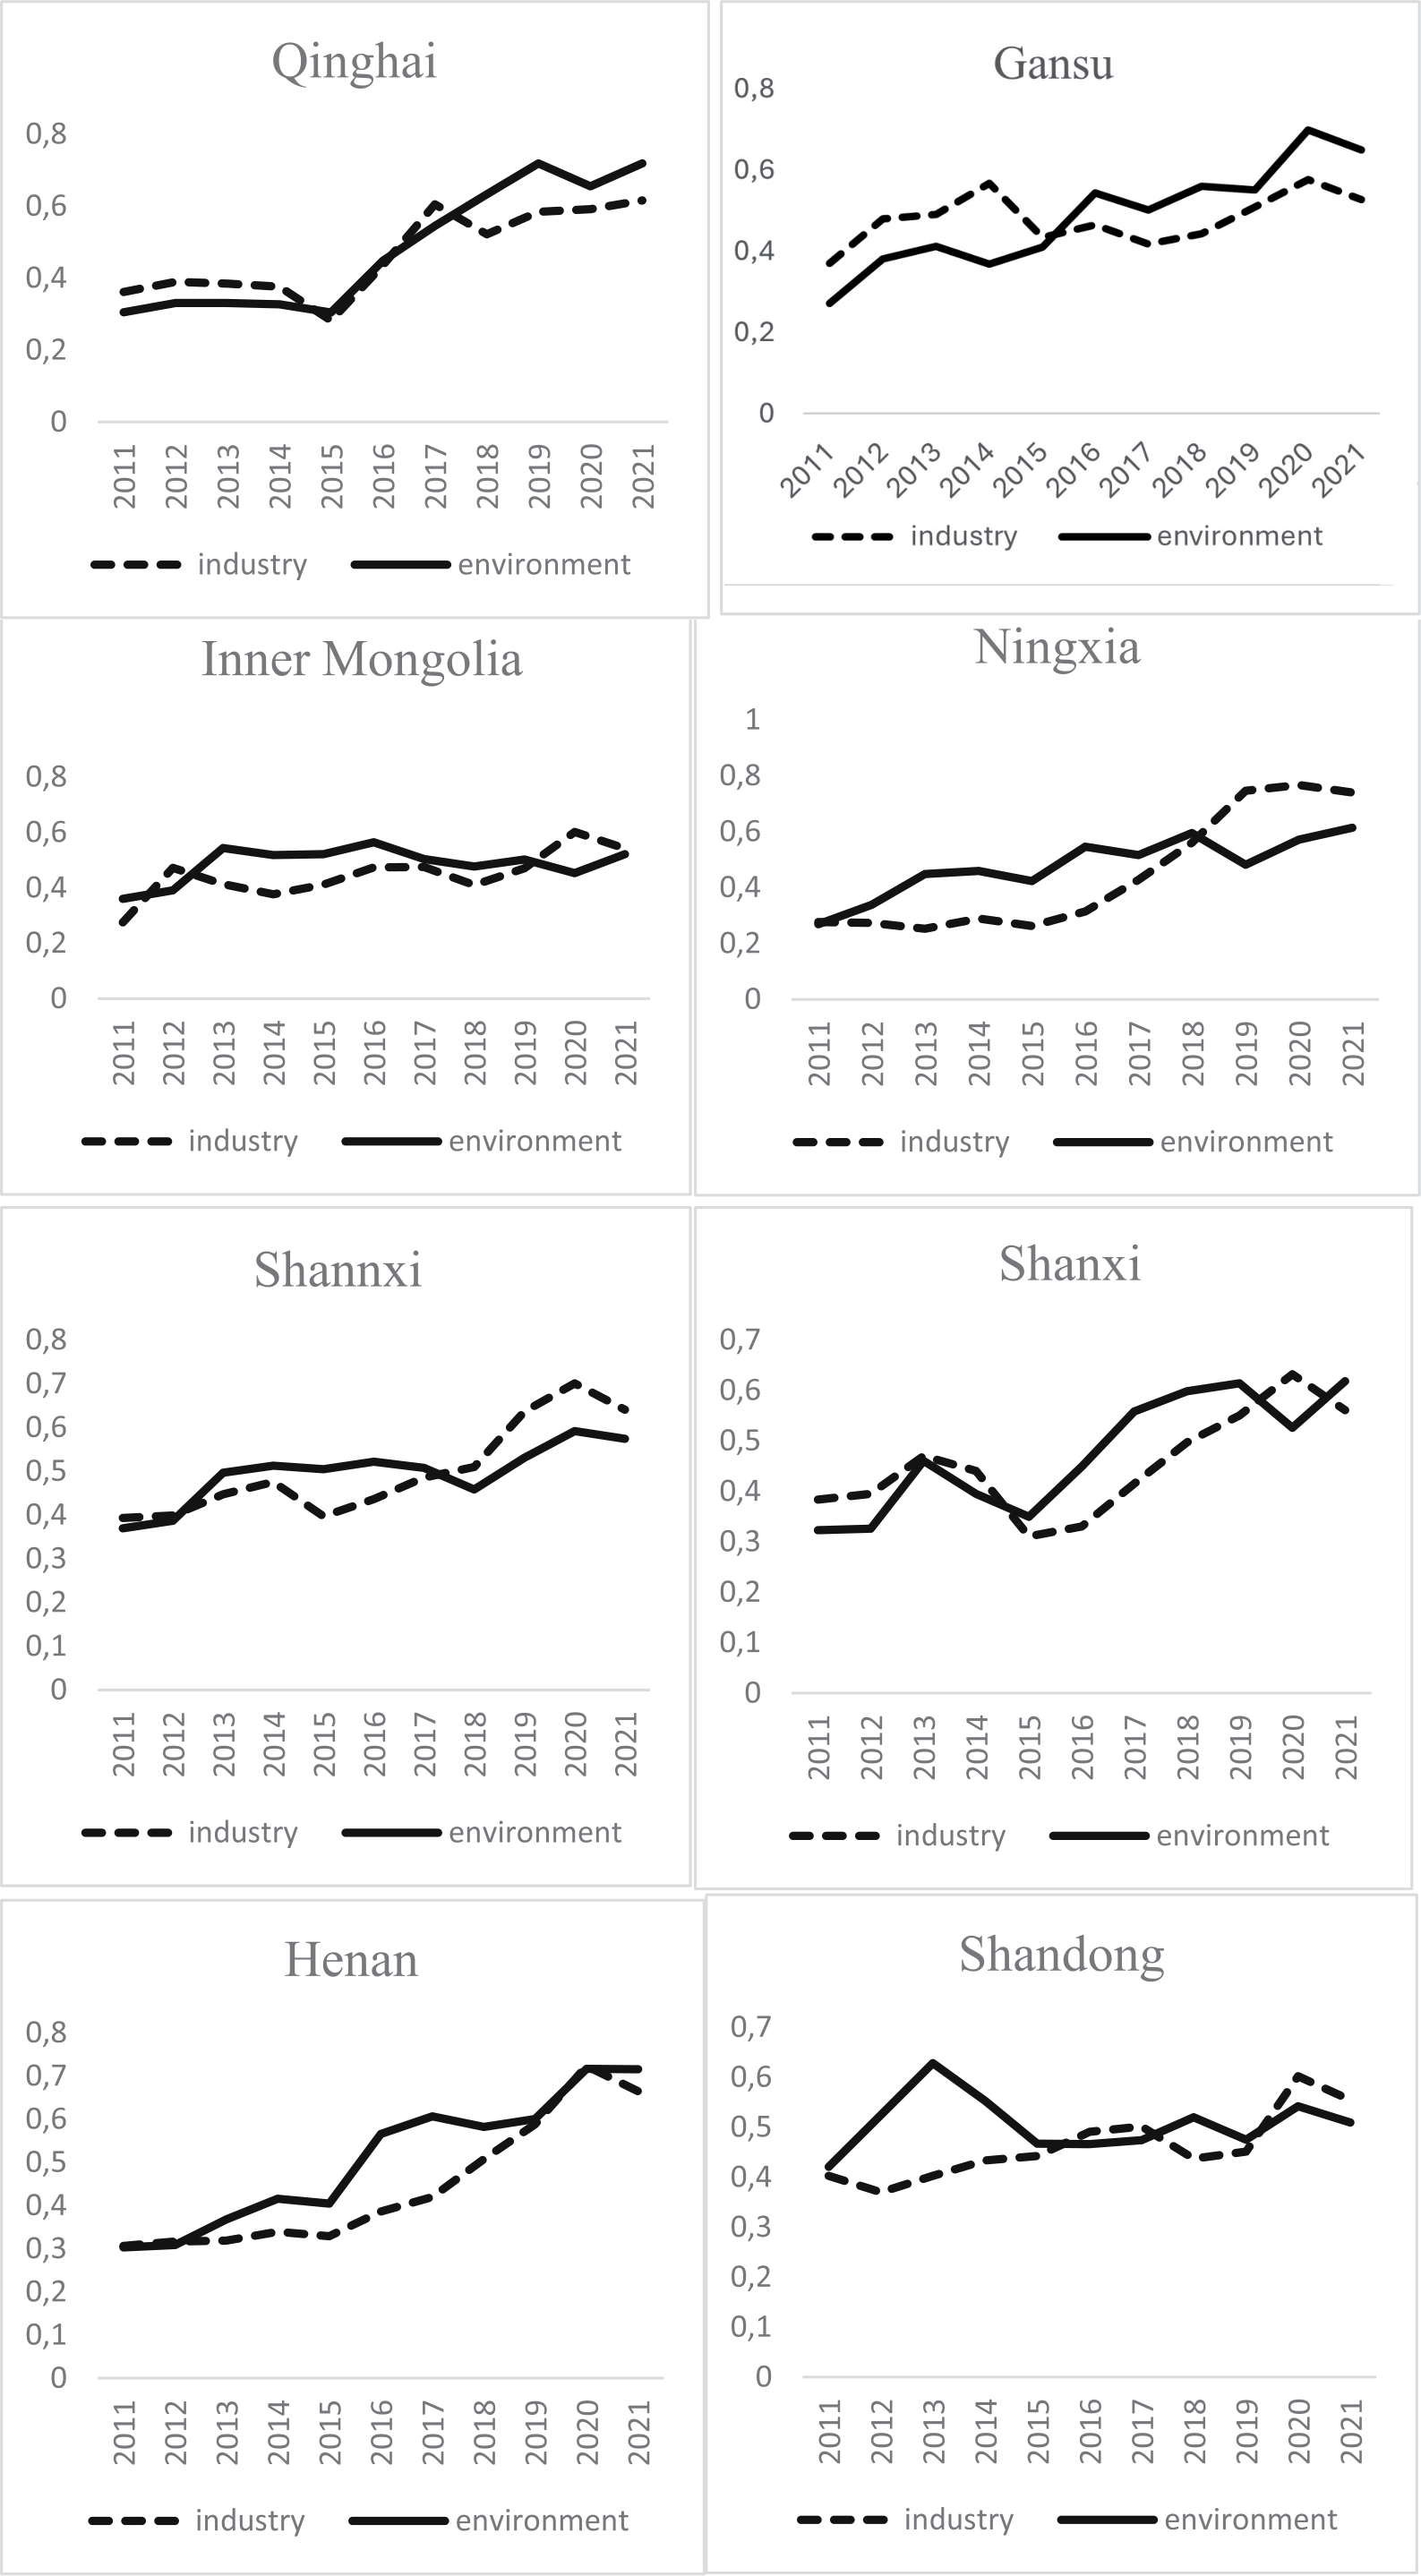
Table 1.
Indicators for measuring the synergy between environmental protection and industries in the Yellow River Basin.
Table 2.
Harken model calculation results.
Measurement Results of the Harken Model
Potential Function Solution
After analyzing the fitting values of the development level data of industrial and environmental systems in the provinces of the Yellow River Basin from 2010 to 2021 using Equations (12, 13), Table 2 presents the results of the collaborative development of the two systems.
Table 2 shows that the hypothesis of the motion equation (2) model is established, indicating that during the study period, the industry system is a fast variable, while the environment system is a slow variable in the collaborative development of industry and environmental systems in the Yellow River Basin. The industry plays a significant role in promoting the development of the environment, while the environmental system controls the path and direction of the complex system’s collaborative evolution.
From equation of motion 2 in Table 2, γ1 = -0.054; γ2 = 0.298; a = 0.212; b = -0.576, which can be calculated using Equations (14-17):
System evolution equations:
potential function:
Using
So its evaluation function is:
Co-Value Solving and Analysis
According to Table 3, the average synergy between environment and industry in the Yellow River Basin has shown a decreasing trend from 2011 to 2021. This suggests that there is still a significant imbalance between industrial development, resource conservation, utilization, and environmental protection in the region. There is a need for improvement in achieving synergistic development between these two aspects.
The Yellow River Basin is divided into three regions: the upper reaches (Qinghai, Gansu, Inner Mongolia, and Ningxia), the middle reaches (Shaanxi and Shanxi), and the lower reaches (Shandong and Henan). Fig. 2 illustrates that the synergy level in each province of the upstream region has been declining. In 2011, the order of synergy was Ningxia, Gansu, Qinghai, and Inner Mongolia. However, after 2018, Inner Mongolia surpassed other provinces in terms of synergy. This can be attributed to Ningxia’s favorable geographic location and abundant water resources, leading to early agricultural development and a high level of comprehensive environmental development. In contrast, Inner Mongolia’s focus on strategic emerging industries and advanced manufacturing has significantly improved its industrial structure and synergistic level between industry and the environment.
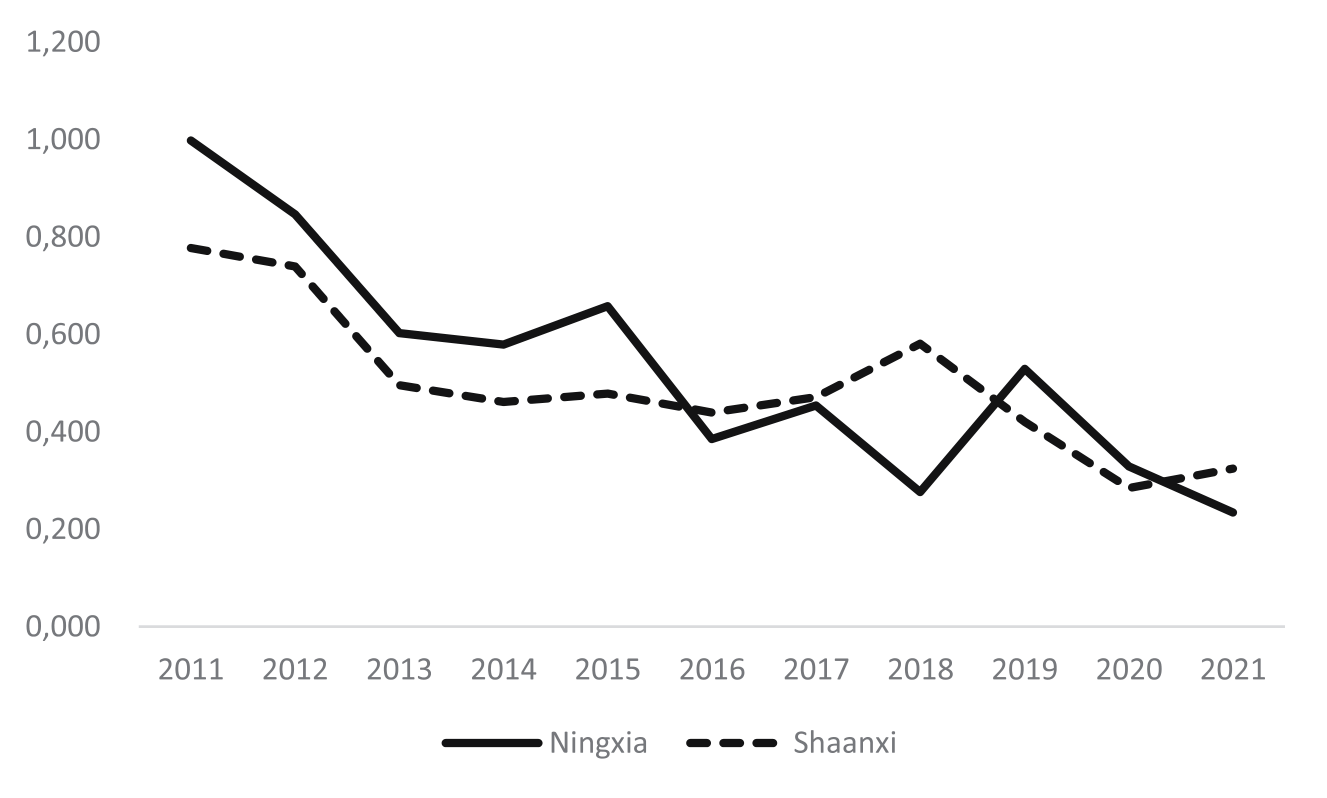
Fig. 3 shows that in the midstream region, Shanxi had a higher synergy level than Shaanxi in 2011. However, by 2021, Shaanxi had surpassed Shanxi in terms of synergy. This can be attributed to Shanxi’s heavy reliance on the coal and energy industries, which lack effective ecological and environmental management. In contrast, Shaanxi has undergone a robust industrial transformation, developing new industries and implementing restrictions on polluting enterprises.
Table 3.
Synergy value of industry and environment development in the Yellow River Basin, 2010-2021.
Fig. 2.
The trend of changes in synergy between the environment and industry in the upstream provinces of the Yellow River Basin from 2011 to 2021.
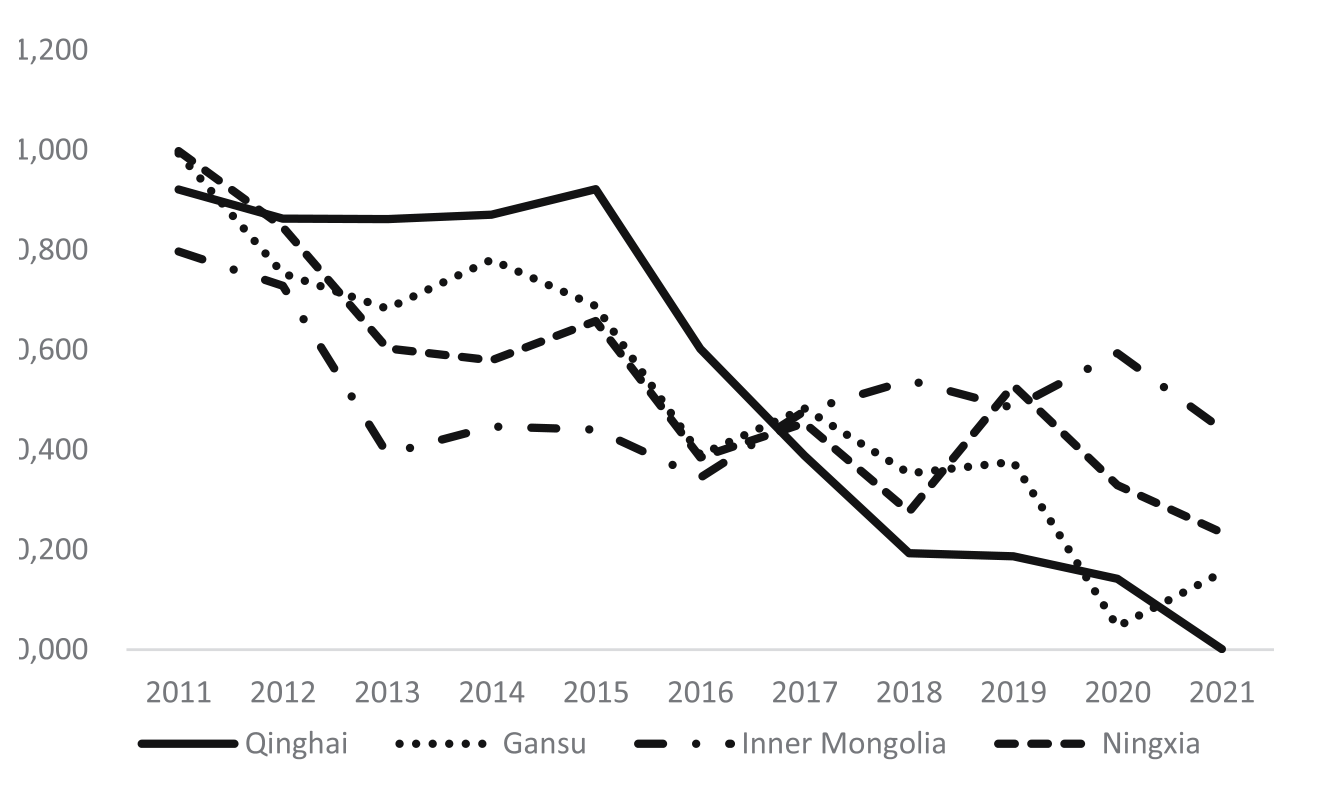
Fig. 3.
The trend of changes in synergy between the environment and industry in the midstream provinces of the Yellow River Basin from 2011 to 2021.
Based on Fig. 4, there was a significant difference in synergy between Henan and Shandong Provinces in the downstream area. In 2011, Henan had a higher synergy level, while in 2021, Shandong surpassed Henan. This can be attributed to the fact that during the early stage of the study, Henan’s main industry was agriculture, whereas Shandong had a more developed heavy industry. However, in the later stage, Shandong focused on industrial restructuring and the development of new green industries, leading to a higher level of synergy between the environment and industry compared to Henan.
According to Fig. 5, there is a noticeable change in the overall synergy trend between the upstream, midstream, and downstream areas. Initially, the trend was “upstream > midstream > downstream”, but in 2021, it shifted to “upstream < midstream < downstream”. The upstream area, despite having lower levels of capital and technology and less advanced industrial development compared to the midstream and downstream areas, relies primarily on agriculture. This reduces its dependence on the environment for industrial growth. However, in pursuit of economic development, the upstream provinces have focused on heavy chemical industries, resulting in significant ecological damage and a decline in environmental quality. Consequently, the synergy between environmental protection and industrial development in the upstream area has continuously declined. The midstream area, which is also rich in resources, has made some improvements in its industrial structure compared to the upstream provinces. However, it still lags behind the downstream area in terms of economic base and development scale. Being large energy provinces with heavy industries, the midstream provinces have caused greater pollution and ecological damage during their industrial development. In contrast, the downstream area benefits from its favorable geographical location, higher levels of capital, technology, and talent, as well as a more balanced industrial structure. It has been able to achieve a better balance between economic development and ecological environment protection. Although the synergy between environmental protection and industrial development is higher in the later stages compared to the upstream and midstream areas, it has not yet reached an optimal level of synergistic development. Additionally, the continuous population growth in the downstream area poses significant pressure on environmental management. Overall, there is a need for further efforts to enhance the synergy between environmental protection and industrial development across all regions of the Yellow River Basin.
Fig. 4.
The trend of changes in synergy between the environment and industry in the downstream provinces of the Yellow River Basin from 2011 to 2021.
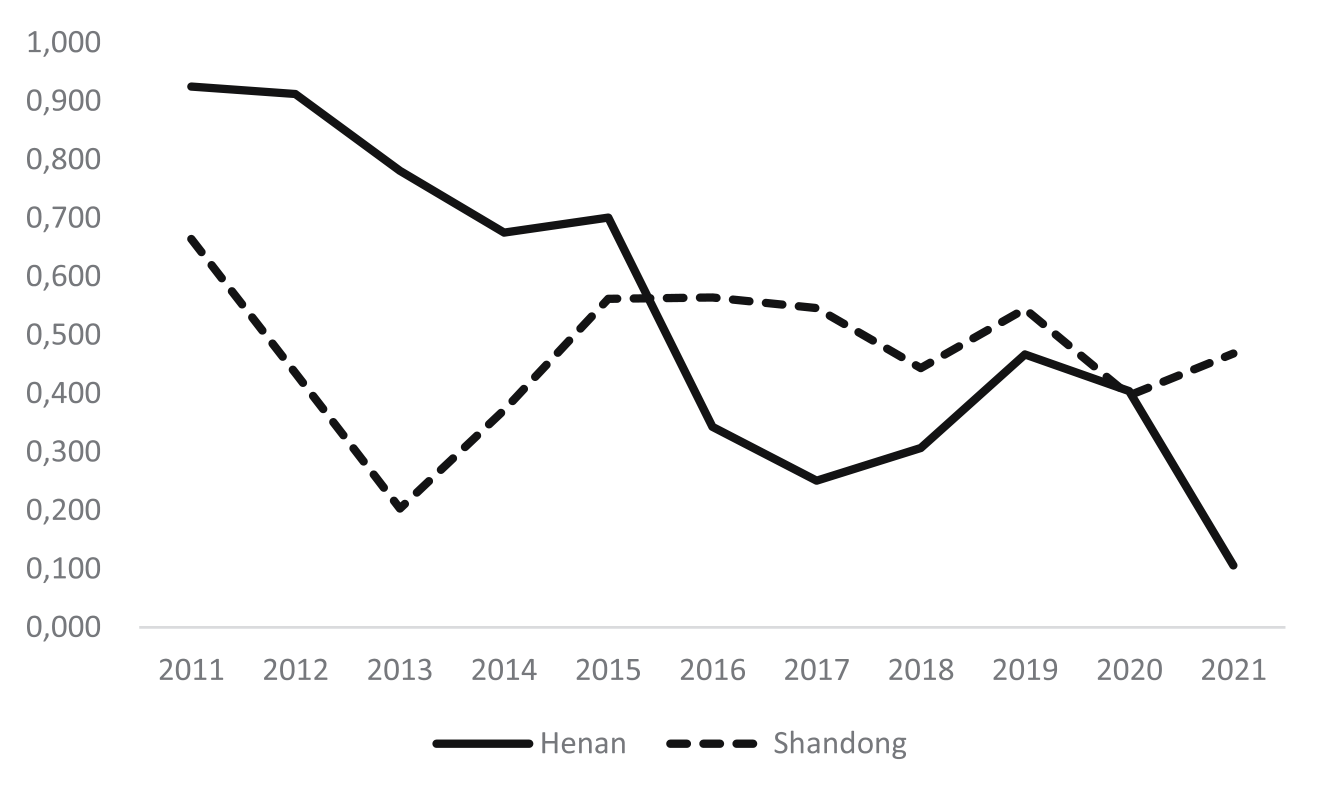
Fig. 5.
The trend of changes in synergy between the environment and industry in the upstream, midstream, and downstream areas from 2011 to 2021.
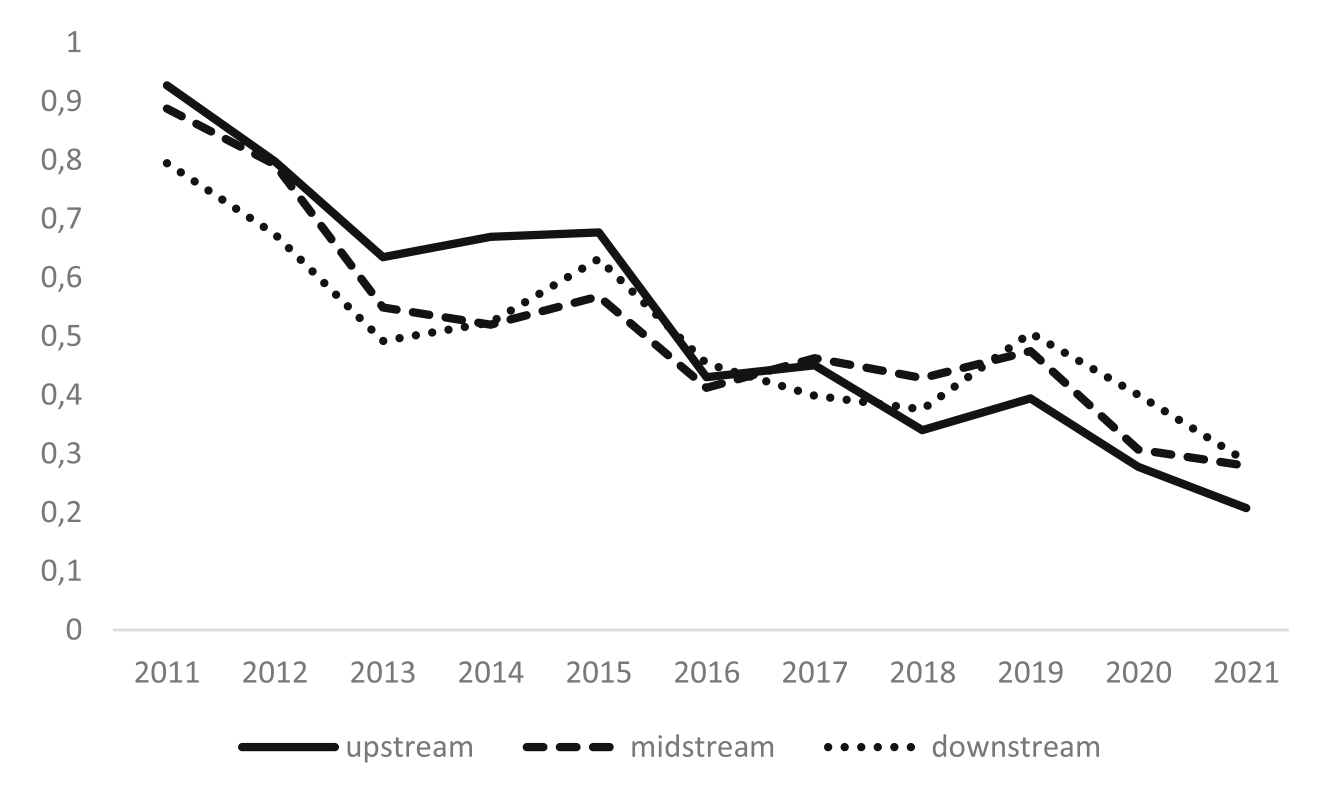
Table 4.
The level of synergy between the environment and industry in the Yellow River Basin from 2011 to 2021.
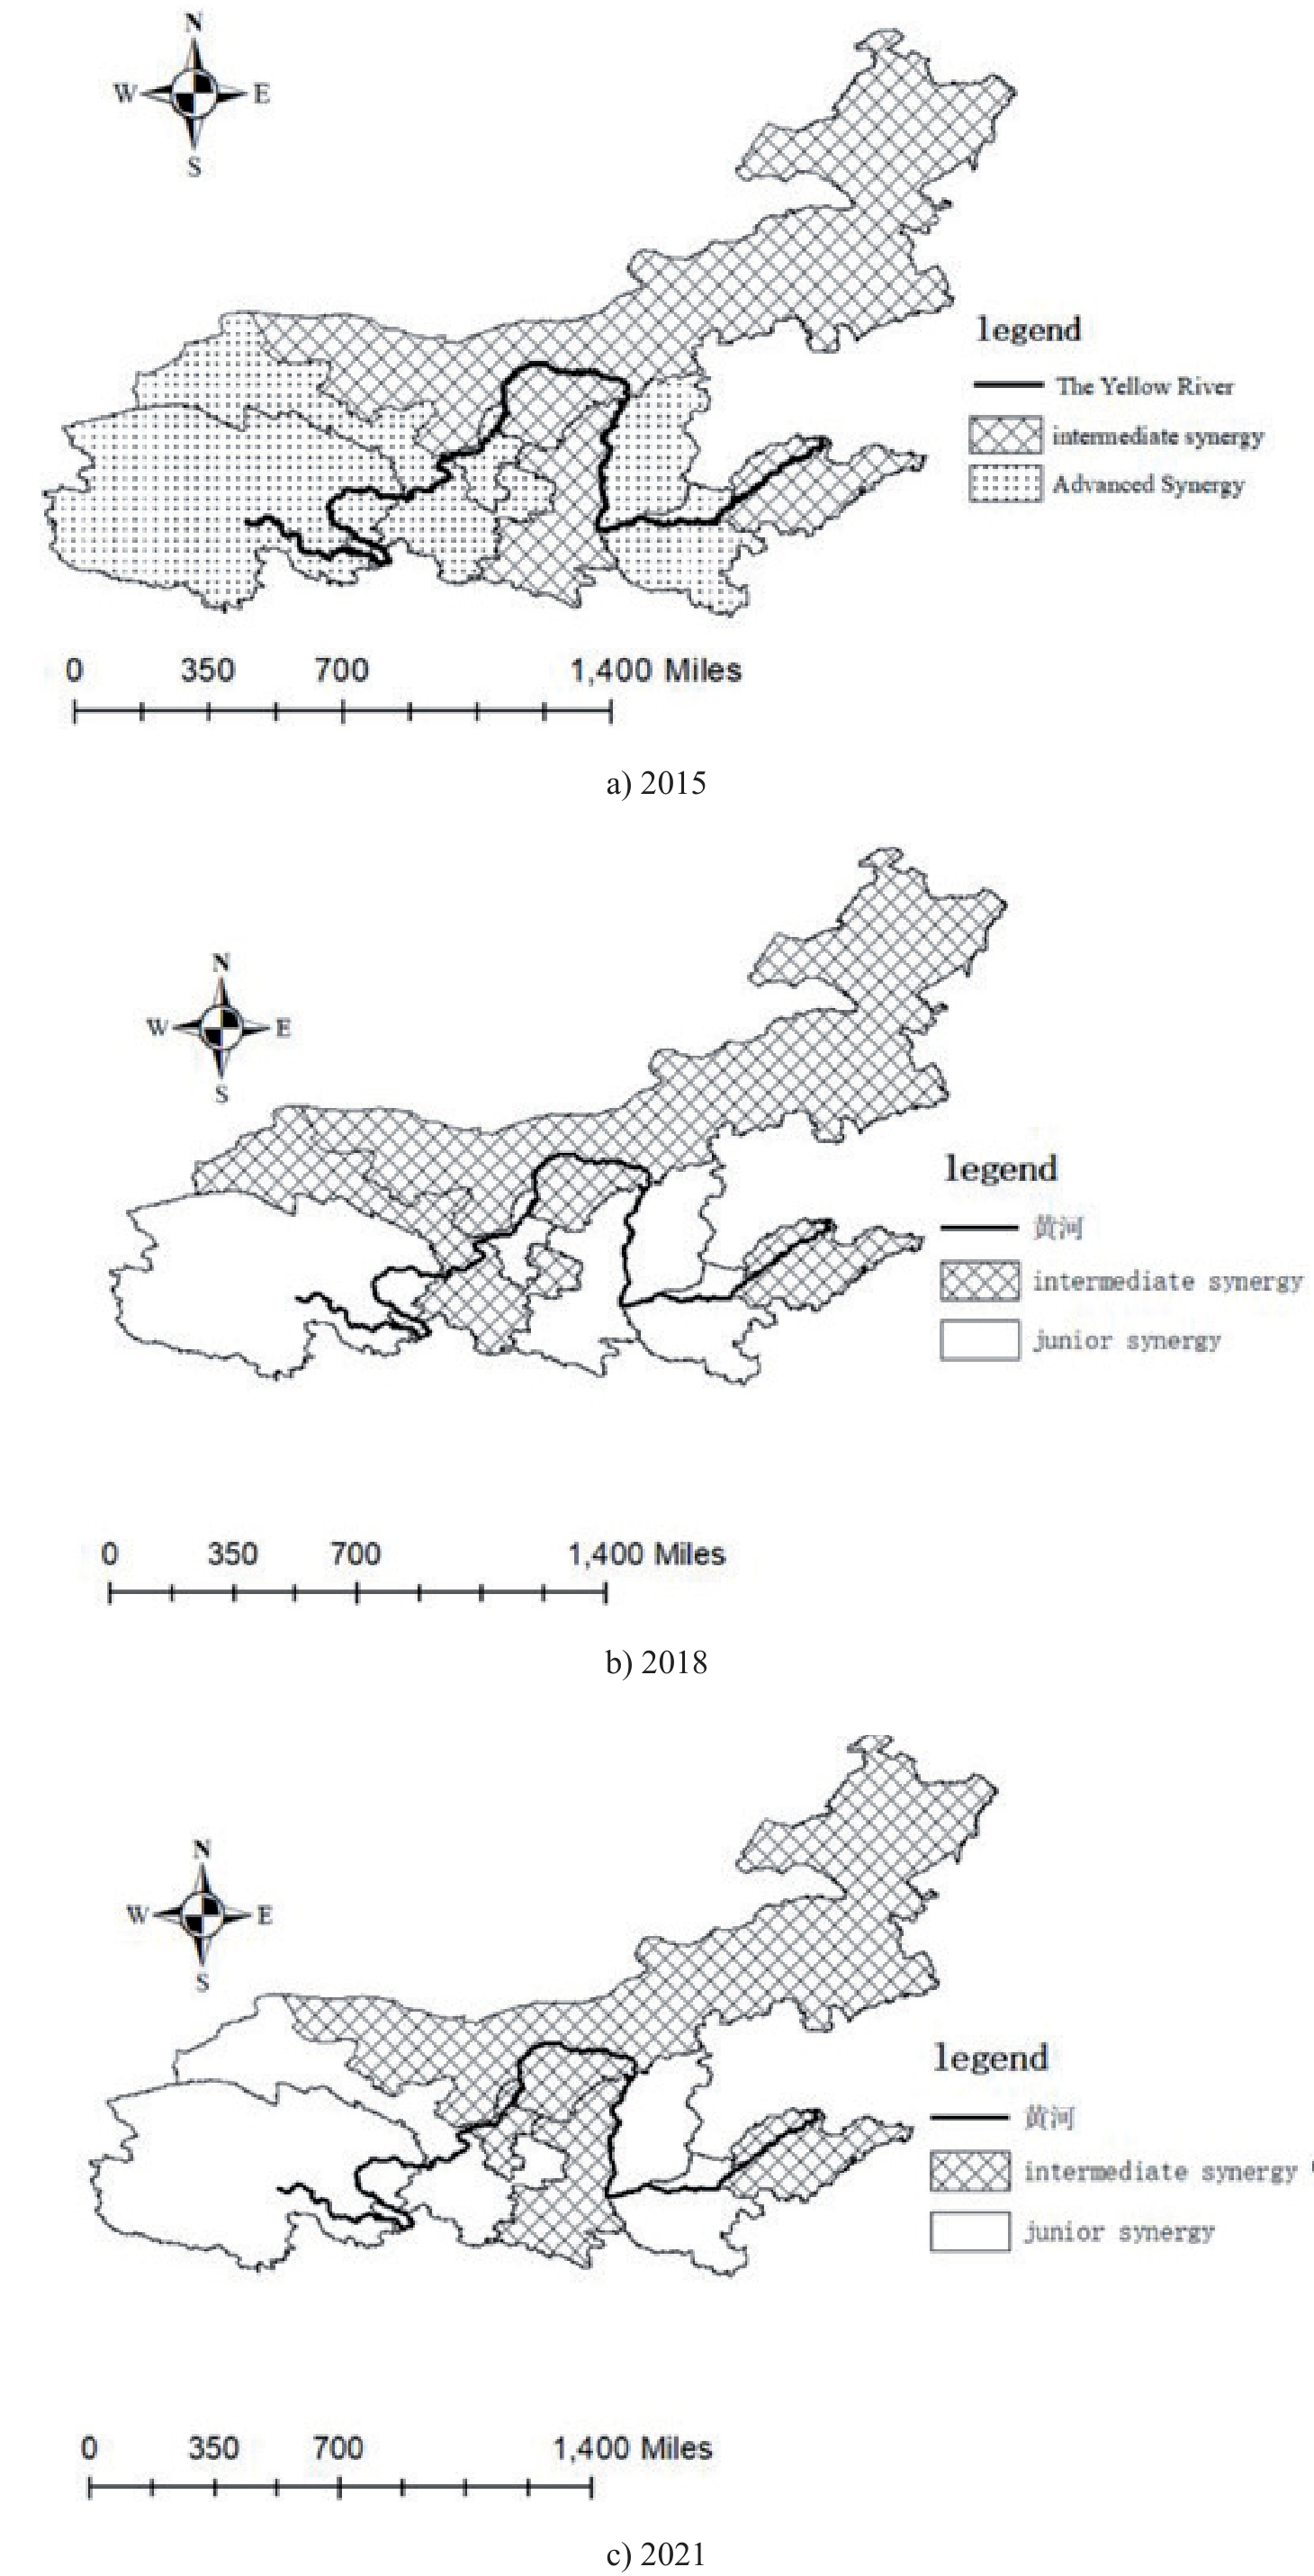
To further explain the differences in the co-evolution of industry and environment among provinces in the study area, the synergy level of all provinces during the study period was divided into three levels (Table 4): low-level synergy (0.000, 0.333), moderate synergy (0.334, 0.666), and high-level synergy (0.667, 1.000). In order to demonstrate the spatial evolution trends and differences in inter-provincial industry-environment synergy from a spatial perspective, the synergy levels were visualized using ArcGIS software (Fig. 6) based on the values of each province in the Yellow River Basin. This article only presents the visualization results for the years 2015, 2018, and 2021.
The synergy level of the composite system in different periods shows significant differences among provinces in the study area. The average synergy level has declined from 2011 to 2021, but the gap has gradually narrowed over time. In 2015, except for Inner Mongolia, Shaanxi, and Shandong, which were in a state of moderate synergy, the other provinces were in a state of high-level synergy. In 2018, Qinghai, Gansu, Shanxi, and Henan were in a state of low-level synergy, indicating a significant decline in synergy levels from high to low from 2015 to 2018 in these four provinces. In 2021, Qinghai, Gansu, Shaanxi, and Henan were in a state of low-level synergy, while the others were in a state of moderate synergy. Compared to 2018, Gansu and Henan were lower than the period of 2011, and the synergy gap among provinces is gradually decreasing. However, none of the provinces have achieved high-level synergy, indicating that there is still a lot of room for development in the synergy between the environment and industry in each province. Since 2015, various policies have been implemented, and the development of industries and environments in various regions has been slowly advancing. Inner Mongolia, Shaanxi, and Shandong provinces have a moderate level of synergy, while their industries and environments are still developing. This indicates that less environmental pollution is caused by industrial development and that the synergy between the environment and industry is maintained at a good level. In 2019, ecological protection and high-quality development in the Yellow River Basin became a major national strategy. Under this background, the environmental protection behavior of companies, governments, and residents has increased, and the development of green industries has become an inevitable path for companies’ sustainable development.
Kernel Density Estimate
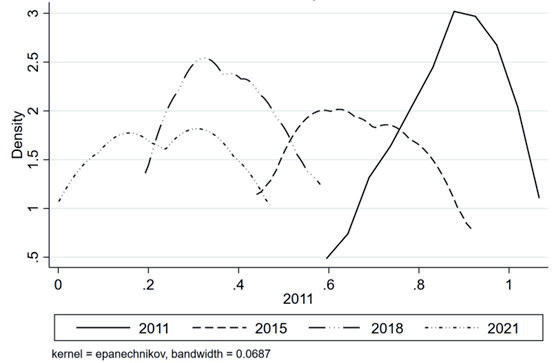
In this paper, the kernel density estimation method is used to analyze the dynamic evolution characteristics of the distribution of synergy levels in eight provinces in the Yellow River Basin from 2011 to 2021, and the kernel density curves are shown in Fig. 5.
From the kernel density estimation curve of the synergy level among the 8 provinces in the Yellow River Basin (Fig. 7), the following patterns can be observed in the dynamic evolution process of the distribution:
(1) In terms of the position of the distribution, from 2011 to 2021, the kernel density curve of the synergy level in the Yellow River Basin continuously shifted to the left, indicating a weakening trend in the synergy development level between industry and environment in the basin. The pattern of change from 2018 to 2021 is not as significant as that from 2011 to 2015. The peak values in 2015 and 2018 are very close on the horizontal axis, indicating that there is not much change in the synergy development level.
(2) In terms of the shape of the distribution, the kernel density curve from 2011 to 2015 gradually evolved from a unimodal distribution to a bimodal distribution, indicating that over time, there has been a clear polarization phenomenon in the synergy levels among the provinces. From 2015 to 2021, the peak heights of the kernel density curve for the synergy level in the Yellow River Basin first increased and then decreased, and the curve width first decreased and then continuously increased. This indicates that the synergy levels among the provinces in the Yellow River Basin were initially concentrated and then dispersed, and the regional differences showed an increasing-then-decreasing trend.
(3) In terms of the spread of the distribution, from 2011 to 2018, the kernel density curve for the synergy level between industry and environment in the Yellow River Basin gradually shifted from a left-skewed distribution to a right-skewed distribution. This indicates that the gap between provinces with higher levels and lower levels gradually increased during the study period. Provinces with higher synergy levels achieved more significant improvements, while provinces with lower levels progressed relatively slowly. From 2018 to 2021, the right-skewed trend weakened, indicating that the gap between provinces with higher and lower levels gradually decreased.
Conclusions
This article is based on the theory of synergy and constructs a composite system of environment and industry in the Yellow River Basin. The Topsis method is used to measure the development levels of the industrial subsystem and the environmental subsystem in the Yellow River Basin. At the same time, the Haken model is used to measure the synergy between the environment and industry in the 8 provinces of the Yellow River Basin from 2011 to 2021. The kernel density estimation method is used to analyze the overall distribution of the synergy development level between industry and environment in the Yellow River Basin. The empirical results show that:
1. The development levels of the environmental and industrial subsystems in the provinces of the Yellow River Basin have been increasing during the study period, and the regional differences have been narrowing. However, the increase in environmental and industrial development levels among the provinces during the study period was not synchronous, and there is still room for improvement in the environmental and industrial development levels of each province.
2. The average synergy level between the environment and industry in the Yellow River Basin showed a downward trend from 2011 to 2021, but the gap has been gradually narrowing over time. In the early stages of the study, the overall synergy showed a pattern of “upstream > middle stream > downstream”, but in 2021, it was “upstream < middle stream < downstream”.
3. From the distribution position, the kernel density curve of the synergy level in the Yellow River Basin continuously shifted to the left, indicating a weakening trend in the synergy development level. From the distribution shape, the distribution of the kernel density curve from 2011 to 2015 gradually evolved from a unimodal distribution to a bimodal distribution, indicating a clear polarization phenomenon in the synergy levels among the provinces. From 2015 to 2021, the synergy levels among the provinces in the Yellow River Basin first concentrated and then dispersed. In terms of distribution spread, from 2011 to 2018, the gap between provinces with higher levels and lower levels of industrial and environmental synergy development gradually increased, but from 2018 to 2021, the gap gradually decreased among provinces.
Although the environmental and industrial development levels of each province have been improving, the synergy between them has decreased, indicating that the development of industry and environment is not synchronized, and the development level of green industry in each province is low. Based on the research conclusions and the current situation of each province, this article proposes the following suggestions:
1. Qinghai Province mainly engages in the processing of agricultural and livestock products and the development of mineral resources. In order to achieve the coordinated development of the environment and industry, it should increase investment in scientific and technological innovation, promote the research, development, and application of green industry technology. Qinghai Province has abundant energy resources, especially solar and wind energy resources, so it should actively develop renewable energy industry.
2. Gansu Province mainly develops agriculture, animal husbandry, and industrial manufacturing, with key enterprises such as Lanzhou Petrochemical and Lanzhou Railway Company. Therefore, Gansu should adjust its industrial structure, promote the development of green industries, encourage the development of clean energy, renewable energy, and other industries, and promote the development of tourism, such as famous attractions like Dunhuang Mogao Grottoes.
3. In 2021, Inner Mongolia’s degree of synergy between industry and environment was moderate. Therefore, while continuing to maintain its current development ideas, Inner Mongolia should increase its ecological protection efforts to protect the integrity and stability of ecosystems such as grasslands, wetlands, and forests.
4. Ningxia has abundant coal and natural gas resources and has developed related industries such as the coal mining and the coal chemical industry. The energy and chemical industries account for the largest proportion of its GDP. The development of these industries has played an important role in Ningxia’s economic growth and job creation, but it has also caused environmental pollution. Therefore, Ningxia should strengthen environmental supervision of enterprises and industrial projects to ensure compliance with environmental regulations and standards. It should increase the supervision of pollutant emissions, strengthen environmental governance, and reduce pollutant emissions.
5. Shaanxi and Shanxi, as two major energy provinces with developed heavy industries, have seen a decrease in the synergy between the environment and industry, thus requiring industrial transformation. Both provinces should vigorously develop the tourism industry and supporting industries. Additionally, Shaanxi has numerous universities and abundant talent resources, so it should focus on developing high-tech environmental protection industries.
6. Henan and Shandong, both populous provinces, had significantly higher synergy between environment and industry in Shandong in 2021. Henan has a higher level of agricultural and industrial development, with industries mainly including metallurgy, machinery manufacturing, chemical industry, and building materials, which have caused significant pollution to the environment. On the other hand, Shandong has made good progress in the electronic information industry, marine industry, and new energy industry. Therefore, Henan urgently needs industrial transformation, while Shandong can optimize production processes, improve resource utilization efficiency, promote circular economy models, and minimize waste generation while maintaining its existing industries.
The shortcomings and prospects. This article only considers synergy issues within the environmental system and the industrial system without taking into account the external factors that affect synergy, such as the economy, society, and technology. Therefore, in the future, it is possible to further expand on this research and explore the impact of external factors on the synergy between the environment and industry.

