

Introduction
Effectively driving the transformation of the manufacturing industry towards sustainable production and accu-rately evaluating the impact of corresponding strategies have gained significant importance in a world striving for carbon neutrality and sustainable development. This is particularly crucial in rapidly developing industrial na-tions that thirst for sustainable growth.
In the past years, the manufacturing sector in China has achieved notable success in bolstering rapid economic progress, emerging as a vital cornerstone of the country’s economy. Nonetheless, it has concurrently presented substantial ecological and environmental dilem-mas [1, 2], including resource depletion, environmental pollution, and the greenhouse effect. According to BP’s Statistical Review of World Energy1, China accounts for 26.5% of global energy consumption, with the manufacturing industry responsible for two-thirds of the energy consumed in the secondary sector and one-third of the country’s energy use. In order to accomplish the objec-tives of attaining peak carbon emissions and realizing carbon neutrality, the Chinese government underscored the necessity of implementing robust measures to mitigate pollution and reduce carbon emissions in pivotal regions, all while advancing the adoption of sustainable manufacturing practices within the industrial sector. Un-der these circumstances, the manufacturing industry fac-es an urgent demand for green transformation [3, 4].
Integrating digital and information technology with conventional manufacturing is gaining paramount importance in the green transformation of the manufacturing industry (GTMI) [5, 6]. In 2018, the Chinese government introduced the concept of new infrastructure and regarded it as a strategic solution to seize new opportunities for industrial change. As per the China Development and Re-form Commission’s definition, new infrastructure encompasses a range of facilities that are closely linked to the applications of digital information networks, 5G technology, and data centers. This includes not only intelligent information infrastructure and new energy infrastructure but also the integration of information, intelligence, and green infrastructure. The technologies associated with new infrastructure, such as cloud computing, blockchain, and big data, possess eco-friendly characteristics [7], making them indispensable for the GTMI process. Therefore, it seems that the construction of new infrastructure can be seen as an important means to enhance GTMI. Nevertheless, there exists a dearth of theoretical and empirical evidence concerning how to strengthen the influence of new infrastructure on GTMI, which this study plans to address.
At the same time, the social and economic impact of new infrastructure is intricately connected to the government’s fiscal expenditure strategy and planning. Fiscal expenditure is typically categorized into productive and livelihood expenses. The productive fiscal expenditure, including transportation, resource exploration, and energy expenditures, relates to the development of economically oriented new infrastructure such as transportation, communication networks, and energy facilities. On the other hand, livelihood expenditure, encompassing public services, education, and science and technology expenditures, influences the development of socially beneficial aspects of new infrastructure, including scientific infrastructure, fundamental educational infrastructure, and industrial technology innovation infrastructure. Thus, different fiscal expenditure strategy and planning can have varying impacts on different aspects of new infrastructure
1 https://www.bp.com.cn/content/dam/bp/country-sites/ zh_cn/china/home/reports/statistical-review-of-world-energy/ 2022/bp-stats-review-2022-full-report_zh_resized.pdf construction, consequently affecting the overall outcome of new infrastructure.
Considering the pressing need to transition towards greener manufacturing, it becomes evident that there is significant research value in exploring the role of new infrastructure and fiscal expenditure structure. Firstly, the establishment and operation of new infrastructure involve high investment and energy consumption [8]. This necessitates the government to formulate construction projects and corresponding expenditure strategy and planning for new infrastructure [9]. Addressing this chal-lenge is vital for fostering fresh catalysts for sustainable green production. Although the existing literature primarily concentrates on exploring how new infrastructure affects firm productivity or regional economic growth [10, 11], limited research thoroughly examines its impact on GTMI. Given this, exploring the mechanism through which new infrastructure influences GTMI can provide theoretical and empirical evidence regarding its environmental impacts, contributing to a better understanding of the environmental outcomes associated with new infrastructure implementation. Additionally, given the ecological challenges encountered by numerous emerging economies and their ongoing infrastructure enhancement initiatives, this research can provide statistical references in terms of sustainability development and the implementation of information technology-driven infrastructure. Secondly, since local governments are responsible for implementing and funding new infrastructure, the fiscal expenditure structure may influence the impact of new infrastructure on GTMI. In other words, whether the construction of new infrastructure can lead to greener manufacturing is affected by the government’s fiscal spending preference. Consequently, there is a need for additional assessment regarding the impact of different fiscal spending decisions on the environmental impact of new infrastructure. Thirdly, considering the critical role of fiscal spending in socio-economic development, the size of fiscal expenditure can also impact the relationship mentioned above, necessitating further investigation.
In light of this, the present study seeks to investigate and resolve three issues. 1) What is the influence of new infrastructure on GTMI? 2) To what extent does the fiscal expenditure structure of the government moderate the correlation between new infrastructure and GTMI? 3) How can the scale of fiscal spending be adjusted to optimize the environmental outcomes of new infrastructure? Answering these queries can provide us with a clearer understanding of the environmental impact associated with local governments’ fiscal expenditure decisions and help to reveal the institutional factors that influence the diverse effects of green transformation brought about by new infrastructure.
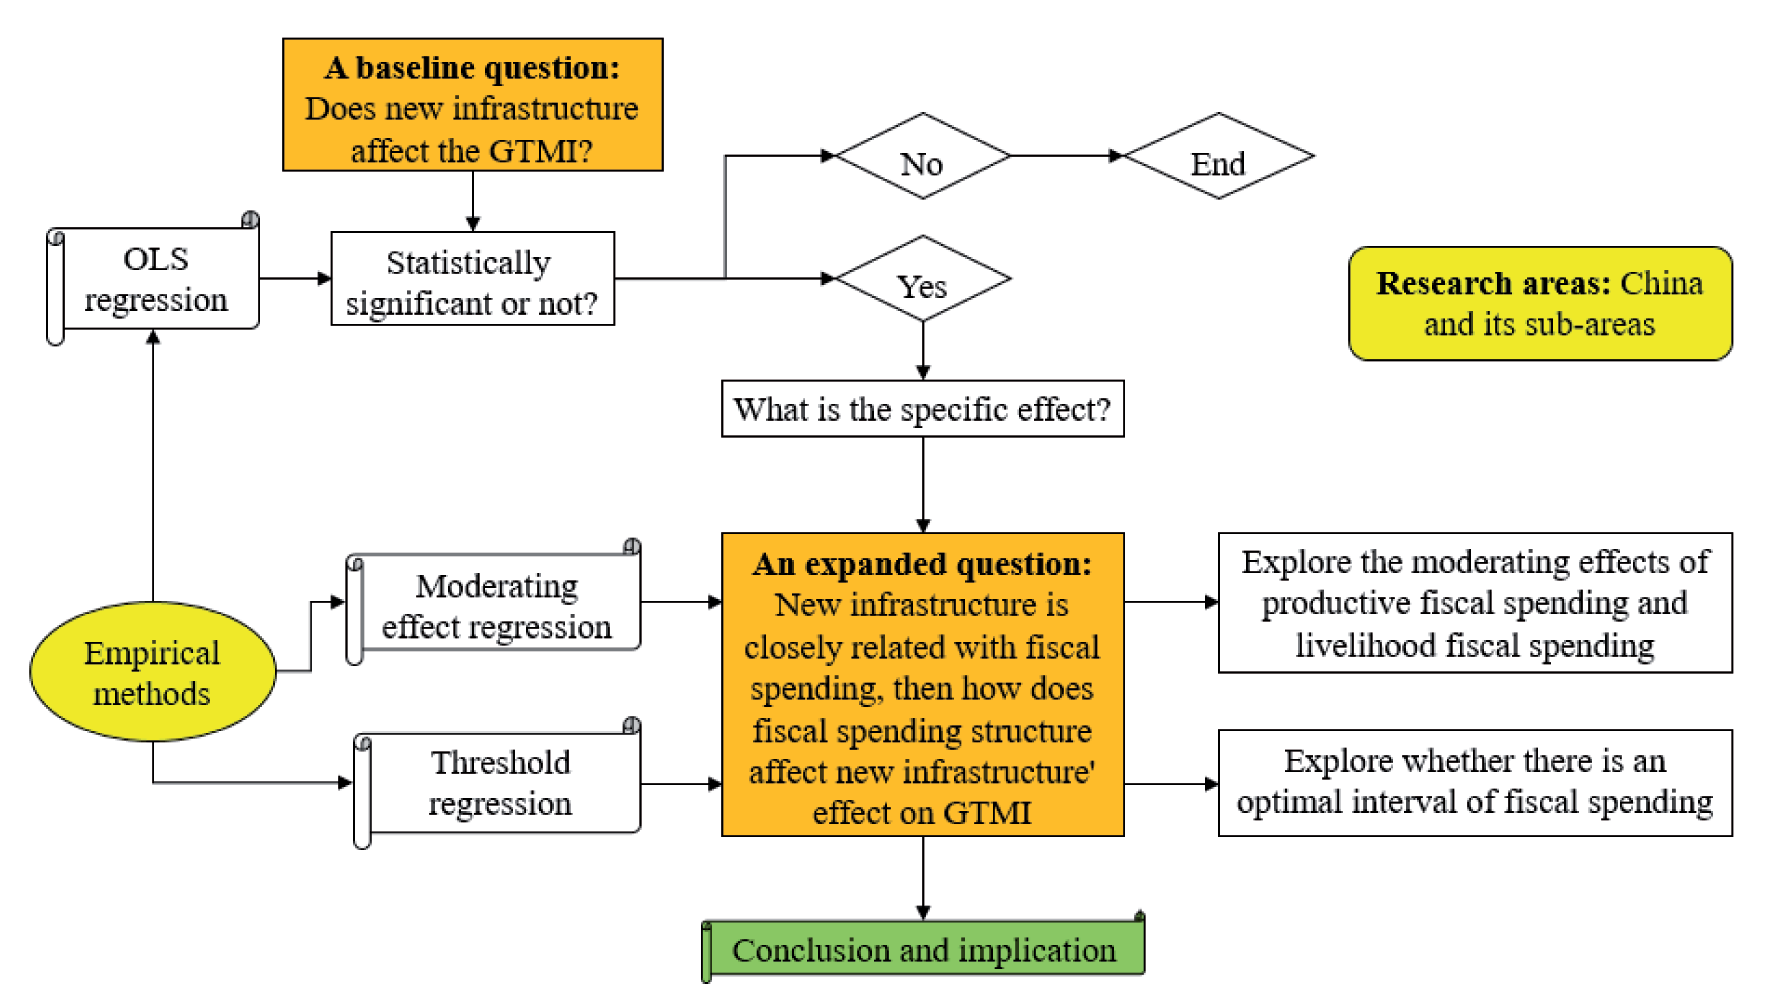
The contributions of our study lie in three aspects. Firstly, it expands on previous research by examining the influence of new infrastructure on GTMI, enriching the literature on the environmental impacts of new infrastructure, and enhancing knowledge on green manufacturing and sustainable production. Secondly, this study intro-duces government management factors into the analysis of new infrastructure by constructing a framework that incorporates new infrastructure, government fiscal expenditure structure, and GTMI. The moderating effect of fiscal expenditure structure on the relationship between new infrastructure and GTMI is explored at both theoretical and empirical levels, providing valuable insights for effectively promoting GTMI. The heterogeneity of the influence is also verified. Lastly, based on theoretical analysis, we point out that there may be an interval for the fiscal expenditure scale, allowing for a more effective moderating role for the fiscal expenditure structure. By constructing a threshold model with fiscal expenditure scale as the threshold variable, this paper identifies an appropriate range that enhances the moderating effect of fiscal expenditure, leading to a clearer and more comprehensive explanation of the diverse influence of new infrastructure on GTMI. This provides guidance for the optimization of fiscal expenditure decisions by the government, ultimately improving the environmental outcomes associated with new infrastructure. Hence, we present a logical roadmap to clearly display the key content covered in this study (see Figure 1).
The remaining sections of our study are structured as follows. Section 2 provides a comprehensive review of related literature and formulates research hypotheses pertaining to new infrastructure, fiscal expenditure structure, and GTMI. In Section 3, we delineate the research design, the choice of variables, and the data source. Empirical tests and results are presented in Sections 4 and 5, respectively. Finally, Section 6 concludes the study, offer-ing policy implications based on the findings.
Literature Review and Theoretical Analysis
A Review of Current Literature
Factors Affecting GTMI
Previous studies examining the determinants of GTMI concentrate predominantly on technological innovation. Shahzad et al. investigated how green technological innovation influences sustainable development among Pakistani manufacturing industry [12]. Deng et al. discovered that digital technologies significantly enhance green productivity gains in China’s manufacturing industry. Certain prior studies have also focused on government policies [13]. For instance, Lena et al. (2022) explored the effect of government’s green policies on environmental efficiency growth among thirteen manufacturing sectors in Italy and found that environmental regulations do not negatively impact most industries [14]. In a separate study conducted by Wang, the author examined the impacts of green finance policy on the ef-ficacy of green innovation within China’s manufacturing sector, revealing industry-specific heterogeneity [15].
Scholars are also increasingly focusing on the influence of infrastructure. Lin and Chen presented evidence indicating that the construction of economic infrastructure leads to a long-term reduction in energy intensity within China’s manufacturing sector [16]. Similar to this, Wang et al. discovered that economic infrastructure can bridge the gap in industrial energy efficiency among different provinces in China [17]. The study by Chen and Lin revealed that infrastructure advancement enhances the extent of green transformation in the manufacturing sector [18]. Other studies highlight the importance of green supply chain management [19] and global value chain [20].
Environmental Impact of New Infrastructure
Balancing economic development and ecological civilization relies heavily on the construction of infrastructure [21]. The advancement of information and digital technology has made technological infrastructure a driving force for economic growth and sustainable development. Consequently, numerous studies have been conducted to examine the environmental implications of information and network infrastructure. Tang et al. investigated how telecommunications infrastructure influences eco-efficiency [6]. Qiao et al. demonstrated how new infrastructure restrains the “growth with pollution” pattern for enterprises [22]. A similar conclusion was drawn by Zou and Pan [23] and Dong et al. [24].
Conversely, some studies found that the development of technological infrastructure could contribute to environmental pollution. For instance, the establishment of 5G base stations and the utilization of hardware equipment such as computers and TV sets can result in increased energy use [25]. Additionally, the vast amount of data can overwhelm enterprises, hindering effective management and utilization, which is detrimental to green development [9]. Moreover, research has shown that data safety uncertainty [26] as well as corporate strategic organization [27] might increase efficiency risks and impede green development.
Fiscal Spending and Green Development
There is a well-developed literature on how fiscal spending affects green development, but it mainly fo-cuses on either the overall amount or specific types of fiscal expenditures. Many existing studies have docu-mented that government’s fiscal expenditure can reduce pollution [28-31], while others suggest that it might increase environmental risks while boosting the economy [32]. With regards to the allocation of public services and goods spending, Adewuyi examined how public spending affects carbon emissions directly and indirectly [33]. López et al. predicted that increasing social and public spending would lead to a reduction in pollution [34]. Regarding R&D and educational expenditure, Lin and Zhu conducted an evaluation of the impact of fiscal expenditure on education and research and development on green economic growth in China [35]. Hua et al. identified the mitigating influence of public education expenditure on air pollution in Chinese cities [36]. Zhang et al. examined the connection between R&D spending, green economic growth, and energy efficiency using panel data from countries involved in the Belt and Road Initiative (BRI) [37]. Wei et al. investigated how R&D and education expenditure affect the green economy through the lens of green technological innovation [38]. Deng et al. found that fiscal spending can promote green productivity in agriculture [39]. Concerning fiscal policy, Lin and Zhou demonstrated that vertical fiscal imbalance does not contribute to the rationalization and upgrade of industrial structure [40]. Similarly, Li and Xu found that fiscal decentralization substantially hinders the advancement of the green economy [41].
Although the existing literature provides valuable insights, there remain several research gaps that necessitate attention. First, studies on new infrastructure and GTMI are limited. While some studies have explored the influence of information technology infrastructure on green development through the lens of policies like “broadband China”, they often focus on specific policies, lacking a comprehensive perspective. Second, government fiscal spending is the primary source of funding for new infrastructure, encompassing both productive infrastructure (for example, 5G base stations and data centers) and livelihood infrastructure (for example, science and technology innovation platforms). This poses new challenges to government’s fiscal spending decisions. Changes in the structure of government fiscal spending may significantly moderate the relationship between new infrastructure and GTMI. However, this moderating effect has not been thoroughly discussed in the literature.
In this way, this paper first formulates an indicator system to evaluate the new infrastructure development across different provinces, on which its spatial-temporal characteristics are analyzed. Second, we introduce the factor of government fiscal expenditure structure and construct a theoretical analysis framework that includes new infrastructure, government fiscal expenditure structure, and GTMI. Drawing on the framework, new infrastructure, fiscal expenditure structure, and GTMI are discussed, on which the appropriate fiscal expenditure scale that optimizes the moderating role of fiscal expenditure structure is explored. Third, building upon the theoretical analysis, we construct a benchmark regression model to examine the influence of new infrastructure on GTMI. Fiscal expenditure structure is introduced as a moderating variable to investigate its influence on the relationship between new infrastructure and GTMI. The panel threshold model is constructed to determine the appropriate scale of fiscal expenditure that optimizes the moderating effect of fiscal expenditure structure.
Theoretical Mechanism of New Infrastructure and GTMI
The direct effect of new infrastructure on GTMI can be categorized into two aspects. Firstly, it has a green investment effect. In essence, new infrastructure can be regarded as a fixed asset investment in infrastructure construction. According to the investment multiplier theory, the multiplier effect of fixed asset investment can expand market size, boost demand, and effectively stimulate economic growth. Unlike traditional infrastructure investment, new infrastructure encompasses 5G, artificial intelligence, industrial internet, smart cities, and other investments closely related to green development. It can guide enterprises in adopting cleaner, greener, and more sustainable practices in production organization, resource allocation, product form, and business models, thereby encouraging enterprises’ green innovation [42], and providing new impetus for green development.
Secondly, new infrastructure has a technological spillover effect. The advancement of new infrastructure promotes the widespread application of next-generation technologies such as cloud computing, Internet of Things, and blockchain. Also, digitalized knowledge and technology elements can be disseminated rapidly across larger geographic areas [43], overcoming spatial boundaries for the optimal allocation of innovation factor and resource. Furthermore, the establishment of data sharing platforms reduces information acquisition costs and facilitates information exchange between innovation supply and demand sides, which not only breaks the information barriers [44], but also enhances collabora-tion among industry, academia, and research institutions across different innovation subjects. This promotes en-hanced levels of technological advancement and fosters the exploration and growth of eco-friendly technology. Considering the aforementioned examination, we put forth hypothesis 1: H1: New infrastructure is conducive to GTMI.
Differences in geographic location, technology advancement, factor allocation, and local policies across different parts of China lead to significant variations in investment levels, development stages, and demand for new infrastructure. Hence, the impact of new infrastructure on GTMI can vary significantly due to these disparities. Some suggest that eastern provinces, with their abundant capital, technology, talent pool, and industrial base [45], possess favorable conditions for implementing new infrastructure. Such conditions promote the positive impacts of green transformation associated with this infrastructure development. Furthermore, the extent of the information infrastructure dividend is closely tied to the digital literacy level of users [22]. The value of this dividend cannot be effectively realized without adequate support from skilled personnel. Given this, we propose hypothesis 2: H2: Significant variations exist in the correlation between new infrastructure and GTMI across different regions.
According to the fiscal decentralization theory, the fiscal spending preferences of local governments have a vital influence on economic activity and environmental quality [46]. Specifically, social and public goods expenditure may induce the scale, composition, and technique effects [34], while constructive expenditure tends to gen-erate short-term scale effects and attract more investment [38]. Based on the classification of new infrastructure; transportation, communication networks, energy, and other facilities are associated with productive fiscal expenditure and possess distinct economic attributes. Science and technology platforms, education facilities, and industrial information platforms [47], on the other hand, are associated with livelihood fiscal expenditure and have obvious public welfare attributes. When the government increases the share of productive fiscal spending, improving transportation, communication networks, energy facilities, and other infrastructure can produce two effects. Firstly, enterprises can reduce operating costs through infrastructure sharing, enhancing resource utilization and efficiency and facilitating GTMI. Secondly, increased economic activities resulting from infrastructure construction may lead to congestion and energy rebound effects, which could potentially hinder GTMI. Similarly, when the government increases the proportion of livelihood fiscal expenditure, improvements in science and technology platforms, education facilities, and industrial information platforms can enhance the technology spillover effect. This promotes the application of clean technology and accelerates the green transformation process of firms. However, regions with weaker human capital face challenges in utilizing science and education infrastructure due to their higher requirements for human capital accumulation. Considering the differences in industrial base and fiscal expenditure structure among geographic regions, it is reasonable to assume that this moderating effect varies across different regions. Therefore, we propose hypothesis 3: H3: Fiscal expenditure structure plays a moderating role in the connection between new infrastructure and GTMI, and this moderating effect may have regional heterogeneity.
The existing study highlights the significant role of fiscal spending in green development. For instance, Wang and Shao discovered a positive correlation between R&D expenditures and green growth in G20 countries [48]. Lin and Zhu examined the effects of fiscal spending on green economic growth, specifically focusing on the composition and technique effects [35]. However, it should be noted that the impact of fiscal spending can be intricate and may not follow a linear pattern. Sheremirov and Spirovska identified the threshold effect of fiscal multipliers [49]. One possible explanation for this complexity is the close relationship between the size and impact of fiscal expenditure. In other words, the fiscal spending impact might depend on its scale. For instance, an expansion in the scope of fiscal allocation towards enhancing people’s livelihoods signifies a heightened emphasis on improving their quality of life and may have a more pronounced impact on new infrastructure. Nevertheless, it is noteworthy that a higher scale of fiscal spending does not necessarily result in a stronger positive effect. Tang et al. demonstrated that if the government’s R&D spending exceeds the capacity of local innovation infrastructure, its positive impact may reduce [50]. Therefore, it is reasonable to assume that there exists an appropriate range for the fiscal spending scale that allows the moderating effect of the fiscal expenditure structure to be more effective. Moreover, since the scale and structure of fiscal spending vary across geographic regions, it is likely that this appropriate range differs among different regions. Therefore, we propose hypothesis 4. H4: The fiscal spending scale has a threshold effect on the moderating effect of fiscal expenditure structure, and this threshold effect may have regional heterogeneity.
Material and Methods
Model Construction
(1) Based on the above discussion, we developed the following regression model to examine the impact of new infrastructure on GTMI:
where i and t denote province and time,
(2) Considering that the fiscal expenditure structure may affect new infrastructure development and its influence on GTMI, we construct the following moderating effect models to explore the relationship:
LGOV stands for the proportion of livelihood fiscal spending and PGOV stands for the proportion of productive fiscal spending.
(3) The threshold panel model is constructed in line with Hansen’s approach [51], based on equations (2) and (3). The threshold variables, per capita livelihood fiscal expenditure (perLGOV) and per capita productive fiscal expenditure (perPGOV), are employed to gauge the respective scales of fiscal spending. The expressions for the single threshold model are as follows:
perLGOV and perPGOV represent per capita livelihood-based fiscal expenditure and per capita production-based fiscal expenditure. By doing so, our study tries to investigate the optimal range of fiscal expenditure that enhances the moderating effects discussed above.
Variables and Data
Dependent Variable
To gauge GTMI, we selected Total Factor Energy Efficiency (TFFE) as the dependent variable within the manufacturing industry. Following the existing literature, we employed the Data Envelopment Analysis Model [52] incorporating undesirable outputs to calculate TFFE and assess GTMI in each province. First, we define the model for n Decision-Making Units (DMUs), where k represents a specific DMU:
(6)
X is the input matrix;
Next, we specify the input and output indexes. For input indexes, we consider labor (L), capital investment (K), and energy consumption (E). For labor input, we quantify it using the average workforce in the manufacturing industry (10,000 individuals). Capital investment input is assessed based on the amount of fixed asset investment in the manufacturing industry (in billions of RMB). Energy input is determined by total industrial energy consumption (in million tons of standard coal). The level of capital investment input is adjusted through the perpetual inventory method. Desirable output is measured by revenue from the main business activities in the manufacturing industry (in billions of yuan). On the other hand, undesirable output indicators include chemical ox-ygen demand (COD) emissions from industrial wastewa-ter (in million tons), SO2 emissions (in million tons), and the generation of industrial solid waste (in million tons).
Key Explanatory Variable
This study selects the development level of new infrastructure (INF) as the key explanatory variable. From the previous papers, scholars have not reached a consensus on the method to assess new infrastructure. Some utilize capital stock to assess the intensity of new infrastructure investment, while others construct indicator systems to gauge its development level. In this paper, after rigorous consideration based on the works of the existing studies [10, 22, 53], we build an indicator system, which is characterized by informatization (intelligence) and innovative, to represent the “new” infrastructure. Informatization is closely linked to the latest generation of information technology, etc. Innovative primarily pertains to platforms that support scientific and technological research and development. For evaluating the weight of the indicator system, we utilize the entropy weight method [54, 55], and the specific indicators can be found in Table 1.
Based on the indicator system, the INF of each province IS calculated. During the analysis period, INF for the whole sample increased from 2.29 to 2.72, with an average growth rate of approximately 2.84%. The INF in the three sub-regions in China, the eastern, central, and western regions, is also assessed. The INF in the eastern region exhibited the highest value, increasing from 2.71 to 3.72, indicating an average growth speed of 2.06%. Following that, the central region experienced growth from 2.39 to 2.86, with an average growth rate of about 2.59%. The INF in both the eastern and central regions surpassed those of the overall sample. Meanwhile, the western region had the lowest INF, increasing from 1.82 to 2.38, with an average growth rate of 3.92%. Figure 2 displays the INF at both the national and regional levels.
Table 1.
The indicator system of new infrastructure
Moderating Variable
Based on the above analysis, fiscal expenditure structure is selected as the moderating variable. Fiscal expenditure can be classified into livelihood expenditure and productive expenditure based on its purpose [38]. To obtain specific expenditure items, this paper refers to the National Bureau of Statistics and conducts a classification. The specific classification is revealed in Table 2.
Regarding the categorization above, we introduce two moderating variables: the proportion of livelihood expenditure (LGOV), which is computed by dividing livelihood expenditure by total fiscal spending, and the proportion of productive expenditure (PGOV), determined by dividing productive expenditure by total fiscal spending.
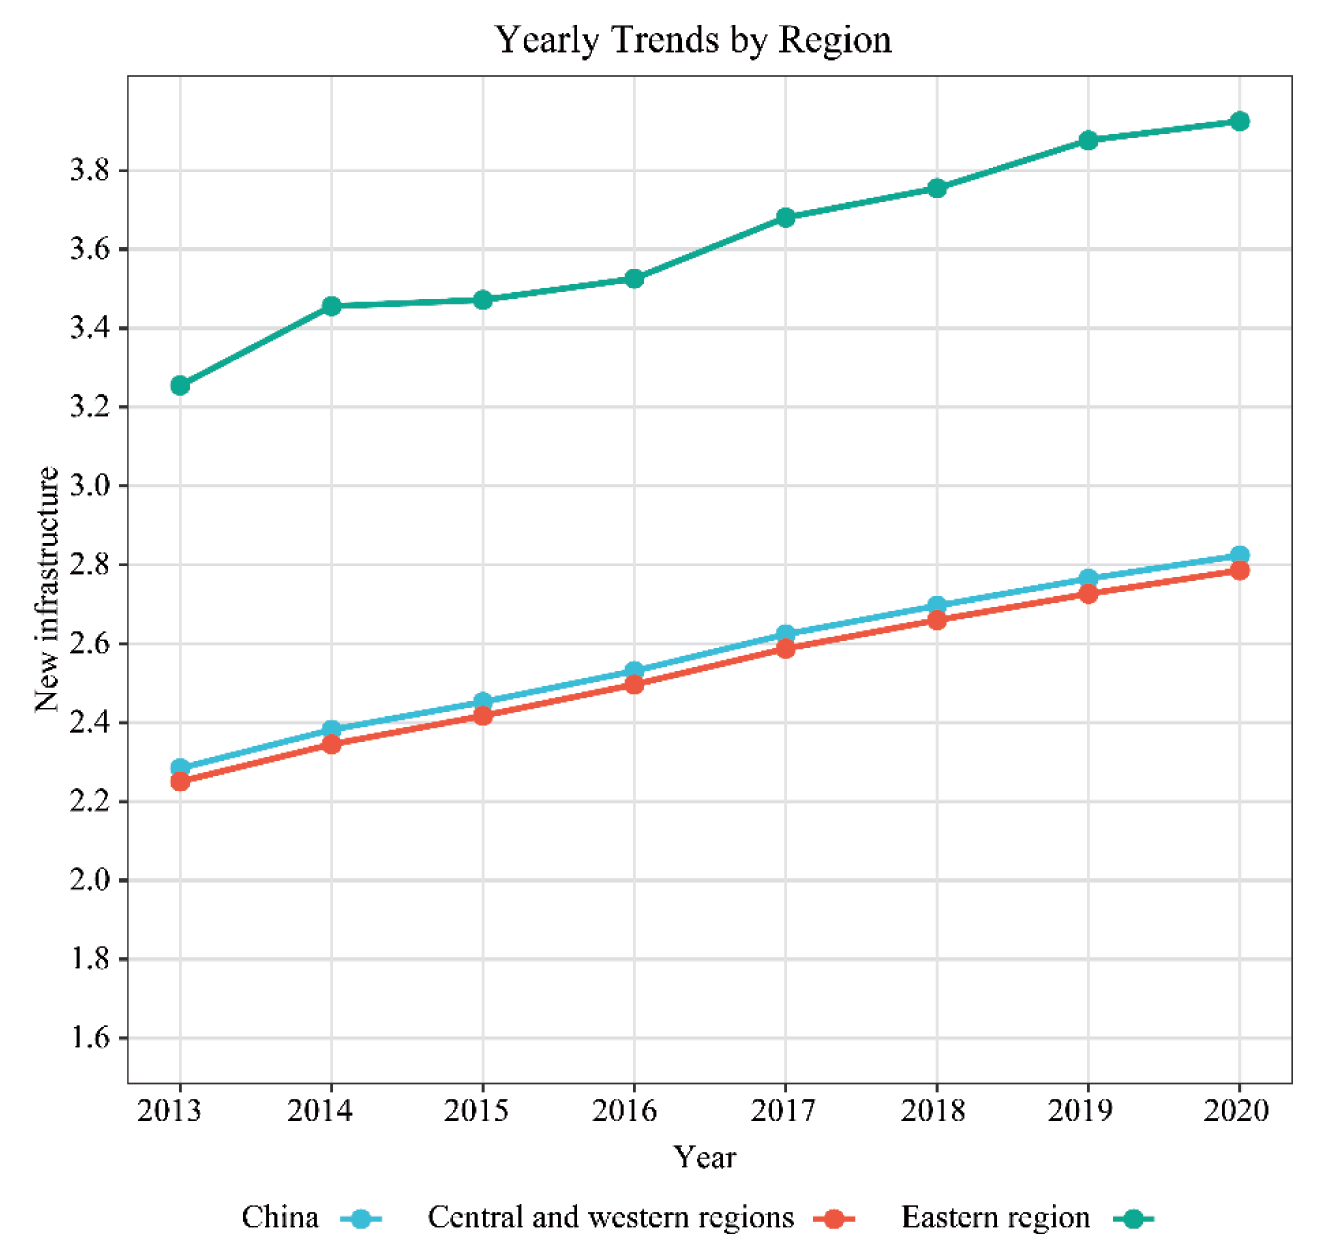
Table 2.
Classification of financial expenditure
Control Variables
Referring to the existing study [7, 18, 22], we introduce a set of control variables that may influence GTMI, specifically: openness to the outside world (FOR), calculated as the ratio of total investment in foreign-invested enterprises to GDP; technological progress (TEC), measured by the number of patents granted for inventions; level of financial development (FIN), represented by the year-end balance of loans from financial institutions to GDP; level of economic development (ECO), measured by regional GDP; and environmental regulation (ENV), which is computed by dividing the completed investment in industrial pollution control by the value added of secondary industry.
Data
Our research sample consists of 30 provinces in China, with Tibet, Hong Kong, Macau, and Taiwan excluded because of limited data availability. The study period spans from 2013 to 2020. Data is mainly collected from the National Bureau of Statistics of China and other rele-vant statistical yearbooks. Price-related series have been adjusted to the constant 2013 price to filter out the price difference. Missing data issues are addressed using the linear interpolation method. The descriptive statistics of the variables are presented in Table 3.
Results and Discussion
Baseline Estimation Results
In this section, the impact of new infrastructure on GTMI is examined, and Hypothesis 1 is tested. Table 4 reports the estimated results of this impact. The null hypothesis is rejected by the Hausman test at a significance level of 1%, which indicates the acceptance of a fixed effects model.
Column (1) shows the effect of new infrastructure on GTMI without control variables. The estimated coefficients of INF are significantly positive, suggesting that new infrastructure exerts a positive influence on GTMI and is able to move the manufacturing industry towards green and sustainable production. This positive relationship remains robust after introducing various control variables, as shown in columns (2) and (3), supporting Hypothesis 1. According to the estimated coefficient of INF in column (3), a 10% increase in the level of new infrastructure improves GTMI by approximately 1.67%, highlighting the impetus new infrastructure brings to GTMI. This observation is consistent with previous works noting that the construction of information or telecommunications infrastructure can enhance environmental efficiency [7, 23, 56]. A possible explanation is that increased investment in new infrastructure coincides with the proliferation of new generation technologies, including the big data, blockchain, and the industrial internet. These technologies not only promote manufacturing process intelligence [22], but also deepen the integration between industries and new technologies. Consequently, industrial development moves in a more intensive and environmentally friendly direction, leading to stronger energy-saving and emission reduction effects.
Robustness Checks
Since new infrastructure, the key explanatory variable in our study, is measured by a comprehensive index, potential endogeneity issues due to measurement bias may arise. Additionally, while our model controls for factors such as economic development and environmental regulations that affect GTMI, other potential influencing factors excluded from the model may also interfere with the results. To address these concerns, we perform three robustness tests: variable substitution, instrumental variables method, and removal of extreme values. The findings are presented below.
Table 3.
Descriptive statistics of variables
First, we adjust the parameter settings of the SBM-DEA model, changing its orientation to output-oriented and allowing for variable returns to scale. We then re-measure GTMI and report the estimation results in columns (1) and (2) of Table 5. Next, we estimate the model using the two-stage least squares estimation (2SLS) with the one-period lagged term of new infrastructure as the instrumental variable, and our corresponding result is given in column (3). Then, to minimize the potential impact of outliers on the model outcomes, this study re-estimates the model using a trimmed dataset that excludes the top and bottom 5% of observations. The result is displayed in column (4).
The findings presented in Table 5 indicate that after rigorous robustness tests, the positive impact of new infrastructure remains significant, providing further evidence of the robustness of the baseline estimation results.
Heterogeneous Analysis
Considering the varying economic foundations across various regions of China, the stages, modes, and effects of new infrastructure may differ significantly. As a result, significant heterogeneity can arise regarding the influence of new infrastructure on GTMI across these regions. To investigate these heterogeneous effects, we divide the sample into two parts according to geographic locations: the eastern region, and the central and western regions. Subsequently, this study estimates the model using these subsets and displays the outcomes in Table 6.
The outcomes from the first two columns indicate that new infrastructure can promote GTMI in both sub-samples, but there exists substantial differences in the extent of the influence. In the eastern region, the estimated coefficient of INF is 0.4243, significantly exceeds that in the remaining regions (0.0572). This finding implies that the advancement of new infrastructure in the eastern region exerts a more substantial influence on promoting GTMI, consistent with previous findings, thus verifying Hypothesis 2.
One possible reason for this regional difference is that the eastern region is economically more developed, with a solid manufacturing foundation and abundant talents and innovation resources [57]. Enterprises in this region possess greater capability to absorb advanced technology and management experience [24], and they can use the data resources and innovation platforms facilitated by the development of new infrastructure for technological upgrading and equipment renovation, thus improving energy utilization efficiency and reducing pollution emissions. In contrast, the central and western regions are catch-up economies, characterized by limited scientific and educational resources and a relatively weaker capacity to attract innovative talents. Although new infrastructure accelerates network spillover and spatial diffusion of data and information knowledge, manufacturing enterprises still face internal challenges hindering their transformation. These obstacles stem from limitations such as economic scale, resource availability, and industrial foundation, resulting in insufficient motivation for change. Thus, the green transformation effect of new infrastructure is relatively weak in these regions. Another possible explanation relates to significant disparities in the development index of new infrastructure between developed and less developed regions. As discussed in Section 3.2, the level of new infrastructure development exhibits distinct spatial differentiation characteristics. The new infrastructure development index in the eastern coastal region significantly surpasses that in inland areas, indicating that new infrastructure in the eastern region is more developed. Consequently, the effect of new infrastructure on GTMI might be more pronounced in the eastern region.
Table 4.
Baseline model
Further Discussion on the Role of Fiscal Expenditure Structure
The Moderating Effect of Fiscal Expenditure Structure
Whole Sample Analysis
In this section, we employ the hierarchical regression method to investigate how the composition of fiscal spending moderates the impact of new infrastructure on GTMI. We introduce fiscal expenditure structure and its interaction with new infrastructure into the model sequentially, considering both the proportion of livelihood expenditure (LGOV) and productive expenditure (PGOV), as discussed in Section 3.2. The results are given in Table 7.
The first column displays the estimation results without including government fiscal structure, while columns (2)-(3) reflect the moderating effect of LGOV. As seen in column (2), the estimated coefficient of LGOV is positive at the 10% level, indicating that increasing the share of livelihood fiscal expenditure is conducive to GTMI. In column (3), the coefficient for the interaction term IN-F*LGOV demonstrates a significantly positive effect, suggesting that an increased livelihood expenditure proportion positively moderates the relationship between new infrastructure and GTMI. In other words, a higher proportion of livelihood expenditure strengthens the driving influence of new infrastructure on GTMI. This finding partially supports Hypothesis 3. It is similar to the findings of López et al. and Hua et al. that increasing the share of public expenditure helps mitigate environmental pollution [34, 36]. A possible explanation is that a greater proportion of livelihood expenditure implies increased investment in public services, education, and science and technology, which will facilitate the construction of science and technology innovation (STI) platforms and the accumulation of human capital. STI platform construction is a crucial aspect of new infrastructure, and achiev-ing green transformation through new infrastructure necessitates skilled personnel. Therefore, a higher share of livelihood expenditure will release the green transformation role of the new infrastructure more effectively.
Columns (4)-(5) of Table 7 explore the moderating effect of PGOV. According to column (4), the estimated coefficient of PGOV demonstrates a negative effect at a significance level of 5%, suggesting that an increased share of productive expenditure has an adverse impact on GTMI. As indicated by the estimation findings in column (5), the coefficient for the interaction term INF*PGOV reveals a negative impact at a significance level of 1%. This suggests that an increased allocation towards productive expenditure adversely moderates the association between new infrastructure and GTMI. In other words, when a greater proportion of expenditure is allocated towards productive activities, it diminishes the influence of new infrastructure on GTMI. This finding is similar to some previous studies suggesting that digital transformation in traditional industries increases energy demand [58]. A possible reason for this is that an increased share of productive expenditure contributes to information infrastructure development and traditional transportation infrastructure upgrades, which intensify the demand for computing power and result in substantial energy consumption when stimulating economic growth. As enterprise production technology and equipment cannot be im-mediately updated, substituting energy factors is offset by the accelerated energy demand, stemming from increased output size, triggering the energy rebound effect [59, 60], and eventually leads to higher energy intensity.
Table 7.
The moderating effect of fiscal spending structure
Sub-Samples Analysis
Furthermore, due to variations in the development level of new infrastructure and the manufacturing industry across regions, there may be regional differences in the moderating effect of fiscal expenditure structure. To address this, we partition the dataset into two distinct regions, similar to Section 5.3, to identify the moderating effect of fiscal expenditure structure separately. The results are presented in Table 8.
Columns (1)-(4) of Table 8 display the estimation results for the eastern region. As shown in columns (1)-(2), both the estimated coefficients of LGOV and the interaction term INF*LGOV are significantly positive, suggesting that increasing livelihood expenditure positively moderates the connection between new infrastructure and GTMI. Meanwhile, columns (3)-(4) reveal that the share of productive expenditure negatively moderates the relationship between new infrastructure and GTMI.
The estimation results for the central and western regions, as depicted in columns (5)-(8) of Table 8, demon-strate notable distinctions compared to those observed in the eastern region. According to columns (5)-(6), the estimated coefficient of LGOV is insignificant, and the interaction term is negatively significant, suggesting that the share of livelihood expenditure negatively moderates the relationship between new infrastructure and GTMI. Meanwhile, as depicted in columns (7)-(8), a larger share of productive expenditure strengthens the driving effect of new infrastructure on GTMI. Hypothesis 3 is again verified.
Table 8.
The moderating effect of fiscal spending structure in different regions
This regional disparity could potentially stem from the fact that the manufacturing sector within the eastern region has a solid foundation and is transitioning toward quality upgrading, where technological innovation and spillover play crucial roles. Increasing the share of livelihood expenditure facilitates the construction of major scientific and technological infrastructure, scientific and educational facilities, and industrial research platforms. This promotes the spatial diffusion of knowledge and technology [23], providing vital support for technological advancements and product innovation within manufacturing enterprises. Consequently, this can accelerate their green transformation. In addition, public innovation platforms and database resources can address information asymmetry issues during enterprises’ R&D and innovation processes [9, 61]. This allows enterprises to respond quickly to market demand changes and make informed R&D decisions based on publicly available data, improving the efficiency of technological innovation and reducing resource waste. In contrast, the central and western regions have a relatively weaker manufacturing foundation with scattered distribution. Therefore, there is an urgent need to reduce energy consumption per unit of output by expanding scale effects and sharing facilities. Increasing the share of productive expenditure accelerates the construction of information infrastructure and upgrades traditional infrastructure, thereby supporting GTMI in these regions. Moreover, the less-developed regions face challenges such as limited human resources and a weak internet foundation [7], which hampers the effective spillover effect of STI infrastructure.
The Appropriate Interval for Fiscal Expenditure Scale
Whole Sample Analysis
According to the theoretical analysis conducted in Section 2, there might exist appropriate ranges for fiscal spending scale that enhance the moderating effect of the fiscal expenditure structure. To verify this hypothesis, we construct a panel threshold model to identify the appropriate fiscal expenditure scale interval for optimizing the moderating effect. The per capita fiscal expenditure scale is considered the threshold variable, and the interaction term between new infrastructure and fiscal expenditure structure is introduced as the core variable. We perform a grid search to determine the ranges of thresholds and evaluate the statistical significance of the threshold effect by 500 bootstrap replications. Table 9 and Table 10 display the analysis outcomes for the tests with per capita livelihood expenditure (perLGOV) and per capita productive expenditure (perPGOV) as the threshold variables, respectively.
From Table 9, it is evident that the F-statistics for a single threshold exhibit significant results at the 5% level, while the F-statistics for double and triple thresholds are not statistically significant. This indicates the presence of a single threshold effect when per capita livelihood expenditure is treated as the threshold variable.
Similarly, Table 10 shows that the single threshold effect of per capita productive expenditure is significant at the 1% level. Conversely, the F-statistics for double and triple thresholds do not yield significant results. This con-firms the existence of a single threshold effect, with per capita productive expenditure as the threshold variable. Thus, Hypothesis 4 is supported. Based on these findings, we construct the single threshold model using perLGOV and perPGOV as the threshold variables, respectively.
Table 11 reports the estimation results of the single-panel threshold model. Column (1) in the table reflects the change in the moderating effect of LGOV when per capita livelihood expenditure serves as the threshold variable. Significance at the 5% level is observed for the coefficient of the interaction term INF*LGOV, with an estimated value of 0.0566, when the value of perLGOV falls below the threshold. On the other hand, when the value of perLGOV exceeds the threshold, the coefficient for INF*LGOV is positively significant at the 1% level, with an estimated value of 0.0848. This result indicates that the positive moderating role of LGOV strengthens as the scale of livelihood expenditure grows. The threshold value is determined to be 3727 yuan/person, suggesting that the positive moderating effect becomes stronger once per capita livelihood expenditure surpasses 3727 yuan/ person. With the increase in the share of per capita livelihood expenditure, innovation infrastructure has been improved, effectively compensating for the high costs and information asymmetry risks associated with green innovation activities by enterprises [57, 61]. This positive moderation enhances the relationship between new infrastructure and GTMI. For instance, with the popularity of new infrastructure, some developed cities have started integrating new infrastructure into smart city construction scenarios, proposing smarter and greener solutions to meet industrial transformation demands, such as es-tablishing smart innovation pilot zones and building data sharing platforms.
Table 9.
Bootstrap tests of the threshold effect with perLGOV as the threshold variable
Table 10.
Bootstrap tests of the threshold effect with perPGOV as the threshold variable
Table 11.
Results on the threshold panel model
Column (2) in the table reflects the change in the moderating effect of PGOV when per capita productive expenditure is the threshold variable. As revealed in the estimation results, when the value of perPGOV is below the threshold, the interaction term INF*PGOV exhibits a significantly negative impact, with an estimated value of -0.1021. Moreover, when the value of perPGOV exceeds the threshold, INF*PGOV remains significantly negative at the 1% level, with an estimated value of -0.1890. This indicates that as the scale of productive expenditure continues to expand, the negative moderating effect of PGOV becomes stronger. The threshold value is 13242 yuan/person, implying that the negative moderating effect enlarges once per capita productive expenditure exceeds this threshold. This finding is in accordance with previous studies suggesting that excessively high government spending on local innovation infrastructure may hinder green innovation [50]. With increasing productive expenditure, information infrastructure will be improved and traditional infrastructure will be upgraded. However, the establishment of various network and computing in-frastructures, such as data centers and Industrial Internet, can lead to significant energy consumption in both up-stream and downstream manufacturing industries, inhib-iting green transformation.
Recently, China has approved the Project for Chan-neling Computing Resources from the East to the West, aiming to develop a network of eight national computing hubs and establish ten clusters of national data centers within the western provinces [43]. This initiative aims to bridge the gap in computing resources between the eastern and western regions. The western regions, which are abundant in resources, have the potential to support the development of data centers and meet the data computing demands of the eastern regions. However, as data center construction progresses in western provinces like Gansu, Guizhou, and Ningxia, electricity consumption continues to rise. It is estimated that electricity consumption reached approximately 270 billion kWh in 2022, exceed-ing the annual power generation capacity of two Three Gorges power stations, highlighting the urgent need to improve energy utilization efficiency.
Sub-Samples Analysis
The previous section confirmed significant regional disparities in the moderating effect of fiscal expenditure structure. To further investigate whether the threshold effect of the fiscal spending scale varies by region, we construct panel threshold models separately for the eastern, central, and western regions. The findings are re-ported in Table 12.
The first two columns display the changes in the moderating effects of fiscal expenditure structure in the eastern region when perLGOV and perPGOV are used as threshold variables. In column (1), when perLGOV is below the threshold value, a significant coefficient is observed for INF*LGOV. When perLGOV exceeds the threshold, the coefficient for INF*LGOV becomes positive at the 5% level. This suggests that the positive moderating effect of the share of livelihood expenditure is only effective when livelihood expenditure exceeds a certain scale. The threshold value is determined to be 3688 yuan/person, suggesting that the positive moderating effect strengthens when per capita livelihood expenditure is greater than 3688 yuan/person. As for column (2), an observed negative coefficient is significant at the 5% level for INF*P-GOV when perPGOV falls below the threshold value. When perPGOV exceeds the threshold, the coefficient for INF*PGOV is negatively significant at the 1% level, and the impact is substantially stronger. The threshold value is determined to be 15840 yuan/person, implying that the negative moderating effect enlarges when per capita productive expenditure is over 15840 yuan/person.
Columns (3)-(4) in the table present the changes in the moderating effects of fiscal expenditure structure in the central and western regions using perLGOV and per-PGOV as the threshold variables. According to column (3), when the value of perLGOV is below the threshold, the coefficient for INF*LGOV demonstrates a negative direction, but it lacks statistical significance. When the value of perLGOV is above the threshold, the coefficient for the interaction term becomes significantly negative. This suggests that the negative moderating effect of fiscal expenditure structure amplifies as the size of livelihood expenditure increases. The threshold value is determined to be 6529 yuan/person, indicating that the negative moderating effect strengthens when per capita livelihood expenditure is greater than 6529 yuan/person. With regard to column (4), when perPGOV is below the threshold, the coefficient for INF*PGOV is positive and insignificant. When the value of perPGOV is above the threshold, the coefficient of the interaction term becomes significantly positive at the 1% level. These results indicate that as the size of productive spending increases, the positive moderating effect of fiscal expenditure structure in the central and western regions is becoming more apparent. The threshold value is determined to be 8620 yuan/person, which means that when per capita productive expenditure is over 8620 yuan/person, the negative moderating effect strengthens.
Table 12.
Results on the threshold panel model for different regions
Conclusions and Policy Implications
Main Findings
The recent surge in new infrastructure has sparked considerable attention. To ensure the scientific implementation of new infrastructure construction while prioritiz-ing ecological civilization development, it is crucial to assess its environmental impact on GMTI and examine the role of fiscal expenditure structure. This study constructs an analytical framework that incorporates new infrastructure, government fiscal expenditure structure, and GTMI, and discusses the influence of new infrastructure and fiscal expenditure structure on GTMI at a theoretical level. We then empirically investigate how new infrastructure influences GTMI, along with the moderating impact of fiscal expenditure structure. Additionally, we explore the suitable range for the fiscal spending scale that optimize the green transformation impact of new infrastructure. The theoretical contributions made by our study are given below:
(1) We introduce the factor of government governance into the analysis of new infrastructure’s environmental impact by linking fiscal expenditure structure with the green transformation effect of new infrastructure. We construct a theoretical framework that encompasses new infrastructure, government fiscal expenditure structure, and GTMI. Within this framework, we investigate the moderating impact of fiscal expenditure structure on the association between new infrastructure and GTMI, taking into account the potential influence of fiscal spending scale as a significant factor.
(2) This paper verifies the moderating role of fiscal expenditure structure on GTMI, observing considerable regional heterogeneity. We find substantial variations in the moderating impact of fiscal expenditure structure across regions. Therefore, it is not sensible for the underdeveloped regions to directly adopt experienc-es from the developed regions for fiscal expenditure structure transformations.
(3) Our study reveals that the fiscal expenditure scale exhibits an appropriate range, where continuous increases in specific types of fiscal expenditures may not yield positive environmental outcomes and could even have a negative impact on green transformation. Rather than pursuing continuous fiscal expansion, careful formula-tion of fiscal expenditure strategies based on local industrial foundations is imperative. These findings offer a fresh perspective for local governments to optimize fiscal expenditure decisions more effectively within the context of fiscal decentralization. The empirical findings of our study are presented below:
(1) Baseline estimation results confirm that new infrastructure has a positive impact on GTMI. Specifically, a 10% increase in new infrastructure will lead to a 1.67% increase in GTMI. Meanwhile, this effect is significantly more prominent in the eastern region.
(2) Fiscal expenditure structure exhibits a crucial moderating role in the association between new infrastructure and GTMI, with regional variations. For the entire sample, the share of livelihood expenditure positively moderates the relationship between new infrastructure and GTMI, while productive expenditure exerts a negative moderate effect. These patterns are consistent in the eastern region. However, the situa-tion in the central and western regions is exactly the opposite.
(3) The fiscal spending scale demonstrates a threshold effect on the moderating impact of the fiscal expenditure structure. As per capita livelihood expenditure keeps growing and surpasses the threshold, the positive moderating effect of livelihood expenditure on the relationship between new infrastructure and GTMI strengthens. With an escalation in the scale of productive fiscal expenditure, the negative moderating effect exerted by such expenditure becomes increasingly significant. These threshold effects also exhibit regional disparities. In the eastern region, the positive moderating effect is only evident when livelihood fiscal expenditure exceeds a certain scale, while in the central and western regions, a larger scale of productive expenditure enhances the positive moderating effect.
Policy Implications and Prospects
The conclusions of this study hold significant policy implications, which could benefit the management and planning issued in the new infrastructure and fiscal expenditure areas.
First, new infrastructure can be regarded as an important tool for improving GTMI and facilitating sustainable production. The government can facilitate the integration of new-generation information technologies, such as cloud computing and data centers, with traditional manufacturing industry through logistics, supply chain, and market services. Additionally, by providing knowledge and information support, enterprises can optimize production processes, enhance energy utilization efficiency, and implement effective pollution control measures. This expedites the transition towards sustainability within the manufacturing industry.
Second, scientifically allocating fiscal expenditure structure is critical to optimizing the green transformation effect of new infrastructure. Given the significance of government fiscal expenditure in new infrastructure investment, it is essential to consider the moderating role of fiscal expenditure structure and its regional heterogeneity in relation to the influence of new infrastructure on GTMI. As to the eastern region, increasing the share of livelihood expenditure and expediting the construction of science and technology innovation platforms will ampli-fy the technology spillover effect of new infrastructure. Regarding the central and western regions, the proportion of productive fiscal expenditure should be strengthened to support the construction of information infrastructure such as data centers and the transformation and upgrading of traditional infrastructure such as railroads, to ampli-fy the scale effect and agglomeration advantages of the manufacturing industry, and to improve energy utilization efficiency.
Third, the threshold effect of the fiscal expenditure scale should be taken into account. In the eastern region, further increasing the scale of livelihood expenditure expands the coverage of innovation infrastructure and accelerates GTMI. To promote green development and sustainable production in the central and western regions, there is a need to further enhance the scale of productive expenditure to take advantage of the multiplier effect generated by the increased investment in transportation and information infrastructure, thereby enhancing the efficiency of the manufacturing industry.
While the current study provides valuable insights into promoting GTMI for emerging economies like China, further studies are needed. To begin with, considering the substantial variations in fiscal expenditure priorities and infrastructure development across various cities, it would be beneficial to investigate the advancement of new infrastructure at the prefectural level, thus enhancing our analysis. Moreover, given the significant disparities in operational models, opportunities for government backing, and innovative endeavors within distinct industrial sectors, a more comprehensive examination of the green transformation within specific manufacturing industries becomes imperative. Future studies could focus on sub-city and sub-sector data to deepen the analysis in these areas.

