

Introduction
China has made remarkable achievements in agricultural development since its reform and opening up. China's total grain output increased from 430.7 million tons in 2003 to 686.53 million tons in 2022, achieving 19 consecutive years of growth [1]. However, in the process of rapid agricultural modernization, the large consumption of fossil fuels, the excessive use of pesticides, and the irrational use of agricultural waste have led to serious agricultural nonpoint source pollution and carbon emissions. In September 2020, China proposed the goal of "striving to achieve a carbon peak by 2030 and carbon neutrality by 2060" for the first time. Agricultural greenhouse gas emissions have accounted for approximately 17% of China's total carbon emissions for a long time. Agricultural chemicals, especially fertilizers and pesticides, are the main sources of agricultural greenhouse gas emissions [2]. Reducing agricultural carbon emissions and promoting agricultural green development are important for implementing the "double carbon" strategy.
Improving agricultural green total factor productivity (AGTFP) is the key way to realize green development. At present, research on agricultural green total factor productivity has made several achievements, mainly focusing on measuring the AGTFP. For its measurement, DEA (Data Envelopment Analysis) and SFA (Stochastic Frontier Approach) are widely used [3-5]. SFA is a parametric method, while DEA is a nonparametric method. Considering the nonangular and nonradial characteristics of the DEA model, Tone (2002) proposed the SBM standard efficiency model [6]. However, when there are more than two active units in the same period, the SBM standard efficiency model cannot sort them. For this reason, Tone (2009) further proposed the super-SBM model [7]. When considering undesirable outputs, the super-SBM model incorporating undesirable outputs is commonly used to measure AGTFP. However, in calculating AGTFP, scholars have selected different binding indicators of resources and the environment; some of them include agricultural nonpoint source pollution in the analysis framework [8], while others take agricultural carbon emissions into consideration [9]. Meanwhile, researchers have paid attention to the influencing factors of AGTFP, such as agricultural industrial structure change, environmental policy regulation, urbanization, green technology adoption, and other factors [2, 10-13], greatly enriching the research on AGTFP.
In recent years, the momentum of China's rural digitalization development has increased, and several digital technologies are being widely used in various fields of agriculture and rural areas [14]. In particular, the Internet of Things, blockchain, cloud computing, and other technologies are becoming increasingly mature and widely used, which has significantly impacted the green development of agriculture [15]. Digital technology has significant advantages in optimizing the allocation of agricultural resources, enabling the transformation and upgrading of rural industries, improving the matching efficiency of the production and marketing of agricultural products, and improving agricultural management efficiency [16]. However, few empirical studies have focused on this topic. Through researching the impact of rural digitalization on AGTFP and its underlying mechanism, the impact of rural digitalization development on agricultural green development can be effectively tested, and a theoretical reference can be provided to optimize the allocation of production factors, transform agricultural production modes, and promote agricultural green development.
Literature review shows that there have been a series of studies on the influencing factors of AGTFP, but few studies have been conducted from the perspective of rural digitalization. In addition, scholars have paid little attention to how rural digitization affects AGTFP. The study on the impact of rural digitization on AGTFP can provide enlightenment for exploring the path of agricultural green development. Therefore, the marginal contributions of this study are presented in the following aspects: First, the impact of rural digitalization on AGTFP is demonstrated through empirical analysis, which provides a new perspective for exploring the factors that may affect the green development of agriculture. Secondly, most studies focus on the impact of rural digital development on regional industrial economic development, while this study focuses on the environmental impact of rural digital development, which is conducive to expanding the scope of research on the impact of rural digital development. Thirdly, the intermediary effect and nonlinear effect of rural digitization on AGTFP are verified by using the intermediary effect model and nonlinear model, which is conducive to scientifically explaining the influence and characteristics of rural digitization on AGTFP.
Theoretical Analysis and Research Hypothesis
The Direct Effect of Rural Digitalization Development on AGTFP
The theoretical logic of how rural digitalization affects AGTFP can be summarized as follows:
First, the digital development of rural areas promotes the digitalization of the whole process of agricultural production and operation and the extension of the agricultural value chain through data information elements [17]. It creates new development models, such as digital agriculture and smart agriculture, which can reduce agricultural production risks and costs, improve production efficiency, and achieve scale economies so as to promote the high-quality development of the agricultural economy [18].
Second, digital development in rural areas can help reduce carbon emissions from agriculture. The digital upgrading of agricultural infrastructure and the refined management of production factor inputs can improve resource efficiency and reduce fertilizer, pesticide abuse, and agricultural energy consumption, so it can reduce the total agricultural carbon emissions. The dynamic monitoring of farmland soil and emissions provides decision support for ecological environment restoration and pollution prevention; as a result, the AGTFP increases in the end.
Third, the digital governance theory shows that the organic combination of digital technology application and government governance can promote the government governance model and governance efficiency [16]. So it can provide public services with lower costs, better effects, and greater efficiency for the public. Integrating environmental information with big data, such as data on air quality, river water quality, and pollution discharge, can assist in agricultural scientific decision-making so as to reduce waste and pollution, improve production efficiency, and provide policy support for green and sustainable agricultural development while improving the government's ability to regulate resources and the environment. Therefore, Hypothesis H1 is proposed: Rural digitalization development can significantly improve AGTFP.
The Mediating Effect of the Development of Rural Digitalization on AGTFP
For a long time, China's agricultural development has faced structural problems of unbalanced quality and efficiency, a narrow agricultural industrial chain, a low-end value chain, excessive reliance on fertilizers, pesticides, and resources and the environment, resulting in agricultural non-point source pollution and greenhouse gas emissions becoming increasingly prominent. Digital technology, with its strong penetration and wide coverage, is an important driving force for the dynamic change of industrial structure [14]. Digital rural development can promote agricultural scale and intensive management, improve factor allocation efficiency, and then reduce agricultural non-point source pollution and agricultural carbon emissions. Digital rural development promotes the quality and efficiency of agricultural and rural development by driving scientific and technological innovation. In agricultural production practice, there are widespread problems such as excessive fertilizer and pesticide consumption, low utilization rate of straw manure resource utilization, and low production mechanization efficiency [13]. However, technological progress represented by digital information technology is conducive to improving factor utilization efficiency, promoting carbon emission reduction, and breaking resource and environmental constraints. Therefore, this study analyzes the mediating effect of rural digitalization in promoting AGTFP from the following three aspects: scale operation effect, structure optimization effect, and technological progress effect.
(1) Effect of scale operation. With production factor constraints and the intensification of ecological environmental pollution, the family-based decentralized management model has increasingly restricted standardized agricultural production and its large-scale management [18], which also hindered the sustainable development of agriculture. The development of rural digitalization takes data elements as the cutting edge to achieve factor agglomeration, technology penetration, and mechanism innovation [17]. Through the deep integration of data information elements and traditional production factors, rural digitalization accelerates the transformation of the small farm-led decentralized management model to moderate-scale management, effectively alleviating information asymmetry. The effects of scale and resource agglomeration should be fully considered [18], and a large-scale, intensive, and green digital agricultural base should be formed. The relatively high organizational degree of moderate-scale agricultural operations promotes advanced technologies, production, and operation decisions; transforms agricultural production and operation modes; develops circular utilization modes, such as complementary agriculture and animal husbandry, combined planting and breeding, and returning straw to the field [19], promotes intelligent facility agriculture and high-standard farmland construction, meanwhile improving agricultural land utilization modes by adjusting planting structure and agricultural machinery input intensity. Energy conservation and emission reduction engineering should be achieved in agriculture. Therefore, Hypothesis H1 is proposed: Rural digitalization development increases AGTFP through scale operation effects.
(2) Effect of structure optimization. The development of rural digitalization can promote rationalizing and upgrading the industrial structure and improve the overall operation efficiency of the industrial chain, thus promoting AGTFP. China's agricultural development has long faced structural problems of unbalanced quality and efficiency, a narrow agricultural industrial chain, a low-end value chain, and excessive reliance on fertilizers, pesticides, resources, and the environment, making agricultural nonpoint source pollution and greenhouse gas emissions increasingly prominent. With its strong penetration and wide coverage, digital technology is an important driving force for changes in industrial structure [15]. On the one hand, with the support of shared data and digital technology, rural digitalization can overcome the challenges of traditional agricultural development by using digital and intelligent business platforms to effectively meet market demand, accelerate the flow of resource factors, and promote the disintermediation of agricultural production and circulation. So transaction costs and value losses in decision-making, information transmission, and product transportation are reduced [16], and the efficiency of resource utilization, pollution, and carbon emission reduction are improved, thus promoting AGTFP.
Thus, Hypothesis H2 is proposed: Rural digitalization development promotes AGTFP through the structural optimization effect.
(3) Effect of technological progress. Digital rural development can strengthen scientific and technological innovation, which can help improve the quality and efficiency of agricultural development, enhancing AGTFP. In agricultural production, there are widespread problems such as excessive fertilizer and pesticide consumption, a low utilization rate of straw manure, together with low production mechanization efficiency [12]. However, technological progress represented by digital information technology contributes to improving factor utilization efficiency, promoting carbon emission reduction, and overcoming resource and environmental constraints [18]. Digital rural development is based on data resources, modern information networks, and information and communication technologies, which can stimulate the endogenous impetus of rural development, enable agricultural scientific and technological innovation, and promote the green and low-carbon development of agricultural production [20].
Therefore, Hypothesis H3 is proposed: Rural digitalization development reduces agricultural carbon emission intensity through the effect of technological progress.
The Nonlinear Effect of RD on AGTFP
Digitalization is not only a simple enhancement of AGTFP but may have a nonlinear impact on AGTFP at different development stages [16]. In the early stage of digitalization, many resources need to be invested in technology research and development, equipment updates, personnel training, and so on. The initial costs are relatively high, and it is difficult to benefit in the short term, resulting in no significant improvement in AGTFP. With the promotion and application of digital technologies, agricultural production will gradually undergo digitalization, improving agricultural production efficiency and resource allocation. At this stage, the impact of digitalization on AGTFP gradually becomes positive. When digitalization reaches a certain level, digital technology and agricultural production are deeply integrated and penetrated, and agricultural production begins to realize comprehensive digitalization and intelligence. Digitalization has a more significant effect on improving AGTFP. The continuous improvement of AGTFP can be achieved by optimizing production processes, improving resource utilization, and promoting agricultural innovation.
Therefore, Hypothesis H4 is proposed: The impact of rural digitalization on the improvement of AGTFP is nonlinear.
Materials and Methods
Entropy Evaluation Method
In practice, there are many comprehensive evaluation methods. According to the different weights determined, there are subjective and objective weighted evaluation methods. In this study, the objective weighting method is used to determine the weight through the principle of information entropy, which can evaluate the research object objectively and accurately. To compare different methods, the entropy method is improved, and a time variable is added to make the analysis results more reasonable. The evaluation model of the improved entropy method is as follows:
(1) Index selection: with r years, n provinces, and m indicators, Xθij is the jth index value of province i in the θth year.
(2) Standardization of indicators: Because different indicators have different dimensions and units, it is necessary to standardize them:
Standardization of the positive index:
Standardization of the negative index:
(3) Determine the index weight:
(4) Calculate the entropy of the jth index:
(5) Calculate the weight of each indicator:
(6) Calculate the comprehensive score of the digital economy development level of each province:
The Super-SBM Method
Referring to the research of Tone (2010) [21], this study selected the super-SBM model, which incorporates unexpected outputs, to measure AGTFP. Here, 324 decision-making units (DUS) from 27 provinces from 2011 to 2022 were used. It supposes that the kth decision unit (j = 1, 2,..., n) has input vectors x ∈ RM, desirable output vectors yg ∈ RS1 , and undesirable output vectors yg ∈ RS2 . Additionally, the matrices X = [x1,x2,···,xn] ∈ Rm×n, Yg = [y1g,y2g,···yng] ∈RS1×n, and Yb = [y1b,y2b,···ynb] ∈RS2×n were defined. For the measured decision unit k, such as Formula (1):
(1)
In Formula (1), λ is the weight vector, si⁻, srg, and stb are slack variables;
Empirical Models
The Benchmark Regression Model
The linear relationship between RD and AGTFP is tested with a panel model. The benchmark regression model is set as Formula (2):
Where i represents the ith province and t represents the tth year, AGTFPit represents each province's explanatory variable. RDit represents the explanatory variable, α0 represents the intercept term, and ξit represents the random error term. Cit,k is the set of control variables.
The Mediation Effect Model
To verify the mediating role of operating scale, human capital, and technological progress in the relationship between RD and AGTFP, this study constructs a mediation effect model according to Baron and Kenny (1986) [21]. The test of the intermediary effect requires three steps. First, the influence of RD on AGTFP is tested, which is consistent with Formula (2). Second, the influence of RD on the mediating variable Medit is tested, as shown in Formula (3). Finally, RD and the mediating variables are included in the regression model, in which AGTFP is the explained variable, as shown in Formula (4). The specific model is set as follows:
In Formula (4), Medit represents different mediating variables, and the other variables in Formula (4) are the same as those in Formula (2).
The Threshold Effect Model
Based on the modeling idea of Hansen (2000) [23], this study constructs the following panel threshold model as Formula (5) to test Hypothesis 4:
(5)
Where the threshold variable is RD, θ is the threshold value, and β is the regression coefficient. I(·) is the indicative function, and the other variables are interpreted in the same way as in Formula (2).
Variable Selection
Explained Variable
When the super-SBM model is used to calculate AGTFP, the desirable outputs and undesirable outputs should be determined first. Since the agriculture, forestry, animal husbandry, and fishery industries differ greatly in terms of environmental pollutant discharge. In this study, the concept of agriculture is narrowly defined; that is, agriculture mainly refers to the planting industry, referring to the practice of Ma et al. (2023) [2]. The following specific indicators are selected: input indicators, including agricultural labor, land, pesticides, fertilizers, agricultural film, diesel, agricultural water, and agricultural machinery [11]. Second, the output indicators include desirable and undesirable outputs. Desirable output indicators are measured in terms of total agricultural output [10]. The undesirable agricultural output is considered comprehensively in terms of pollution measurement indicators, such as agricultural nonpoint source pollution and agricultural carbon emissions. According to the methods of West and Marland (2002) [24], the total carbon emissions caused by four main methods, namely, chemical fertilizers, pesticides, agricultural machinery power, and agricultural irrigation, were calculated. The above carbon emission coefficients are 0.90 (kg/kg) for fertilizers, 4.93 (kg/kg) for pesticides, 0.18 (kg/kw) for the total power of agricultural machinery, and 20.48 (kg/ha) for agricultural irrigation [10]. Agricultural nonpoint source pollution mainly comprises pesticides, agricultural film, and fertilizer residues. The total amount of pollution from a pollution source is obtained by taking the product of the polluting input and its pollution coefficient. According to the relevant literature, the residue coefficient of fertilizer, the loss coefficient of pesticides, and the residue coefficient of agricultural film are 0.75, 0.5, and 0.1, respectively [25].
Table 1.
Input and output indicators of agriculture.
Explanatory Variables
The level of rural digitalization development (RD) is the core explanatory variable of this study. A review of the related literature revealed that academic research on rural informatization index systems is relatively mature, while research on digital index systems is still needed. Rural informatization emphasizes the transmission and reception of information, and its index system is mainly composed of traditional information elements such as telephone sets, black and white TV, color TV, and rural mail delivery lines, while rural digitalization focuses on the informatization advances of the convenience of information acquisition and the accuracy of application.
Therefore, this study refers to the index system constructed by Wang and Ran (2022) [14], which includes modern information elements, such as the average number of mobile phones per 100 rural households, the amount of computer ownership, and the number of rural internet broadband access households, and adopts the entropy method to calculate the rural digitalization development index of each province from 2011 to 2022 to measure the level of rural digitalization development. The reason for this is that communication equipment such as computers, mobile phones, and Internet broadband serve as the material carrier to realize rural digitalization. The amount of such communication equipment indicates the level of local digital infrastructure, digital resources, and digital technology utilization, reflecting the comprehensive level of local digitalization. The data, such as the number of mobile phones per 100 rural households, the number of computers, and the number of rural internet broadband access households. Because the data on the number of rural internet broadband access households began in 2011, China's vigorous construction of rural digitalization also started this year; thus, this study takes 2011 as the research starting period.
Mediating Variables
Considering data availability, this study selects the cultivated land area under household contract management as the proxy variable of the scale management effect (scale). The transfer of contracted agricultural land management rights, socialized services, and agricultural system innovation are all ways to promote moderate-scale management. The larger the farmland area contracted by households, the greater the requirements for moderate-scale management of agriculture. The agricultural product processing industry is the core of building the whole agricultural industry chain, which is connected to the supply of raw materials in the forward direction and extended to distribution and sales in the backward direction. In this study, the main business income of enterprises above the scale of the agricultural and side-line product processing industry is used to measure the structural optimization effect (struct). Based on the practices of Chen et al. (2020) [22], this study uses the agricultural machine cultivation area, an index reflecting the degree of agricultural mechanization, to reflect the effect of technological progress (tech).
Controlling Variables
To control the influence of the agricultural development characteristics of each province on AGTFP, this study selects the intensity of financial support for agriculture (FIS), the agricultural planting structure (APS), the income gap between urban and rural residents (ING), the proportion of disaster (DIS), and the education level (EDU) as the control variables by referring to previous studies. All relevant variables and their descriptions are shown in Table 2.
Table 2.
Relevant variables and descriptions.
Data Sources and Descriptive Statistics
This study uses the data from 27 provinces in China from 2011 to 2022 for empirical analysis. Due to the lack of data from Hong Kong, Macao, Taiwan, and the Tibet Autonomous Region, these three provinces and regions are not included as research samples. In addition, the three municipalities of Beijing, Tianjin, and Shanghai were not included in the study sample because of the high degree of urbanization and the small proportion of agriculture in their economies. All data were from the China Statistical Yearbook, the China Rural Statistical Yearbook, the China Agricultural Machinery Industry Yearbook, the China Rural Operation and Management Statistical Annual Report, and the EPS database. Partial missing data were supplemented by interpolation and the mean value method. To avoid the influence of outliers on the estimation results, the data of all continuous variables were indexed 1% up or down. All data measured in monetary units were deflated with 2011 as the base period, and R language software was used for quantitative analysis and model estimation. The descriptive results of all variables are shown in Table 3.
Characteristics of AGTFP and RD in China
Characteristics of AGTFP in China
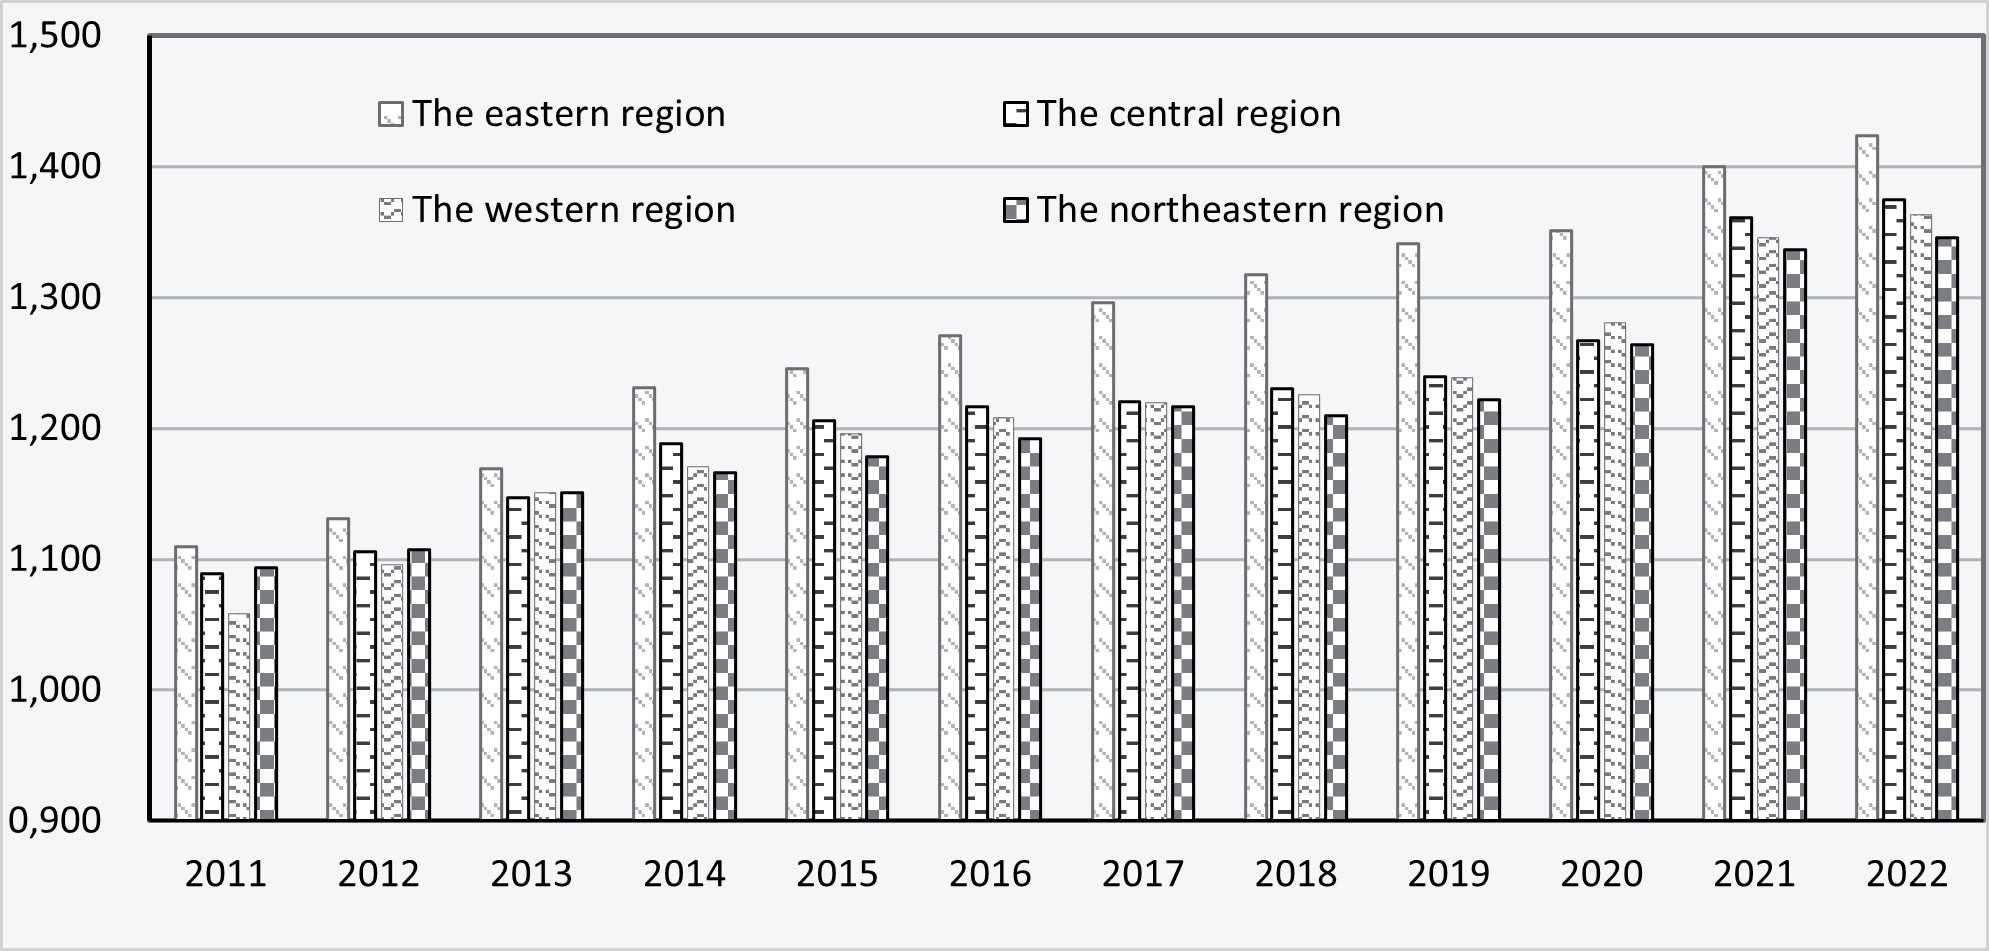
According to the results of the super-SBM calculation of AGTFP, the trends of the average annual AGTFP change of the 27 provinces during 2011–2022 are shown in Fig. 1. From 2011 to 2022, the annual average AGTFP in China fluctuated between approximately 1.087 and 1.376, reaching a maximum in 2022. During the study period, China's AGTFP showed an upward trend, with an average annual growth rate of 2.167%. The central government in China has paid more and more attention to environmental protection in recent years, and it has carried out targeted treatment of agricultural pollution. To this end, governments at all levels in China have formulated governance measures to effectively promote cleaner agricultural production technologies. From the subregion perspective, AGTFP of the four different regions was greater than 1 over the years. Additionally, the average annual growth rates of AGTFP in the eastern, central, western, and northeast regions were 2.290%, 2.142%, 2.327%, and 1.906%, respectively1. The growth rate of AGTFP in the western region was greater than that in the other regions, which may be due to the long-term underdevelopment of agricultural production in the western region. In recent years, with the introduction of advanced green production technology, AGTFP in this region has grown rapidly, while AGTFP in the northeast region has a lower growth rate and still needs to be vigorously improved. 1 This study uses the data of 27 provinces in China for em-
pirical analysis. In eastern China, there are 7 provinces: He-
bei, Jiangsu, Zhejiang, Fujian, Shandong, Guangdong and
Hainan. In central China, there are 7 provinces: Shanxi, In-
ner Mongolia, Anhui, Jiangxi, Henan, Hubei and Hunan. In
western China, there are 10 provinces: Sichuan, Guizhou,
Yunnan, Shaanxi, Gansu, Qinghai, Ningxia, Xinjiang,
Guangxi and Chongqing. In northeast China, there are 3
provinces: Liaoning, Jilin and Heilongjiang.
Table 3.
Descriptive statistical results of variables.
Characteristics of RD in China
RD of 27 provinces in China during 2011–2022 was estimated based on the indicators introduced above and the entropy weight method. The results are shown in Table 4. At the national level, China's RD shows an upward trend, with an average annual growth rate of approximately 8.592%. From the subregion perspective, the RD level gap between the eastern and western regions and the northeast region is still large. The western region has the highest annual RD growth rate, reaching 11.274%, mainly because China has increased its investment in digital infrastructure construction in the western region in recent years. In the new stage of high-quality development of comprehensive rural revitalization, it is necessary to improve the digitalization level in the northeast and western regions and to enhance regional coordination of rural digitalization.
Model Estimation Results and Analysis
Estimation Results and Analysis of the Fixed Effect Model
Results of the Fixed Effect Model
Based on the results of the LM test, F test, and Huasman test, the fixed effect model is adopted in this study. The control variables are gradually added to Formula 2 step by step, and the results are shown in Table 5. The regression results in Columns 1 - 6 show that with the gradual inclusion of control variables, the coefficient size and significance level of rural digitalization have not changed greatly, partly indicating that the influence of rural digitalization on AGTFP is relatively stable. Column 6 is taken as the benchmark regression result of this study, and the model’s fit goodness is 0.796. As shown in Column 6, the coefficient of rural digitalization is positive and significant at the 1% level. This indicates that the improvement of rural digitalization can help improve the allocation efficiency of agricultural production factors, promote agricultural modernization and the popularization of green production technologies, reduce the amount of pesticides and fertilizers applied, and ultimately reduce agricultural carbon emissions. In other words, rural digitalization can significantly improve AGTFP. Thus, Hypothesis H1 is confirmed.
Table 4.
Mean values of RD in China from 2011-2022.
As for the controlling variables, the agricultural planting structure (APS) plays an important positive role in promoting AGTFP because, as an important part of the agricultural production system, the agricultural planting structure directly affects the efficiency of agricultural production and environmental effects. The education level (EDU) also plays a positive role in promoting AGTFP. The development of education can improve the overall quality of workers, thus promoting the promotion and application of agricultural science and technology, thus benefiting AGTFP. The intensity of financial support for agriculture (FIS) has a positive impact on AGTFP, but is not significant. Previous studies have shown that the effect of financial support to agriculture on AGTFP is complicated and influenced by many other factors [25]. Besides, the urban-rural income gap (ING) inhabits the improvement of AGTFP. That may be because the urban-rural income gap can affect the flow and allocation of the agricultural labor force, which in turn affects the efficiency and quality of agricultural production. If the income gap between urban and rural areas is large, it may lead to the flow of agricultural labor force to cities and will affect the human resource allocation of agricultural production, so it will have a negative impact on agricultural green total factor productivity. The proportion of disasters (DIS) also has a negative impact on AGTFP. Disasters can directly destroy farmland, affect the growing environment of crops, and reduce the cultivated area, which will lead to a decrease in crop yield, thus affecting the stability of agricultural production and inhibiting the growth of AGTFP.
Table 5.
Benchmark regression results of RD on the SGTFP.
Endogeneity Test
The possible endogenous sources of this study are as follows: First, although multiple control variables are selected and the fixed effect model is used for estimation, important explanatory variables may inevitably be omitted, resulting in biased parameter estimation. Second, the level of rural digital development is calculated based on the index system. Due to the limited data acquisition, there may be problems such as unattainable factors and measurement errors. Third, there may be a two-way causal relationship between digital rural development and AGTFP. On the one hand, rural digital development can transform agricultural production links through digital technology, promote technology upgrading, increase energy saving and efficiency, and also help agricultural carbon reduction. Agricultural carbon reduction also means improving agricultural comprehensive production capacity. On the other hand, the green energy savings of agricultural machinery, the increase of fertilizer reduction, and the precise control of pollution are inseparable from the support of digital technology, so the promotion of AGTFP may also promote the digital development of rural areas.
Based on the practice of Zhao et al. (2020) [26], this study selects the cross-multiplication term between the number of fixed telephones per 100 people in each province in 1984 and the total social fixed assets investment in agriculture, forestry, animal husbandry, and fishery in each province in the previous year (which has been adjusted to the actual value in 2011 according to the GDP deflator) as the instrument variable. Two-stage least square method (2SLS) and generalized moment estimation (GMM) were used to identify the net effect of digital rural development on AGTFP. The selection of instrumental variables is based on the following criteria: The traditional post and telecommunications industry is the predecessor of the rural communication industry, while the development of the digital countryside cannot be separated from the construction of information infrastructure, and the two meet the correlation conditions. However, with the development of emerging communication technologies such as "Internet +", cloud computing, and artificial intelligence, the influence of the traditional telecommunications industry on the contemporary economy and society has gradually declined, and it is more difficult to affect AGTFP, so it meets the exogenous conditions to a certain extent.
The regression results of 2SLS and GMM are shown in Table 6. The results of the first stage of both methods show that the instrumental variable digital_iv is significantly positively correlated with the endogenous variable digital rural development level. In the weak instrumental variable test, the Wald statistic is greater than the critical value at the level of 10%, indicating that the selected instrumental variable is reasonable and has explanatory power to the level of rural digital development. In the second stage of regression, the influence effect of rural digital development level is significantly positive at the level of 5%, and LM statistics significantly reject the null hypothesis of insufficient identification of instrumental variables. This indicates that after considering endogeneity, the level of rural digital development still has a significant promoting effect on the promotion of AGTFP, which further supports the results of baseline regression.
Robustness Test
In the benchmark regression, the method of stepwise regression is adopted, and it is found that the coefficient and significance of rural digitalization do not change significantly, which reflects the robustness of the research conclusion. In order to further verify the robustness of the research conclusions, this study adopts the methods of replacing explanatory variables, replacing models, shortening the sample period, and shrinking tail regression to test the robustness.
The results are shown in Table 7. First, in order to avoid the one-sidedness of the research conclusion due to excessive reliance on comprehensive measurement indicators, two indicators of agricultural digital penetration added value and the number of rural broadband access households were respectively used as surrogate variables for rural digital development, and the benchmark regression model was re-estimated. The results are shown in Column 2 of Table 7. After replacement, the core explanatory variables can still maintain a significant positive impact on AGTFP. Then, the paper replaces the fixed effects model with the random effects model, and the results are shown in Column 3 of Table 7. Compared with the baseline regression results, the influence of rural digitization on AGTFP is still stable after using the random effects model. Second, the COVID-19 outbreak in 2020 had a significant impact on various economic and social fields. To exclude the impact of the epidemic, this study adjusted the sample period to 2011–2019 and re-estimated the impact of rural digitalization on AGTFP. The results are shown in Column 4 of Table 7. Compared with the baseline regression results, the impact of rural digitalization on AGTFP is still stable after excluding the impact of COVID-19. Finally, to reduce the impact of outliers on the conclusions of this study, the core explanatory variables were increased by 2.5% before and after. The specific results are shown in Column 5 of Table 7. Compared with the benchmarking regression results, the impact of rural digitization on AGTFP is still stable after the tail-shortening treatment.
Regional Heterogeneity Analysis
On the whole, rural digital development has significantly increased AGTFP, but there are differences in agricultural natural resource base, agricultural economic development, and agricultural production characteristics among regions, which may lead to large regional differences in this impact. Therefore, this study studies the heterogeneity of rural digitalization in different regions in terms of AGTFP, and the regression results are shown in Table 8. As can be seen from Table 8, the estimated coefficient in the western region passed the significance test at the 5% level, while the eastern region did not, indicating that the promotion effect of digital rural development on AGTFP in the western region is more obvious than that in the eastern region. It may be because the western region has broken through the space-time barrier of traditional agricultural development with information technology, forming new business forms such as e-commerce, order agriculture, and tourism health care, reducing the dependence on fertilizers, pesticides, machinery, and energy, and reducing agricultural carbon emissions from the source. Coupled with a good forest carbon sink foundation, rural digital development has a more obvious role in promoting AGTFP.
Estimation Results of the Mediating Effect Model
This study analyzes the influence mechanism of digital rural development on AGTFP from three perspectives: scale management, structure optimization, and technological progress effects. The results are shown in Table 9.
(1) The scale management effect of RD. Column 2 of Table 9 shows that the regression coefficient of RD on the scale is 0.214 (P<5%). Column 3 shows that after the variable scale is added to the benchmark model, the coefficients of the two independent variables are significant and positive, indicating that the scale variable plays a partial mediating role in the process of RD driving AGTFP improvement. By calculation, the mediating effect accounts for 12.632%. The transformation of agriculture to large-scale management can help realize the best combination of labor benefits, technical benefits, and economic benefits; promote the optimization and efficient use of resources; and subsequently promote AGTFP.
Table 8.
Regional heterogeneity test.
(2) The structure optimization effect of RD. In Column 5 of Table 9, the regression coefficient of RD to a struct is 0.182 (P<5%). The results in Column 6 show that after the variable struct is added to the benchmark model, the coefficients of the two independent variables are significant and positive, indicating that struct plays a partial mediating role in the process of RD driving AGTFP improvement. By calculation, the mediating effect accounts for 14.676%. With the modern information network as the carrier, digital rural development connects the intensive processing of agricultural products, rural e-commerce, digital inclusive finance, tourism, health care, and other industries through digital technology, promotes the cross-integration of the industrial chain and the value chain leap, and improves the industrial structure to an advanced level, thus reducing rural development's dependence on high-carbon energy, reducing energy consumption per unit of output, and promoting the transformation of agriculture to green and low-carbon [14].
(3) The effect of technological progress on RD. In Column 8 of Table 9, the regression coefficient of RD to tech is 0.147 (P<5%). The results in Column 9 show that after the technology progress variable tech is added to the benchmark model, the coefficients of the two independent variables are significant and positive, indicating that the technology progress variable partially mediates the process of RD driving AGTFP improvement. By calculation, the mediating effect accounts for 17.105%. By promoting and applying digital technology in agriculture, the development of rural digitalization has resulted in the reduction and increased efficiency in the use of fertilizers and pesticides, the development and utilization of waste resources, and the supervision and treatment of pollution through technological innovations, such as remote sensing, drones, and the Internet of Things, contributing to the automatic control and intelligent management of agricultural production and improved agricultural production efficiency [24].
Estimation Results of the Threshold Effect
To test the effect of different rural digitization levels on AGTFP, this study tested the threshold effect of RD on AGTFP according to Formula (5). Specifically, the number of thresholds is first determined, and then the coefficient and confidence interval of the threshold value are calculated. Each threshold test was repeated 500 times, and Table 9 shows the threshold effect test results. According to the F value and P value obtained by the threshold effect test, the rural digitization level passed the significance test of the double threshold but not the triple threshold. This indicates that the number of thresholds for RD is 2. The minimum residual sum of squares is used to estimate the threshold value of the rural digitization level to determine the specific threshold value. The results are shown in Table 10.
The specific threshold values are as follows: the first threshold is 6.513, and the second threshold is 8.370. According to the RD level, the double-threshold model divides the whole sample into three intervals (as shown in Table 11): when RD is lower than the first threshold value, the estimated coefficient of RD's impact on AGTFP is 0.136, but it fails the significance test. This indicates that in this region, rural digitization does not significantly promote AGTFP growth. This is mainly because, in the early stage of digitalization, many resources need to be invested in technology research and development, equipment updates, personnel training, etc. High initial costs make it difficult to benefit considerably in the short term, resulting in no significant improvement in AGTFP. When RD crosses the first threshold and is less than the second threshold, the regression coefficient of RD on AGTFP is 0.451, which is significant at the 1% level. This indicates that rural digitization promotes the growth of AGTFP when RD is high. When the RD is greater than the second threshold, the estimated coefficient of rural digitization on AGTFP increases to 0.614 and is significant at the 1% level. This is mainly because when RD reaches a certain level, digital technology and agricultural production are deeply integrated and penetrated, agricultural production begins to realize comprehensive digitalization and intelligence, and RD plays a more significant role in improving AGTFP.
Table 9.
Regression results of mediating effect.
Conclusion and Policy Recommendations
Rural digitization and green agricultural development are indispensable requirements for China’s rural revitalization. Systematic analysis of the logical correlation between the two is highly important for improving AGTFP. Based on data from 2011 to 2022, this study first used the super-SBM model and entropy evaluation method to measure AGTFP and RD in China. Second, the influence of rural digitization on AGTFP is studied using a fixed effect model. With the help of the intermediary effect model, it indicates that rural digitalization development can promote AGTFP through the effects of scale management, structure optimization, and technological progress. Finally, the panel threshold model is used to test the threshold effect of RD on promoting AGTFP.
Through empirical analysis and testing, the following conclusions are reached: First, China's AGTFP and RD significantly improved from 2011 to 2022. Second, rural digitalization can significantly improve AGTFP. From the perspective of heterogeneity analysis, rural digitalization in western China has the greatest impact on AGTFP. Based on mechanism analysis, it can be concluded that rural digitalization mainly promotes AGTFP through the effects of scale management, structural optimization, and technological progress. Additionally, rural digitalization has a double-threshold effect on AGTFP. When the RD of the whole study area is below the first threshold value, the influence coefficient of RD on AGTFP is not significant. As RD increases, its influence on AGTFP also increases. In other words, the greater the level of rural digitalization, the more conducive it is to improving AGTFP.
Table 11.
Threshold effect estimation results.
| Explanatory variable | Coefficient | T-Value |
|---|---|---|
| RD (RD≤6.513) | 0.136 | 1.035 |
| RD (6.513<RD≤8.374) | 0.451*** | 3.198 |
| RD (RD>8.374) | 0.614*** | 5.211 |
| N | 324 | |
| R2 | 0.754 |
Based on the above research conclusions, the following policy recommendations are proposed:
First, digital villages should be constructed, and infrastructure allocation should be optimized. Under county economic development policies, the new infrastructure should serve as an opportunity to vigorously improve the quality of rural communication networks and 5G coverage and provide technical support for farmers to adopt technologies such as the Internet of Things and cloud computing to carry out intelligent agricultural production and management [27, 28]. Besides, the agricultural supply, production, consumption, service, and innovation chains should be opened up, a digital operation platform that integrates production, operation, processing, sales, feedback, and other links should be built, and the integration of data and reality should be promoted, consumer groups should be accurately connected, and consumer demand should be quickly matched. Third, the storage and sorting of agricultural data should be accelerated, data algorithms and computing power should be optimized, agricultural green quality management should be empowered, the visualization of agricultural field management should be enhanced, source traceability and green quality control should be achieved, and high-quality green transformation of agriculture should be promoted [29].
Second, new industries and new forms of business should be fostered in rural areas so as to promote the upgrading and optimization of the rural industrial structure. Through network media, we can accurately connect consumer demand, reduce agricultural carbon emissions before, during, and after production, strengthen the deep integration of data elements and traditional agriculture, promote supply chain intelligence and industrial chain extension, and reduce dependence on high-carbon energy. The central and western regions should give full play to their advantages in resources and environment, use digital rural development to cultivate rural e-commerce, leisure tourism, green agricultural production, and other high value-added industries, and promote the green transformation of rural areas.
Third, the digitalization of agriculture should be accelerated, and agricultural technological progress and green development should be promoted. The use of information technology to build a modern agricultural information system and improve the utilization efficiency of factors and environmental governance capabilities should be explored [30]. Intelligent irrigation systems, traceability monitoring systems in planting areas, and precision fertilization should be established. In addition, the development of biomass energy in rural areas should be promoted so as to reduce the use of pesticides, agricultural machinery, and agricultural waste resources.

