

Introduction
Climate change has emerged as a critical issue in global environmental discourse, necessitating a 7.6% annual reduction in global greenhouse gas emissions from 2020 to 2030 to limit warming to 1.5°C, as per the Paris Agreement [1, 2]. As a major economy, China has committed to peaking carbon emissions by 2030 and achieving carbon neutrality by 2060. To this end, green innovation, which includes eco-friendly products and processes, is vital for sustainable growth [3]. Carbon emissions trading (CET) is a market-based approach that can reduce emissions while promoting economic benefits [4]. The Porter hypothesis suggests that environmental regulations, including CET, encourage companies to innovate for environmental and economic gain [5]. This innovation drive reduces emissions and, through the sale of surplus allowances, funds further green advancements [6, 7], enhancing green innovation efficiency and contributing to a sustainable economic model [8].
The concept of reducing emissions via market-based mechanisms was first introduced by the Kyoto Protocol [9]. The EU set a precedent in 2005 with the world’s largest CET scheme, followed by the US and South Korea leading in their regions. China officially initiated CET pilots in 2013. The nationwide unified carbon trading markets covered Hubei, Guangdong, Shenzhen, Chongqing, Shanghai, Tianjin, and Beijing, marking a historic milestone in China’s market-incentive environmental regulation. The market is open to enterprises from eight major industries, including power generation and petrochemicals, but excludes financial institutions from trading. Differing from the European Union Emissions Trading System (EU ETS) which uses a combination of auctioned and freely allocated quotas, China employs a free allocation method within a cap-and-trade system. This system obliges companies to acquire emission quotas relative to their output, selling surplus or buying additional quotas as needed. Importantly, China’s Tradable Performance Standard (TPS) dynamically adjusts emission standards based on a facility’s efficiency and emission levels, allocating more quotas to efficient, low-emission facilities and fewer to those less efficient. This approach not only limits emissions but also incentivizes green innovation, offering a distinct model from the fixed cap-and-trade system of the EU ETS [10].
Compared to the more established CET markets in Europe and the United States, China’s CET market, which started later, faces challenges such as limited activity, insufficient liquidity, and dominance of state-owned enterprises, alongside legislative delays [11]. Since the carbon market mechanism is weak and a reasonable pricing mechanism is hard to form, then how does the CET scheme effectively induce green innovation behavior by emission control entities and subsequently improve green innovation efficiency? Existing research has not provided a comprehensive explanation for this. Given the historically dominant role of governmental intervention in environmental management in China, a reasonable hypothesis is that government intervention rather than market mechanisms primarily amplifies the impact of green innovation policies on green innovation efficiency. Moreover, according to Complex Systems Theory, environmental management systems typically involve multiple interacting elements, the outcomes of which are often nonlinear [12]; behavioral economics further corroborates this idea, revealing that people exhibit irrational behaviors when faced with various incentives and penalties, potentially leading to nonlinear responses [13]. For instance, at a certain threshold, governmental penalties might trigger an “avoidance” reaction that market mechanisms may not fully compensate for. Based on the above discussion, this study raises three critical research inquiries: Does the initial stage of the carbon trading market lead to an enhancement in green innovation efficiency? Which plays a more significant role in China’s CET market: market mechanisms or government intervention? How does market mechanism influence green innovation efficiency under varying degrees of governmental interventions? The questions mentioned above will be addressed in the following sections.
This paper makes three key contributions. First, it explores the CET scheme’s effects on green innovation efficiency in China by integrating both perspectives of market mechanisms and government intervention. In contrast to previous studies that treat these factors in isolation, this research examines their interplay, providing a more comprehensive understanding of their collective impact on green innovation. Second, this study quantifies government intervention as a threshold variable, revealing non-linear dynamics, unlike previous research focusing only on the linear impacts of government intervention on green innovation. Identifying a critical intervention level provides an empirical basis for strategies that enhance green innovation within a structured market framework, supporting effective policy-making. Lastly, by creating a provincial database and analyzing policy impact variations across regions and energy consumption patterns, it sheds light on the operational diversity of CET systems, contributing to targeted policy recommendations for promoting sustainable development in China.
Literature Review and Theoretical Analysis
Research on the CET Scheme’s Effectiveness
The CET scheme, grounded in property rights theory, assigns carbon emission rights to entities, effectively turning environmental pollution’s external costs into companies’ internal financial considerations. This approach not only incentivizes emissions reduction through a market-based pricing mechanism but also encourages the adoption of greener technologies, in line with the theory that well-defined and tradable property rights lead to efficient market outcomes and innovation [14]. Empirical research supports this framework: Zhang et al. [15] and Liu [16] have demonstrated through the difference-in-difference (DID) methodology that carbon trading markedly reduces energy consumption and emissions in China’s pilot areas. Similarly, Qi et al. [17] found that CET policies effectively lower emissions without affecting economic growth, and Zheng et al. [18] observed that CET drives technological progress, leading to decreased corporate pollution. These studies collectively affirm the DID model’s utility in evaluating CET policy’s ecological governance impacts. When exploring the action mechanisms of CET schemes, some scholars highlighted that it significantly raises firms’ innovation with environmental patent increases, reduces SO2 emissions, and promotes industrial growth [19, 20]. Hu et al. found that the scheme’s effects are primarily due to improved technical efficiency and adjusted industrial structure, with better performance in regions with high environmental enforcement and marketization [21]. Guo et al. examined EU ETS’s purpose of carbon emission reduction via entities’ trading profits, and their trading profits and emission abatements are positively correlated stronger in Phase II than Phase I [22]. Borghesi et al. examined the impact of the first phase of EU ETS on environmental innovation, accounting for various internal factors to firms such as firms’ relationships and sectoral energy expenditure intensity [23].
However, the existing literature has the following limitations: Research discussing whether the CET scheme has a positive impact on carbon emissions mainly focuses on whether the emission reduction effects exist, while the research on how the CET scheme achieves these effects is not thorough. Many studies, when exploring the action mechanisms, focus on the impact of the CET scheme on the behavior of microeconomic entities, neglecting the perspective of macro-institutional design, such as market mechanisms and government interventions. Clearly, the actual performance and trading activities of China’s pilot carbon markets raise questions about the effectiveness of the market mechanisms during the pilot phase. The existing research has not addressed these concerns, which is detrimental to the optimization of the carbon emission system mechanisms. Therefore, it is necessary to deeply explore whether and why the carbon market can achieve the expected effects in the context of weak market performance.
Analysis of the CET Scheme and Green Innovation Efficiency
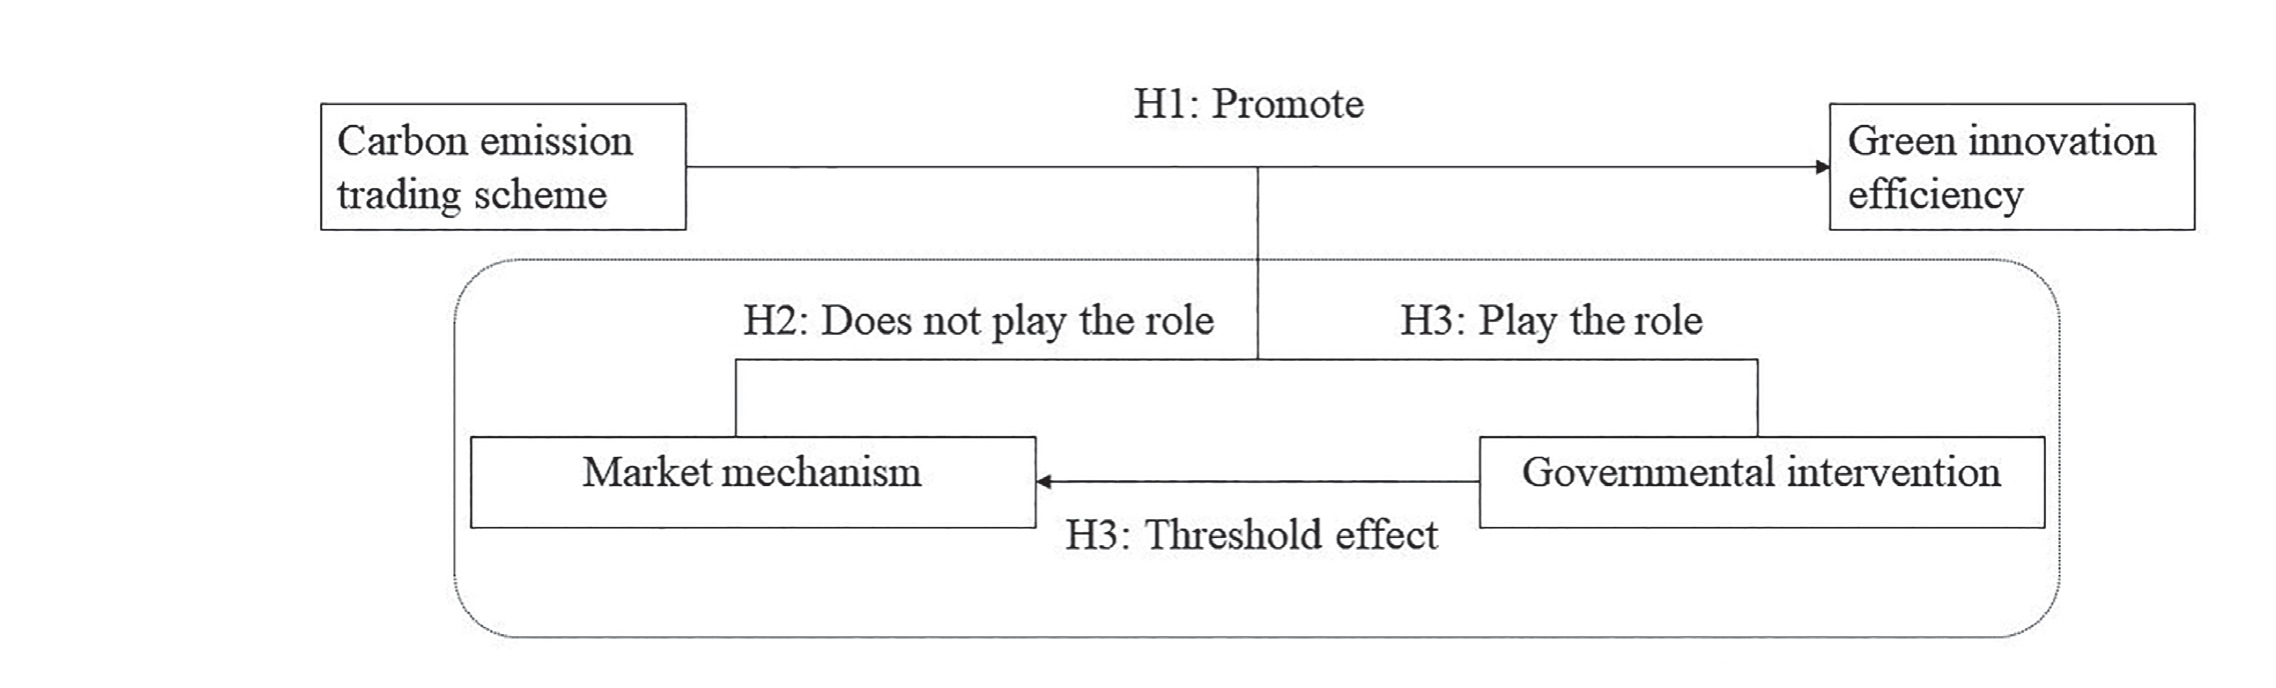
As mentioned earlier, many studies focus primarily on the direct environmental benefits of CET without fully exploring its economic viability. China’s carbon trading market, employing the TPS, aims at enhancing both emission reduction efficiency and economic benefits. Consequently, this paper focuses on examining changes in green innovation efficiency. Green innovation is an emerging field that integrates innovation with eco-conscious principles, pursuing the dual objectives of fostering economic growth while ensuring environmental preservation [3]. It is found that green innovation, political risk, and human capital are crucial for energy efficiency in Malaysia [24], while green innovation, political risk, and green finance play key roles in Brazil’s environmental quality [25]. Zhou noted that green imitation innovation is beneficial, and independent innovation offers greater environmental benefits in the long term [26]. Companies investing in R&D and green innovation achieve higher market efficiency and competitive advantages [27]. Furthermore, green innovation has a positive moderating effect on the relationship between environmental regulation and capital investment [28], but the interaction between innovation driven and resource endowment will inhibit green total factor productivity [29]. Xu et al. pointed out that the green technology innovation behavior of construction and demolition waste recycling enterprises interacts with the green credit participation strategy of banks [30]. Li et al. have found that resource endowment, financial agglomeration, and innovation-driven activities significantly boost the green innovation efficiency of construction enterprises in China [31]. Green innovation efficiency evaluates development efficiency in terms of resource and environmental costs [32]. Research on measuring this efficiency has evolved from using evaluative indices and analytical methods like factor analysis and entropy [33] to more comprehensive multi-factorial models. Among these, Data Envelopment Analysis (DEA) and Stochastic Frontier Approach (SFA) are prominent for their ability to handle multiple inputs and outputs, including labor, capital, and emissions [34, 35]. DEA is particularly noted for its adaptability across various contexts with models such as CCR, BCC, and SBM, including super-efficiency SBM for analyzing undesirable outputs efficiently [36, 37].
Literature implies a significant link between the CET scheme and green innovation efficiency. The carbon price acts as an economic signal, prompting companies to adopt cost-effective, environmentally friendly production methods due to the financial impact of emissions reduction [38, 39]. Furthermore, carbon trading incentivizes technological innovation needed for emission reduction, leading companies to invest in new, eco-efficient technologies [40]. In light of these observations, this paper puts forth the following hypothesis:
Hypothesis 1: The initiation of the CET policy can improve green innovation efficiency.
Analysis of Market Mechanisms and Government Intervention
The market mechanism refers to carbon trading being solely based on carbon pricing, while CET market initiation does not guarantee that entities will meet their emission control obligations through carbon trading alone. The current characteristics of low liquidity and weak activity in China’s pilot CET markets can be indicative of information asymmetry, suggesting a lack of market mechanism [41]. For example, the occurrence of listed prices without subsequent transactions in some pilot markets [42], alongside the erratic fluctuations in trading volumes and the volatility of carbon prices, underscores the market’s struggle to establish effective price signals [43]. Such unpredictability discourages participation by increasing the costs associated with managing this volatility and indicates the market’s challenge in accurately internalizing the environmental costs of emissions. Furthermore, the nature of carbon emissions reduction, with its widespread environmental benefits, mirrors public goods’ characteristics of non-excludability and non-rivalry, prone to causing market failures [44]. This universal benefit, regardless of individual emission reduction efforts, introduces the “free-rider problem,” where entities might avoid investing in emission reduction, benefiting from others’ actions without contributing themselves. Thus, non-market mechanisms need to intervene to enhance the effectiveness of the carbon market [45]. Given these insights, this paper posits the following hypothesis.
Hypothesis 2: The market mechanism is insufficient to significantly enhance green innovation efficiency within China’s CET market.
In an idealized scenario, classical economics suggests that a perfectly competitive market is capable of achieving efficiency through the optimal allocation of resources. In reality, however, most markets are not perfectly competitive, and market inefficiencies often occur [46]. The Government Intervention Theory [47] explores how the government can rectify market failure through intervention, thereby improving social welfare.
In the realm of Chinese CET markets, often hindered by low liquidity and limited participation, governments are motivated to compensate for the deficiencies of the market mechanism. A key form of such intervention is the strategic allocation of carbon emission rights, impacting market dynamics and mitigating issues. Firstly, government control over the scarcity and distribution of carbon emission rights curbs “carbon hoarding” – the accumulation of more rights than needed for operations [48]. This ensures emission rights support actual green production instead of speculative holding. Secondly, strategic allocation incentivizes participants and refines market incentives and sanctions [49]. The careful allocation by governments maintains market enthusiasm [50] and enhances carbon market pricing mechanisms. These actions are critical in promoting an environment conducive to green innovation. Drawing upon the theoretical analysis above, the subsequent hypothesis is put forth.
Hypothesis 3: Government intervention significantly amplifies the impact of the CET scheme launch on green innovation efficiency.
Analysis of Nonlinear Government-market Impact on Green Innovation Efficiency
Existing research lays the groundwork for compre-hending the role of government intervention in addressing market failures, especially those arising from externalities and information asymmetry [51]. However, the impact of government intervention on market dynamics and green innovation efficiency in the realm of China’s CET market is complex and potentially nonlinear as various market responses and external factors come into play [52].
In a scenario characterized by a low-efficiency carbon market, issues of market imperfections and information asymmetry are more likely to be present at lower levels of government intervention [53], implying that the market fails to accurately reflect the true social costs of environmental externalities, such as carbon emissions. Consequently, emitting entities lack sufficient incentives to actively improve their green innovation efficiency because the market does not provide appropriate economic rewards or penalties. As government intervention escalates, reflected in the scarcity of carbon permits, its influence on market dynamics becomes more pronounced, affecting factors such as market liquidity and pricing [54- 56]. This escalation, while it can incentivize companies towards green innovation, does not necessarily lead to a proportional or predictable enhancement in innovation efficiency [57]. This nuanced dynamic, where the effects of government intervention can vary in magnitude and direction at different levels, suggests a nonlinear relationship.
The threshold effect is always used to exhibit a nonlinear relationship, describing a phenomenon in the effect of one variable on another is not constant but varies depending on whether the threshold is crossed [58]. In the context of this study, government intervention is chosen as the threshold variable because it plays a crucial role in regulating the carbon market, setting emission caps, allocating allowances, and enforcing compliance. The degree of government intervention can significantly alter the effectiveness of market mechanisms in promoting green innovation. Accordingly, this paper put forward the third hypothesis.
Hypothesis 4: Governmental intervention exerts a threshold effect on the interrelationship between CET market mechanisms and green innovation efficiency.
Fig. 1 illustrates the overall structure of this study, encompassing all the hypotheses mentioned earlier.
Research Design
Green Innovation Efficiency Measurement
The SBM-DEA model was chosen for its ability to handle undesirable outputs and incorporate slack variables, providing a more comprehensive efficiency evaluation compared with traditional DEA [59]. Other methods like SFA were not chosen due to their inability to effectively handle undesirable outputs and their assumption of a specific functional form, which may not capture the complexities of green innovation. Thus, this choice ensures a more accurate assessment of green innovation efficiency tailored to the complexities of the research context.
Within this framework, each province is viewed as a Decision-Making Unit (DMU), with consistent representations of inputs and both desirable and undesirable outputs, collectively represented as vectors X = [x1, …, xn] ∊ Rm×n, Yg = [y1g, …, yng] ∊ RS1×n, and Yb = [y1b, …, ynb] ∊ RS2×n, respectively. A corresponding model for this particular DMU is formulated:
(1)
In Equation 1, various symbols hold specific meanings related to efficiency measurement. The symbol ρ stands for the efficiency score. The input slack variable is represented by s–i, sg and sb denote the desirable and undesirable output slack variables, respectively. Lastly, λ is used to represent the weight vector.
Model Construction
The DID model, a quasi-experimental research design, is adept at identifying the effects of policy shock, making it suitable for this investigation. This study considers the official launch of China’s CET pilots in 2013 as the starting point for policy enforcement. It designates the CET pilot provinces as the control group in the quasi-natural experiment, with the configuration of the DID design outlined below.
In the above equation, the variables t and i represent time and province, respectively. The term GIE is used to denote green innovation efficiency. The variable DID serves as an explanatory factor, highlighting the interaction between policy time and the dummy variables for the treatment group. If a significantly negative coefficient, DIDit is observed, it would bolster support for Hypothesis 1. The equation also includes Controls, a set of control variables, along with region (γ1) and year (ηt) fixed effects. The random error term is represented as εit.
To examine the extent to which CET pilots achieve green innovation efficiency improvement through market mechanisms, the baseline regression incorporates the interaction term of DIDit and marketit, as Equation 3, where marketit denotes the performance of the CET market in province i in year t. Because DIDit × marketit = marketit, marketit is not necessary to add it again. In the same way, the interaction term of DIDit and govit is introduced, as shown in Equation 4, where govit represents the degree of government intervention.
To delve deeper into the threshold effect of governmental intervention on the interrelationship between the CET market mechanism and green innovation efficiency, this paper employs Hansen’s threshold regression model as it can provide nuanced insights that linear models may miss [60]. In this model, govit acts as the threshold variable, and π1 is set as the threshold value for the variable as shown in Equation 5.
(5)
Table 1.
Inputs and outputs used in the SBM-DEA model.
Variables Explanation
Explained Variable: As previously mentioned, this study utilizes the SBM-DEA model to calculate the explained variable GIE. Table 1 displays the components of the input and output indicators.
Explanatory variable: In this context, the dummy variable DID serves as the core explanatory variable, which is assigned a value of 1 for regions identified as pilot areas (Beijing, Tianjin, Shanghai, Guangdong, Chongqing, and Hubei). Conversely, all other regions that are not designated as pilot areas are assigned a value of 0 for the DID variable.
Proxy variables: Proxy variables are the level of carbon market performance (market) and the degree of governmental intervention (gov). Referring to the study by Hu et al. [61] and Zhang et al. [62], the variable market is evaluated based on three indicators: market scale, market activity, and market liquidity. In detail, market scale is assessed through transaction value and volume; market activity is assessed by the aggregate of trading days; liquidity is measured by the average daily transaction volume and average transaction price. The entropy method is utilized to assess carbon market performance based on these indicators. Considering the government’s strict control over the cap of carbon emission permits in China, it is appropriate to measure the variable gov, which highlights governmental intervention in CET markets, by the scarcity of carbon emission rights allocation [63]. This limited supply is intended to create scarcity, encouraging enterprises to innovate and reduce their carbon footprint, as part of China’s broader environmental policy goals. It well reflects the government’s pressure on the carbon market. Thus, the ratio of the previous year’s carbon emissions to the current year’s carbon quota allocation in the region is used to measure gov. The larger the value, the stronger the degree of government intervention.
Control variables: According to existing studies, green innovation efficiency is closely related to factors such as population, economy, technology, industrial structure, FDI, and natural resources [64–68]. To maintain a consistent comparison between the control and experimental groups, it is essential to control the relevant characteristics of both groups. This paper selects seven control variables that might influence regional green innovation efficiency, including population density (Pop), economic level (Eco), urbanization rate (Urb), foreign direct investment (Fdi), technical level (Rd), industrial structure (Ind), and resource endowment (Res). Table 2 shows the descriptive statistics of variables.
Data Sources
This study carefully considers factors such as data adequacy, availability, and timeliness to ensure robustness, using panel data from 2005 to 2020 across 30 Chinese provinces, excluding Tibet, Hong Kong, Macau, and Taiwan. Data were sourced from the China Statistical Yearbook, the China Energy Statistical Yearbook, and the China Carbon Emission Trading Network to offer detailed insights into provincial dynamics and carbon market activities. To enhance reliability, monetary values are adjusted to 2000 prices, outliers are managed through winsorization and natural logarithms are applied to all variables except ratios to improve analysis accuracy and address heteroskedasticity, ensuring the study’s comprehensive and reliable outcomes.
Table 2.
Statistical description.
Empirical Results and Analysis
The Value of Green Innovation Efficiency
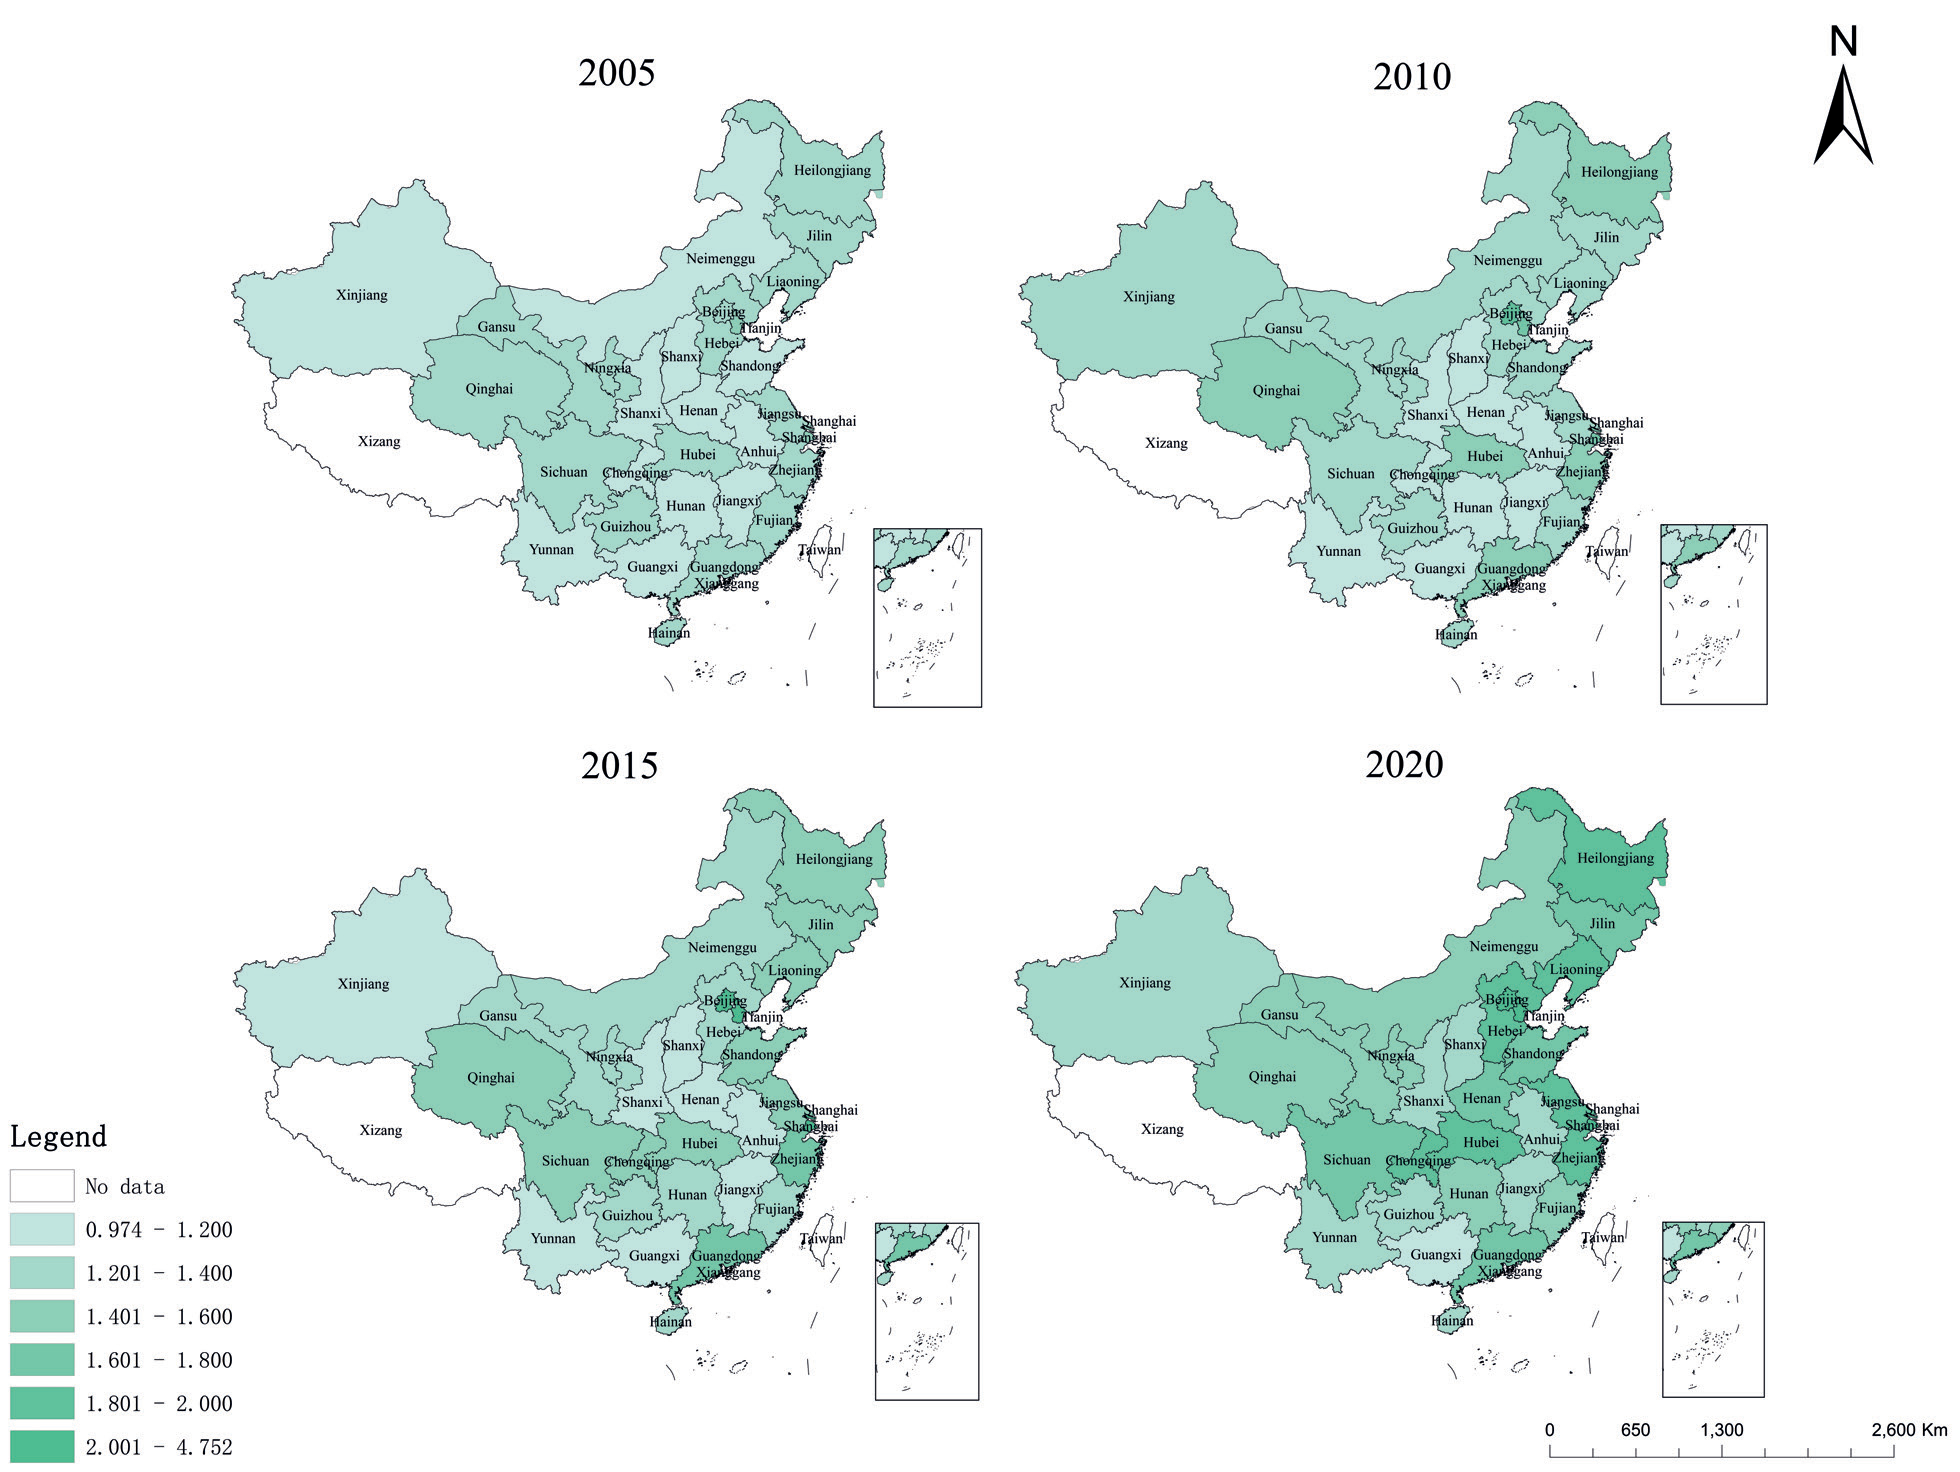
According to Equation 1, this study calculates the green innovation efficiency across 30 provinces from 2005 to 2020. Utilizing the ArcGIS software, the spatial patterns of green innovation efficiency for the years 2005, 2010, 2015, and 2020 are vividly illustrated. As clearly highlighted in Fig. 2, a noticeable increase in China’s green innovation efficiency became apparent following the commencement of the CET policy in 2013. On a regional spectrum, a heterogeneous distribution of green innovation efficiency is evident, presenting a trend of increasing from the west to the east. For instance, Shanghai’s efficiency rose from 1.777 in 2010 to 2.195 in 2015, and Hubei’s from 1.428 in 2010 to 1.567 in 2015. Conversely, Guizhou witnessed a drop from 1.297 in 2010 to 1.234 in 2015. It’s essential to note that the western regions lack a carbon trading market, implying that this change might be associated with other factors. Whether the significant rise in green innovation efficiency is influenced by time factors requires further empirical analysis.
The DID Regression Results
Parallel Trend Test
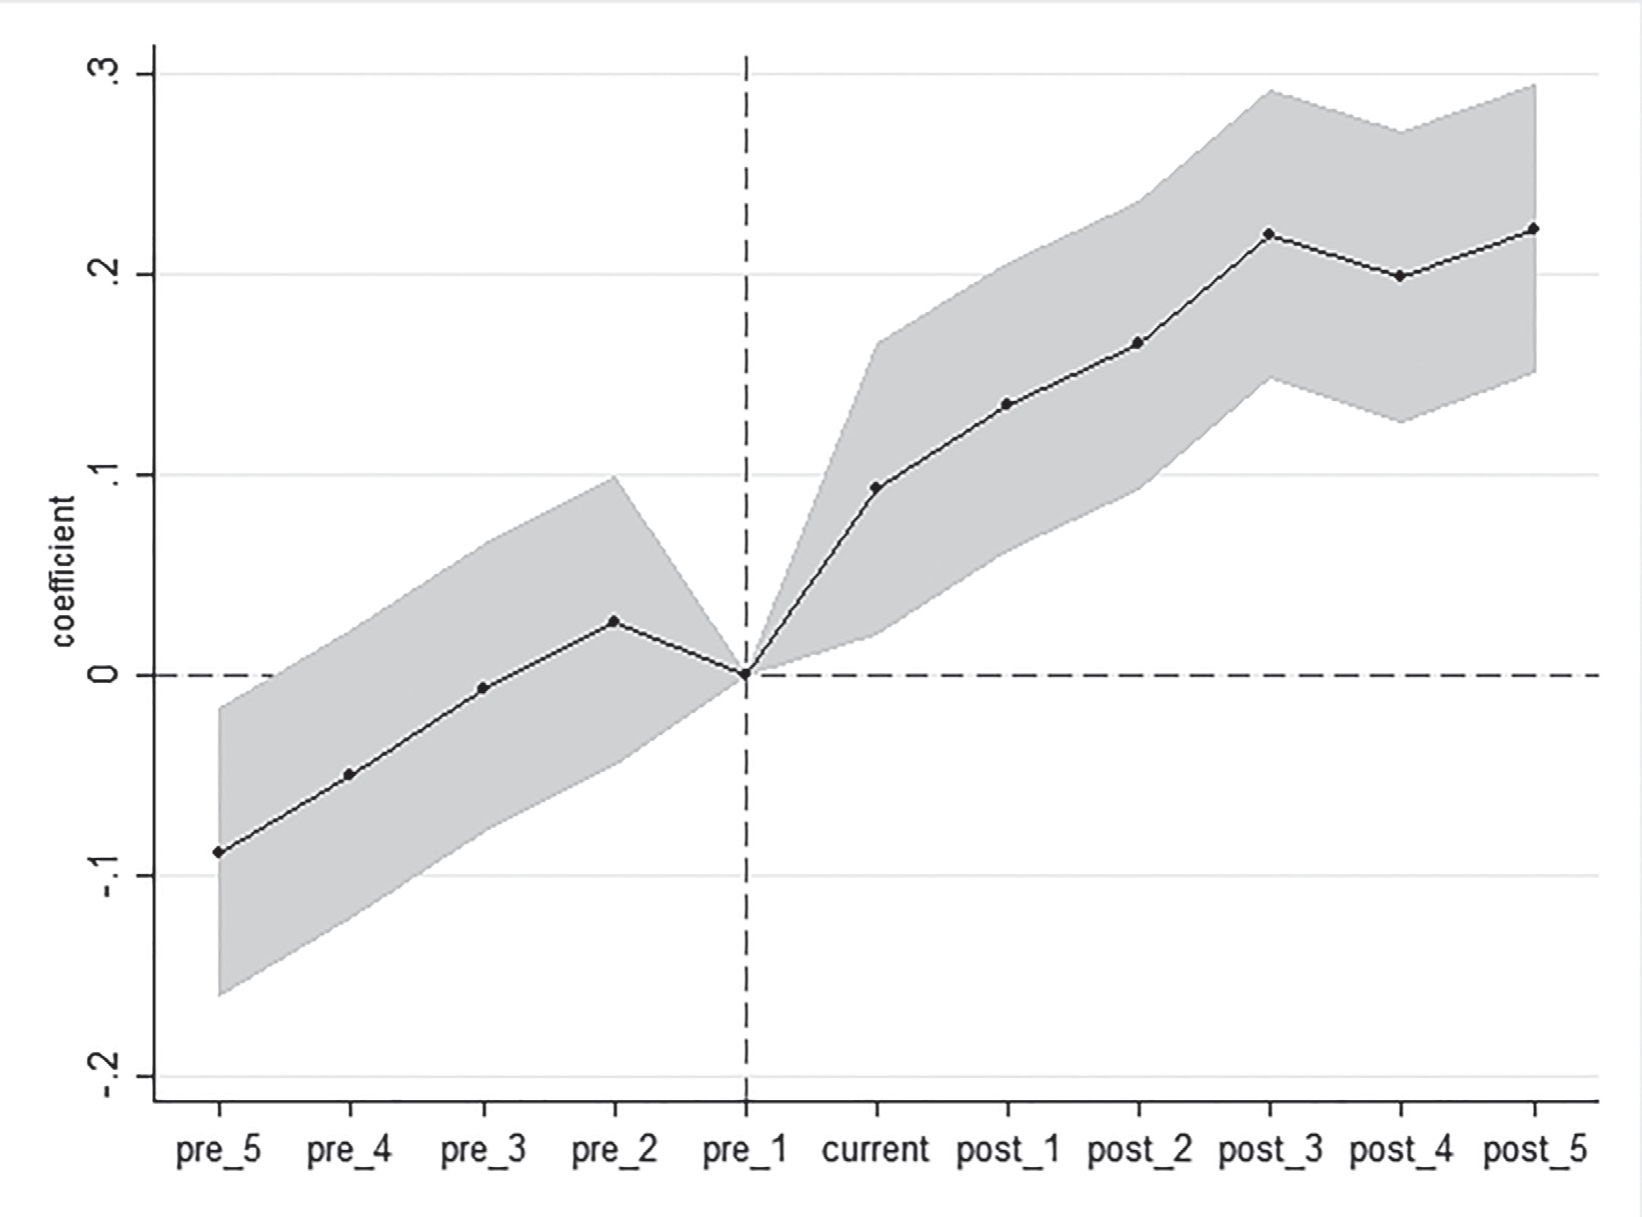
A critical condition for employing the DID approach is the fulfillment of the parallel trend assumption by both the treated and control groups [69]. This implies that prior to the CET pilot initiative being launched, all regions exhibited consistent and stable trends in green innovation efficiency. Fig. 3 provides a visual representation, demonstrating that before the CET policy was put into action, the coefficients of the variable DID fluctuate around 0, with a non-significant p-value. This observation indicates the absence of a pre-existing relationship between the CET scheme and green innovation efficiency, as well as the absence of significant distinctions between the pilot and non-pilot regions. However, after the initiation of the carbon trading policy, the estimated coefficients start to show statistical significance and a positive trend, suggesting that the establishment of the CET market is able to enhance green innovation efficiency, and this promotional effect exhibits a growing trend.
The Baseline Regression Result
Table 3 outlines the outcomes of the baseline regression. The first column excludes control variables, in contrast to the second column. The Two-Way Fixed Effects model consistently demonstrates a significantly positive DID coefficient at the 1% significance level, whether control variables are included or excluded. The addition of control variables leads to an increase in the adjusted R-squared, signifying enhanced explanatory power with these variables. At this stage, the DID coefficient is observed to be a significant 0.121. These results robustly suggest that the CET scheme crucially boosts the efficiency of green innovation, which is congruent with the research conducted by J. Chen et al. [59] and Zhang & Zhang [70]. In summary, hypothesis 1 is verified.
Table 3.
The baseline regression result.
Robustness Tests
The Placebo Test
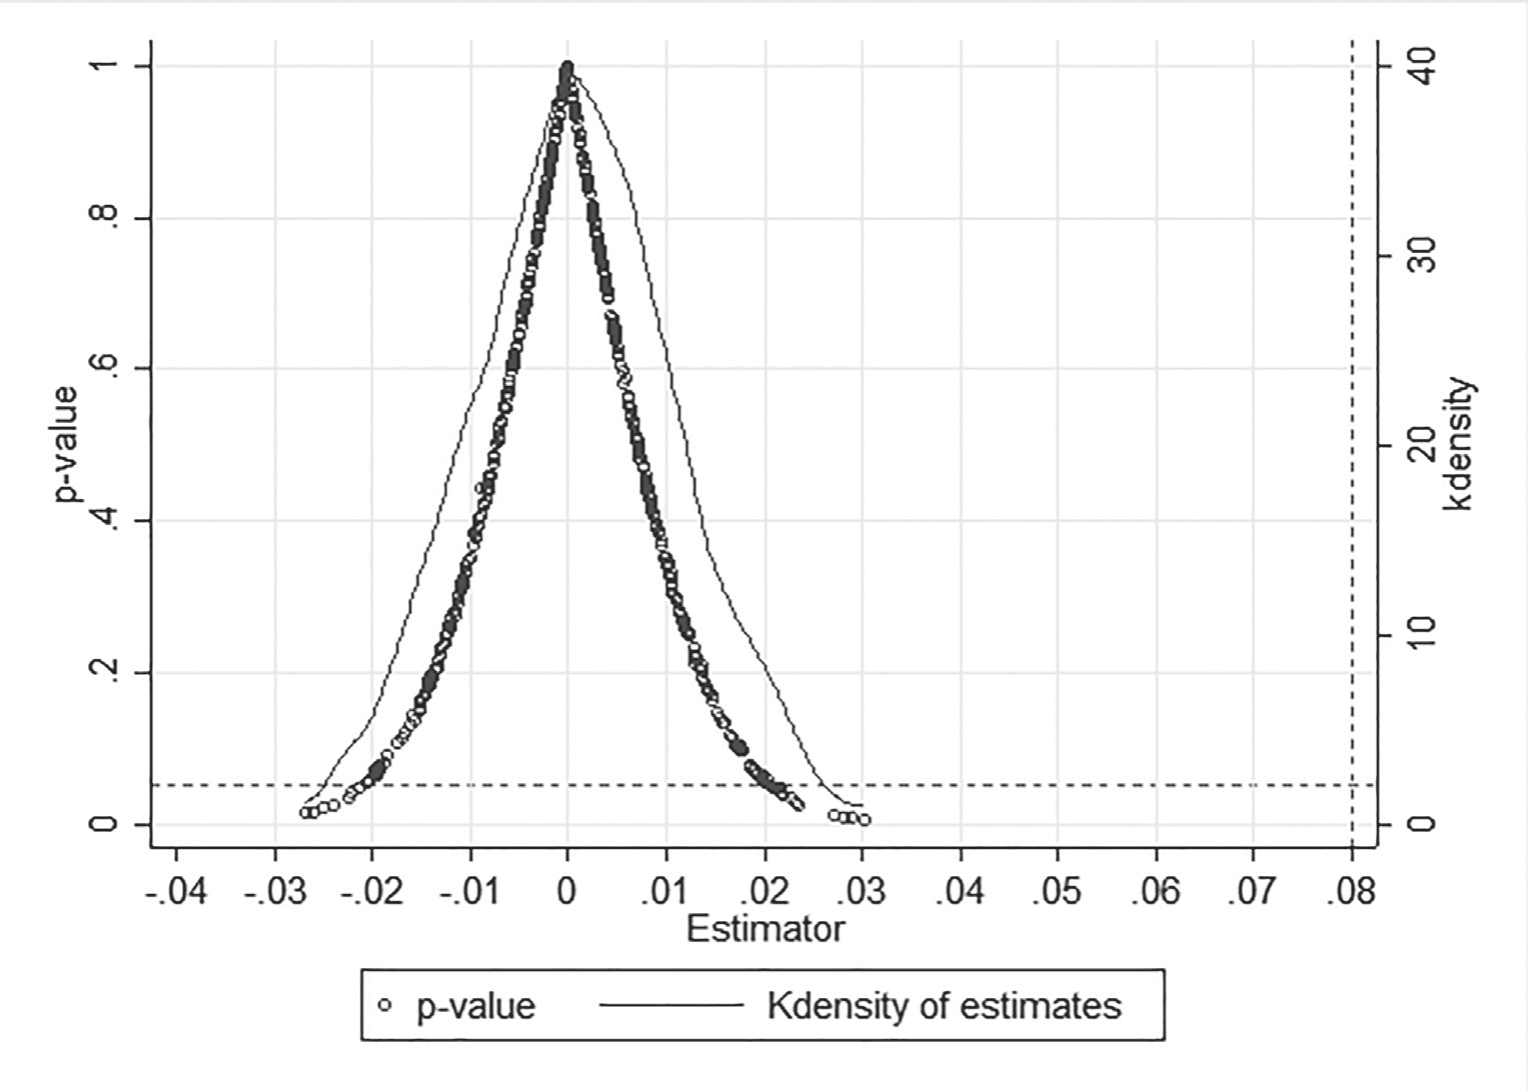
To further eliminate potential influences from other policies or omitted factors on the experimental outcomes, a placebo test was implemented in this study [71]. Adhering to the methodology of Cai et al. [72], this paper selected individuals at random as the treatment group and repeated 500 times to perform DID regressions. The estimation results are displayed in Fig. 4, where estimated coefficients are mostly insignificant at the 10% level and largely centered around 0. The vertical red line represents the actual estimation results, which stand apart from the estimated values. This indicates that the CET policy’s implementation has not been influenced by omitted variables. The positive influence of the CET policy on green innovation efficiency is not coincidental. Thus, the conclusions are reliable and robust.
PSM-DID
To address the inherent “selection bias” issue associated with the difference-in-differences method and to guarantee the comparability of individual characteristics between the control and treatment groups prior to the scheme enactment, this study conducts a robustness test using PSM-DID [16, 73]. Fig. 5 demonstrates the outcomes of the PSM balance assessment. Post-matching, the standardized bias for all covariates approaches 0, signifying a significant reduction in the differences between the control and treatment groups in these covariates, confirming the accuracy of the matching results.
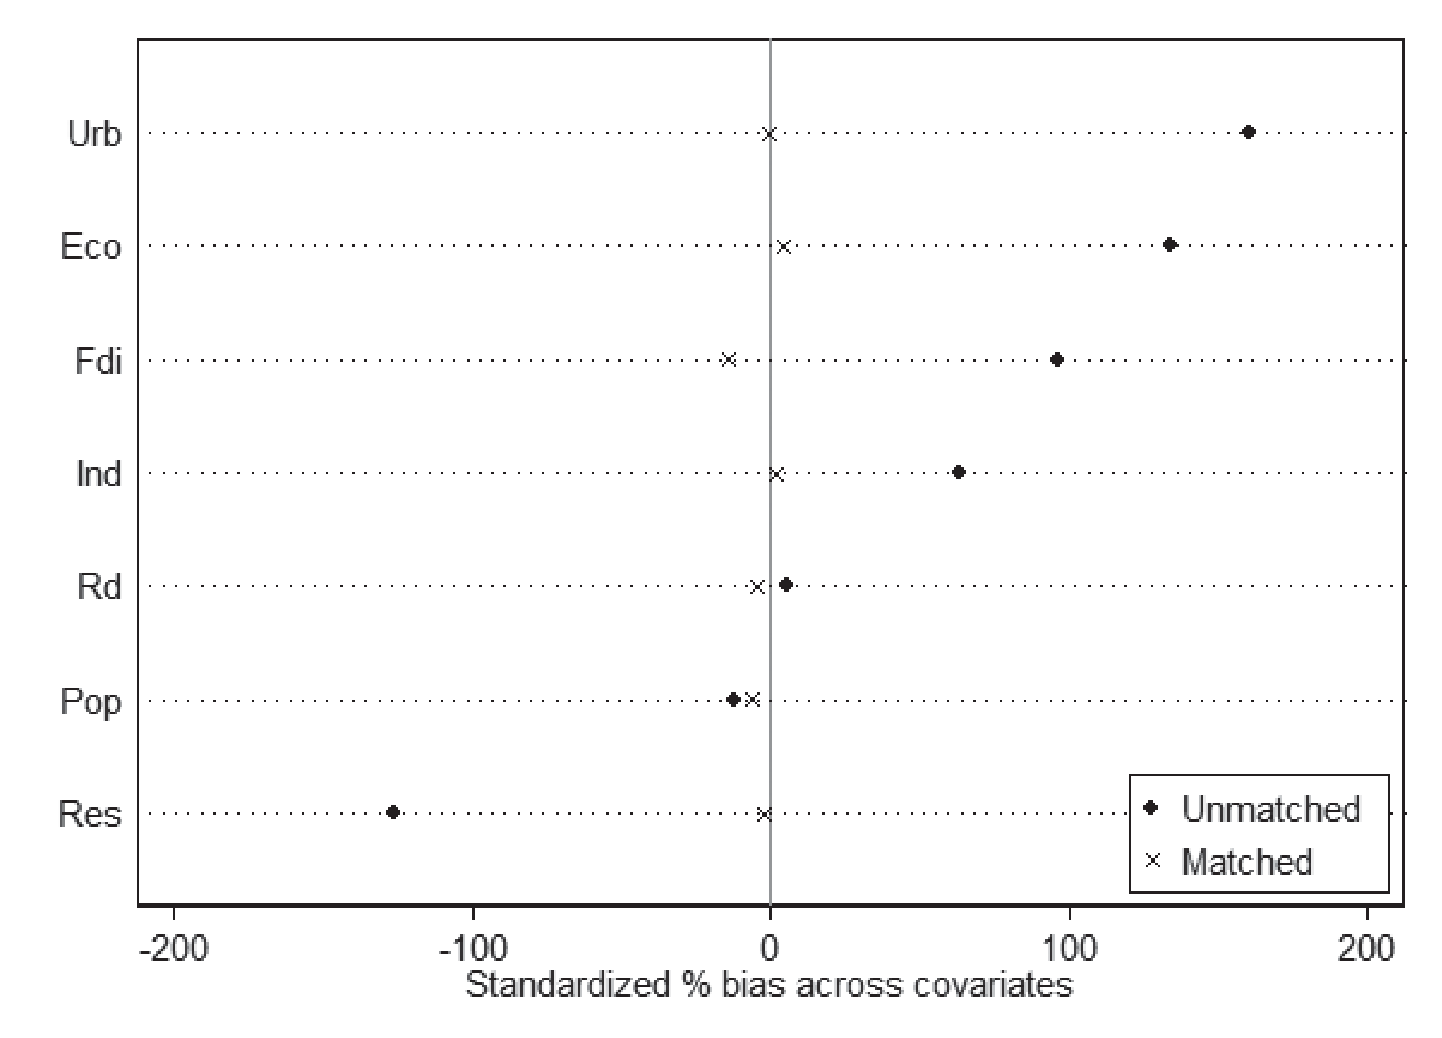
Furthermore, upon applying the DID model to the matched sample, Table 4 demonstrates a significant positive DID coefficient at the 1% level, corroborating the robustness of the baseline regression findings discussed previously and strengthening the credibility of the results.
Change Time Window
To examine the alterations in green innovation efficiency pre and post CET enforcement, this study modifies the policy time window to five and three years before and after the policy to assess the sensitivity of the DID estimation outcomes to sample selection. The examination outcomes demonstrated in column 2 of Table 4 affirm that the adjustment in the time frame width does not alter the direction of the CET policy’s impact on green innovation efficiency. This observation further solidifies the robustness of the baseline regression, offering additional assurance of the reliability of the findings.
Table 4.
PSM-DID and dynamic time window results.
Action Mechanism Analysis
The Roles of Market Mechanisms and Governmental Intervention
Equation 3 is used to test the role of market mechanisms in enhancing green innovation efficiency, with the outcomes displayed in the first column of Table 5. Although α1 exhibits a strong positive significance at the 1% level, θ1 is significantly negative at 5%. This suggests that as market mechanisms strengthen, the positive impact of the CET policy on green innovation efficiency will diminish. A potential explanation is that China’s current CET market is still in the nascent stages, lacking sufficient participants and trading activities to form an effective market mechanism [74]; this immaturity can lead to price volatility, misinformation, and decision-making errors due to a lack of experience and data [75]. Moreover, in the emerging carbon market, carbon prices start low, which might lead to market participants misunderstanding the true cost of carbon emissions, resulting in inefficient resource allocation and continued environmental pollution [76]. Thus, market mechanisms alone are insufficient to significantly enhance green innovation. The hypothesis 2 is verified.
Equation 4 is utilized to investigate the influence of governmental intervention on enhancing green innovation efficiency, with the results displayed in Column 2. The DID coefficient is notably positive at the 10% level, and the coefficient θ2 is significantly positive, with a value of 0.048. The empirical evidence suggests that intensified government intervention in the carbon market, specifically through managing the scarcity of carbon permits, has a tangible positive impact on green innovation efficiency. This intervention effectively incentivizes entities within the carbon market to engage in or enhance their green innovation activities, aligning with the aims of CET policies. Even in an emerging market where carbon prices start low, the strategic management of permit scarcity by the government is aimed at correcting the issue of inadequate carbon pricing. By gradually increasing scarcity, the regulatory body intends to raise carbon prices to a level that more accurately signals the cost of carbon emissions and incentivizes reductions [48]. In light of this, the hypothesis 3 is validated.
Table 5.
Action mechanism results.
Threshold Effect Analysis
To further quantify how the market mechanism operates on green innovation efficiency under varying degrees of governmental intervention, this paper adopts threshold regression as Equation 5. Through the Bootstrap method for threshold effect testing, it is found that governmental intervention has a double threshold effect on the connection between the CET market mechanism and green innovation efficiency. As presented in Tables 6 and 7, the threshold values are 1.474 and 1.892, so the governmental intervention is categorized into three stages: Below the first threshold of government intervention (govit ≤ 1.474), there is a significant negative impact (-0.009), suggesting that market mechanisms alone, without adequate government support, may fail to effectively foster green innovation due to weak signals or insufficient incentives. Between the first and second thresholds, the impact improves to 0.325, indicating a phase of transition where increasing governmental intervention begins to significantly encourage market mechanisms to support green innovation goals, signifying a positive shift from previous negative impacts. Beyond the second threshold (govit > 1.892), government intervention negatively impacts green innovation efficiency by -0.336, indicating a regime where excessive government intervention may undermine the effectiveness of market mechanisms in driving green innovation. In conclusion, the threshold analysis captures the dynamics between market mechanisms and government intervention levels, and hypothesis 4 is verified.
Heterogeneity Analysis
The implementation and enforcement of policies are influenced by geographical differences, leading to varying effects on green innovation efficiency. This study categorizes the sample into three subgroups based on the geographic location within China: the eastern, the central, and the western. It is worth noting that this paper focuses on comparing the central and eastern regions, as the western region has not yet established a CET market. The findings, presented in the first column of Table 8, display a DID coefficient of 0.132 for the central region, which is statistically significant at the 1% level. Similarly, the eastern region’s DID coefficient is 0.083, also holding significance at the 1% level. The above findings suggest that the CET scheme more substantially impacts the green innovation efficiency in the central region compared to the eastern region, after accounting for other variables. This result seems to challenge the stereotype that more developed regions should respond better to low-carbon policy [77–79]. This unexpected outcome is partly due to the cost pass-through capacity [80]. Higher prevalence of state-owned enterprises (SOEs) in the eastern region, which frequently operate in industries characterized by higher market concentration and tend to monopolize key sectors like electricity production and energy mining, active in the CET market. These SOEs, facing limited competition and inelastic demand, can more effectively pass costs onto consumers and thus have less incentive for green innovation compared to private firms [81]. To substantiate this, the study conducted an SOE heterogeneity analysis, categorizing regions based on SOE proportions relative to the median value. This classification highlights the varying impact of SOEs across different regions. Columns 3 and 4 of Table 8 demonstrate that the DID coefficients are statistically significant. Notably, regions with a low SOE proportion exhibit larger DID coefficients, further corroborating the aforementioned point.
The CET market scheme can enhance green innovation efficiency by optimizing and altering energy consumption patterns. Investigating the heterogeneity of energy consumption levels is necessary. This paper adopts the method supported by existing studies and divides the energy consumption level into high and low levels based on the median energy consumption of each province [82, 83]. Columns 5 and 6 in Table 8 reveal DID coefficients for the central and eastern regions as 0.227 and 0.052, respectively, both statistically significant. This suggests that the CET scheme has a greater impact on regions with higher energy consumption levels compared to regions with lower energy consumption levels. Possible explanations could be that regions with higher energy consumption levels may not have adopted the most efficient energy consumption practices yet, which provides an opportunity for improving green innovation efficiency, thereby amplifying the influence of the CET policy in these specific regions. Additionally, regions with high energy consumption may be more reliant on energy-intensive activities, and any policies that affect energy costs or availability, such as the CET policy, would have a greater impact on these regions.
Table 8.
Results from the regression analysis regarding regional heterogeneity.
Discussion
First, unlike Zhang et al., who found that China’s carbon market struggles with energy savings and emission reductions [62], our study shows that the CET scheme significantly improves green innovation efficiency across Chinese provinces. The discrepancy might be attributed to differences in the scope and focus of the studies. Zhang et al. primarily evaluated short-term impacts and focused on market efficiency, whereas this study considers a broader timeframe and emphasizes green innovation efficiency. Second, this study pointed out the weakness of market mechanisms, revealing the dominant role of government intervention in China’s CET scheme, which is in line with Zhou’s conclusion that there are many deficiencies in both internal and external aspects of carbon market performance in China, and China’s economy still relies on many non-market endowments [84]. Third, this study emphasizes the threshold effect of government intervention and reveals the optimal range of policy intervention, filling the gap left by the studies of Joo et al. [85] and Lin & Huang [86], which indicate that stricter regulatory environments and enhanced enforcement mechanisms, indicative of proactive government intervention, significantly contribute to fostering an ecosystem conducive to green innovation, but do not explore the interactive process between government intervention and market mechanisms. This study offers a more comprehensive view of how these elements interact to drive green innovation.
Conclusion and Policy Implications
This study aims to explore the influence of the CET scheme on green innovation efficiency and the action mechanism from the perspectives of market mechanisms and governmental intervention. Applying the SBM-DEA model, this research calculates the green innovation efficiency for 30 provinces spanning from 2005 to 2020. Based on the DID model, it examines the impact of CET on green innovation efficiency and explores the roles of market mechanisms and government intervention, respectively. Finally, a threshold model is used to delve into the threshold effect of governmental intervention on the interrelationship between the market mechanism and green innovation efficiency. Here are the main findings:
(1) The initiation of the CET scheme significantly enhances green innovation efficiency. Regardless of whether control variables are considered, the CET policy consistently improves green innovation efficiency. After the robustness check, the conclusion still holds. (2) Relying on market mechanisms is insufficient to effectively boost green innovation efficiency. With government intervention, the positive impact of the CET policy on green innovation efficiency is markedly amplified. (3) Government intervention exhibits a threshold effect on the relationship between CET market mechanisms and green innovation efficiency, with initial negative impacts (below a threshold value of 1.474) turning positive as intervention increases (above a threshold value of 1.892). (4) CET policy impacts vary geographically and by energy consumption, being more influential in the central regions, areas with lower state-owned enterprise density, and high-energy-consuming zones.
Based on the findings, this paper suggests policy recommendations to refine the carbon market mechanism and enhance its effectiveness. First, it’s critical to strengthen the market’s infrastructure and functionalities, including optimizing carbon quota allocation to encourage competition and active participation. Innovating carbon financial products and expanding market participation to include smaller enterprises and private investors will improve liquidity. Additionally, establishing a comprehensive service platform for market players will ensure open, transparent, and efficient market operations. Second, the government should monitor the interaction between market mechanisms and governmental interventions. Depending on the maturity level of the carbon market, strategies should be adjusted. Within a reasonable range, the government could amplify its interventions to ensure the best synergy between market mechanisms and government interference. Third, policy implementation must account for regional differences and energy consumption levels. Central regions, areas with lower state-owned enterprise density, and high-energy-consuming areas should receive targeted support, such as technology transfers and financial aid. Continuous research and policy evaluation is essential to address the diverse impacts of geographical and consumption patterns on policy effectiveness, ensuring carbon trading policies are tailored to achieve maximum positive outcomes across different regions and sectors.
Although this study is specifically focused on China, it provides a paradigm for recommendations concerning emerging carbon market development worldwide. Empirical evidence suggests that the use of CET schemes to enhance green innovation efficiency is a strategy that can be adopted by other countries seeking to balance economic growth with environmental sustainability. The dual roles of market mechanisms and government intervention highlighted in this study are universally relevant. Countries with emerging or established carbon markets can learn from China’s experience to design more effective CET policies that incentivize innovation while reducing emissions.
Shortcomings and Prospect
The study is limited by its focus on the provincial level, potentially overlooking micro-level dynamics. Future research should investigate CET effects at city and enterprise levels based on this study. Furthermore, future studies should further refine the types of government interventions and examine their specific impacts, as well as consider technological advancements and economic shifts that may affect the efficacy of CET schemes. Understanding these factors will help in designing more effective policies to foster sustainable development.
List of Abbreviations
BCC – Banker, Charnes, and Cooper, CCR – Charnes, Cooper, and Rhodes, CET – Carbon Emission Trading, DEA – Data Envelopment Analysis, DMU – Decision-Making Unit, EU ETS – European Union Emissions Trading System, PSM – Propensity Score Matching, PSM-DID – Propensity Score Matching – Difference-in-Differences, SBM – Slack-Based Measure, SFA – Stochastic Frontier Approach, SOE – State-Owned Enterprise, TPS – Tradable Performance Standard

