

Introduction
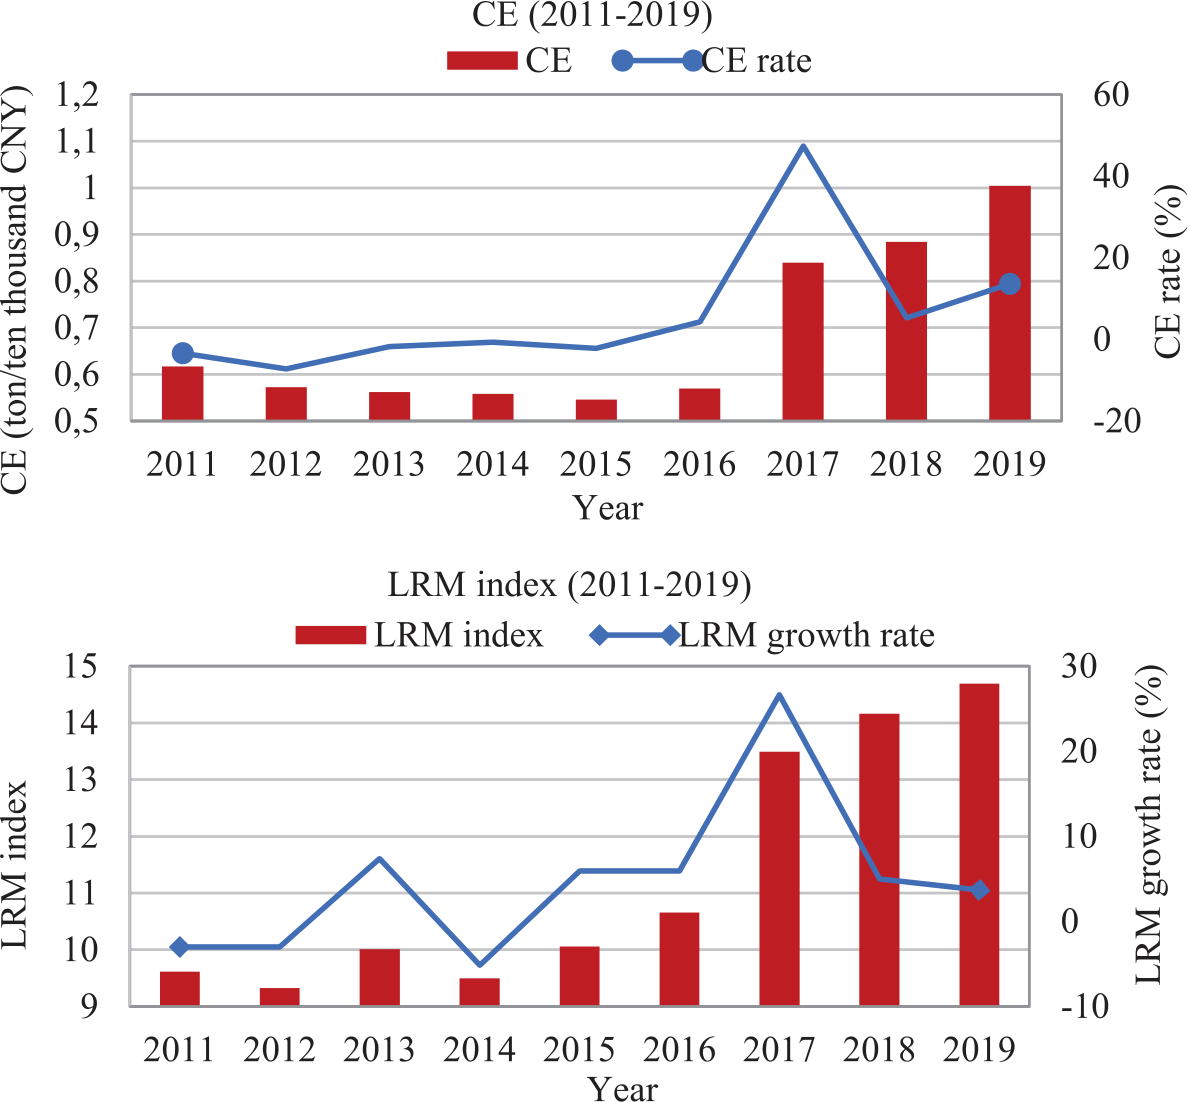
As a scarce and critical factor of production, land is vital to driving green, low-carbon, and high-quality economic development. Under China’s unique land system, local governments have generally resorted to low prices to oversupply industrial land and high prices to restrict commercial and residential land allocation in urban construction land for financial maximization and political promotion. This unique “land for development” model has contributed to China’s long-term rapid economic growth. However, this distorted urban construction land allocation has also resulted in over-industrialization during industrial development and lagging development of service industries [1]. Consequently, these have continuously increased carbon emissions (CE), inducing the highest CE of China worldwide and seriously hindering China’s ecological civilization and high-quality economic development. China’s CE per unit of GDP has increased rapidly since 2016, with a growth rate of 47.4% in 2017 (Fig. 1). At the general debate of the 75th session of the United Nations General Assembly, President Xi Jinping pointed out that China would strive to reach a CE peak by 2030 and achieve carbon neutrality by 2060. The report of the 20th National Congress of the Chinese Communist Party also clearly stated that China’s CE will peak by 2035 and then steadily decline; the ecological environment will be fundamentally improved; the goal of a “beautiful China” will be generally achieved.
Urban construction land has the most concentrated CE activity and has become the dominant land-use type for carbon sources [2-5]. However, China is currently facing serious land resource misallocation (LRM) problems. The LRM index (from Fig. 2, the ratio of average commercial and residential land prices to average industrial land prices were used to construct the LRM index) has increased significantly over time (particularly by 26.6% in 2017), with a similar overall trend to CE. Therefore, the CE effect of urban construction land use is increasingly receiving great attention from the government and academia. Thus, how does the land resource allocation approach currently adopted by local governments for urban construction land affect regional CE? What is the transmission mechanism behind it? Does the impact of LRM on CE have regional differences and spatial spillover effects? Exploring these questions is of great practical significance in effectively utilizing the role of land resources in the supply-side structural reform and enhancing the land resource allocation effect. This can facilitate controlling and reducing CE at economic growth sources and promoting green, low-carbon sustainable development of Chinese cities.
To address the aforementioned issues, this study utilizes panel data encompassing 216 Chinese cities spanning from 2011 to 2019 as its research dataset. Initially, it examines the direct influence of LRM on CE, subsequently delving into a comprehensive examination across three mechanism levels: structural, technological, and scale effects. Ultimately, it explores the utilization of threshold and spatial models, respectively.
The potential contributions of this article are: First, departing from existing studies that predominantly gauge LRM design using land area ratios [5, 6], neglecting price, a critical component of resource allocation, this study employs the ratio of average prices of commercial and residential land to industrial land to assess LRM intensity. Second, with scant literature exploring the direct influence of LRM on CE mechanisms [7], this paper offers a systematic analysis, dissecting the impact across structural, technological, and scale dimensions. Finally, recognizing the threshold effect of economic development and fiscal decentralization on the LRM-CE relationship across regions [8, 9], a threshold model is constructed. Moreover, accounting for spatial spillovers in CE and the significant inter-regional imitation dynamics of LRM behavior [1], a spatial econometric model is developed to comprehensively examine their association.
Fig. 1.
CE levels and LRM index. Data source: China Energy Statistical Yearbook, China Urban Construction Statistical Yearbook, China Land Market Network, China Statistical Yearbook, and China Urban Statistical Yearbook in 2011-2019.
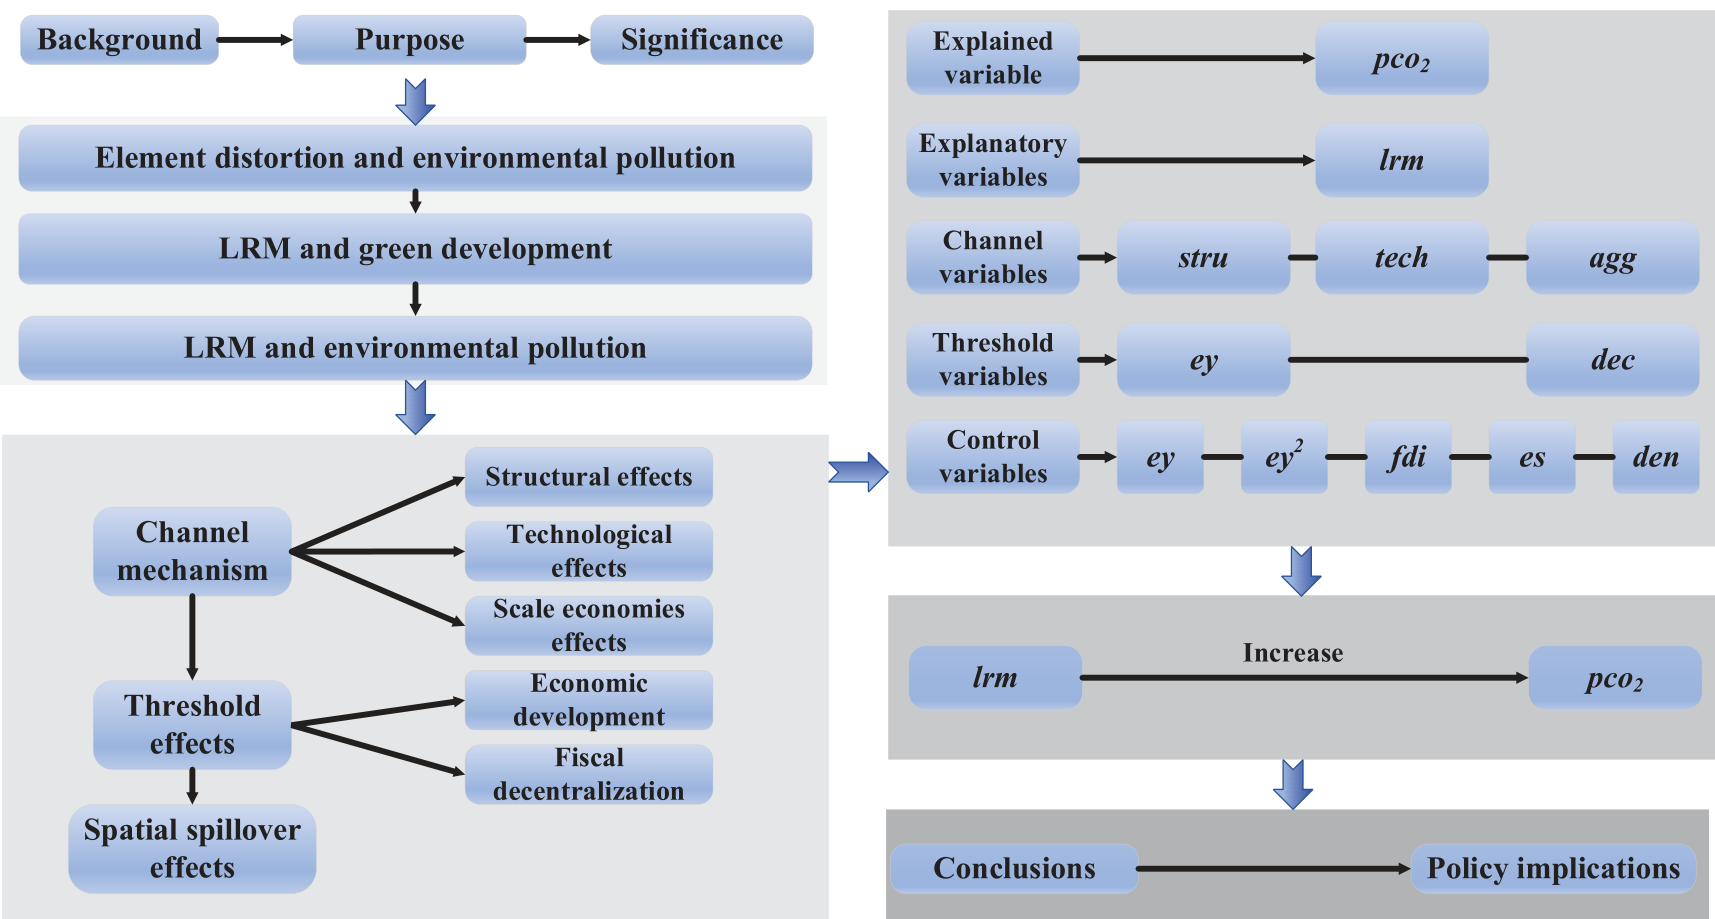
This paper is organized as follows: Following the introduction, Section 2 provides a literature review of previous studies. Section 3 explains the theoretical mechanisms and research hypotheses. Section 4 describes the model setting and data sources. Section 5 presents the analysis of the empirical results. Section 6 is conclusions and policy implications. Fig. 2 shows the analysis framework of this study.
Literature Review
Factors influencing CE have been investigated from the aspects of economic growth [10], technological innovation [11], population mobility [12], industrial structure [13], foreign direct investment (FDI) [14], corruption [15], and digital economy [16, 17]. However, the impact mechanisms on CE from the perspective of land resource allocation have rarely been studied. Specifically, relevant literature can be divided into three categories. (1) The impact of factor distortions on environmental pollution. Ji (2020) empirically analyzed the positive association between factor market distortions and industrial pollution intensity based on provincial-level panel data in China [18]. He and Qi (2021) empirically examined the impact of corporate resource misallocation on the environment and specific impact mechanisms based on firm-level data in China and found that low resource allocation exacerbated environmental pollution [19]. Based on the panel data of 30 Chinese provinces from 2003-2019, Wang and Wang (2022) found that factor market distortions impeded the elimination of backward production capacity and the transformation and upgrading of regional industrial structures, ultimately affecting regional environmental quality improvement [20]. (2) The impact of land use structure on CE. Land use structure is an important factor affecting CE. Using the panel data of 278 prefecture-level cities in China from 2000-2019, Peng et al. (2022) found that increasing urban construction land significantly contributed to CE [5]. Based on land use data from 2010-2020 in Nanjing, Wu et al. (2022) found that massive construction land expansion and industrial concentration were the main factors responsible for the significant CE increase [4]. Zhang et al. (2023) confirmed that increasing the construction land scale (especially industrial land) exacerbated regional CE directly by modeling the relationship between land use structure and CE [6]. (3) The impact of LRM on environmental pollution. Xie et al. (2022) conducted an empirical analysis using the 2006-2013 data of 277 prefecture-level and above cities in China and found that LRM constrained urban green total factor productivity and thus reduced urban environmental quality [21]. Zhang et al. (2022) showed that LRM significantly and nonlinearly exacerbated environmental pollution based on provincial-level panel data in China from 2009-2018 [22]. Using the panel data of 194 prefecture-level and above cities in China from 2006-2017, Liu et al. (2021) found that LRM significantly inhibited air quality in local and surrounding cities by inhibiting industrial structure upgrading [23]. Very few scholars have also empirically analyzed the effect of LRM on CE scale and efficiency using different data and methods [1, 7, 19, 24].
In summary, while prior research extensively explores the relationship between LRM and environmental pollution [5, 6, 21], existing indicators primarily rely on land area ratios [5, 6], overlooking the pivotal role of price in resource allocation. This paper introduces an LRM indicator centered on price. Additionally, scant literature directly addresses LRM’s impact on the CE mechanism [7]. Thus, this study investigates three mechanisms: structural, technological, and scale effects. Furthermore, existing studies are confined to basic regression and mechanism testing, neglecting potential threshold effects of economic development and fiscal decentralization across regions [8, 9]. Moreover, considering the spatial spillover effect of CE and the significant inter-regional imitation dynamics of LRM behavior [1], this article employs a threshold model and a spatial model for comprehensive analysis.
Theoretical Mechanisms and Research Hypotheses
Driven by economic and political incentives, local officials may prioritize mobilizing all available resources in their regions to promote economic growth and fiscal revenue to obtain more political achievements for rapid promotion during their limited tenure [25]. When resources flow freely enough to attain reciprocal optimality, they are considered “efficiently allocated.” However, market imperfections, externalities, public goods, and information asymmetry often result in unequal marginal returns among different entities. Deviation from Pareto optimality signifies resource misallocation. Land, as the most fundamental economic resource for local development, has become an important tool for local governments to pursue these goals. Local governments commonly adopt the optimal land sale strategy of cheaply selling industrial land to “attract investment with land” and selling commercial and residential land at high prices to “generate wealth using land”. Combined with the resource misallocation theory, the LRM behavior of local governments will inevitably affect local economic development patterns and, thus, the environmental quality.
Impact Mechanism of LRM on CE
LRM Affects CE Through Structural Effects
The impact of LRM on CE through the structural effect channel is mainly reflected in two aspects.
(1) In order to stand out in regional competition, local governments commonly engage in bottom-line competitive behavior to attract investment. However, this typically involves lowering the quality of investment attraction by using low-priced land as a primary incentive and prioritizing scale over quality in investment attraction efforts. This can lead to backward technology, poor equipment, bleak industrial development prospects, and serious environmental pollution problems (e.g., increased CE) due to duplicate capacity construction [26]. Under the pressure of performance assessment, local governments also tend to allocate limited land resources to industries that can rapidly generate more GDP and fiscal revenue, such as manufacturing, construction, and real estate, leading to the “over-industrialization” or “real estate industrialization” of the local industrial structure [27]. This industrial structure favors industry (especially heavy industry) and can inevitably increase energy consumption and exacerbate CE. Local governments’ biased allocation of large amounts of construction land to industry and its related fields at low prices can also squeeze out space for the development of modern service industries. This, together with hindered servitization of the industrial structure, has resulted in the lagging development of the service sector in the industrial structure. Modern service industries are characterized by high technological content, low energy consumption, and low CE [28]. Delayed servitization of the industrial structure can inevitably impair regional CE reduction. (2) Local governments have met their land finance needs by providing commercial and residential land at high prices and in limited quantities, excessively driving up housing prices [29, 30]. This can lead to an over-expansion of the real estate sector and promote the development of its associated industries. However, the construction industry and its upstream sectors, such as steel and cement, are almost all low-tech, energy-intensive, and high-pollution industries. Thus, this paper proposes the following research hypothesis:
Hypothesis 1.1: LRM increases regional CE by influencing industrial structure.
LRM Affects CE Through Technological Effects
It has been widely recognized that technological innovation can reduce CE [14, 31]. However, LRM exacerbates CE by inhibiting technological innovation. Firstly, when industrial enterprises can obtain industrial land at lower prices, it can lead to a situation where many enterprises with low productivity levels and low innovation capacity can also acquire more land. This may reduce incentives for industrial innovation and upgrading. Secondly, factor market distortions caused by LRM create space for firms to engage in rent-seeking activities. Firms are more motivated to obtain excess returns through rent-seeking activities compared to the uncertainty and higher risk of technological innovation outcomes. Thus, this can reduce firms’ research and development investment and is detrimental to improving their innovation capacity [21, 32]. In addition, LRM can cause many inefficient industrial enterprises with low innovation capacity to occupy many scarce land resources. This can result in an insufficient supply of commercial land and thus raise the survival cost of the commercial service sector, significantly affecting technological innovation. An insufficient supply of innovation factors and a constrained external innovation environment will impair technological innovation. Finally, due to high property prices possibly resulting from LRM, firms may invest in the real estate market to pursue high rates of return. This would crowd out firms’ capital investment in innovation, thus undermining their innovation capacity and reducing productivity [33, 34]. Consequently, CE reduction would be inhibited. Thus, this paper proposes the following research hypothesis:
Hypothesis 1.2: LRM exacerbates regional CE by inhibiting technological innovation.
LRM Affects CE Through Scale Economies Effects
From the perspective of the scale effect, local governments affect different industries or sectors mainly through the differentiated supply and allocation of land resources. This can weaken the regional agglomeration effect and thus affect regional CE. Generally, under the role of market mechanisms, enterprises will choose the optimal location for agglomeration according to the principle of efficiency. Regarding the intrinsic correlation between enterprises and enterprise behavior, this industrial agglomeration can better match local comparative advantages. This can also effectively stimulate economies of scale and technological spillover effects of agglomeration in the long term, thus promoting the technological level of production, energy conservation, and emission reduction and reducing pollutant emissions (e.g., carbon dioxide) [35, 36]. However, motivated by political promotion and financial maximization, local governments compete to lower industrial land prices and expand the scale of industrial land concessions to attract investment. This can reduce the land cost and investment risk of enterprises in the region, resulting in extensive regional enterprise agglomeration due to “policy rent”. This “pile-up” of enterprises does not follow market rules and directly results from artificial factor price distortion, inhibiting the reflection of the principle of land scarcity and optimal productivity. This can weaken the internal linkages and synergistic development of regional industries and enterprises, reduce economic agglomeration effects [37], cause low-level duplicate investment and resource waste in industries, and impede the formation of diversified agglomeration characteristics [38]. These all can exacerbate CE. In addition, the use of land to generate wealth by local governments has driven up the land price in the commercial service sector, raising the production and operating costs. This is detrimental to its full agglomeration and effective exertion of agglomeration effects. The full development and agglomeration of the commercial service sector can typically improve environmental quality [36]. Thus, this paper proposes the following research hypothesis:
Hypothesis 1.3: LRM exacerbates regional CE by weakening industrial agglomeration.
Threshold Effects of LRM on CE
The effect of LRM on regional CE may vary with local conditions due to the variability in economic and social development.
Economic Development Effects
Due to policy preferences, geographical location, and resource endowments, there are significant imbalances in regional development levels in China. Local governments at different economic development stages face different fiscal constraints [8], which in turn can affect the behavioral decisions of local governments. In regions with higher economic development levels, local governments tend to face less fiscal pressure. In addition to focusing more on the strategic choice of industries in the direction of land resource allocation, they also integrate higher social and ecological development goals [39]. In these regions, energy conservation and emission reduction will have an increasingly higher weight in the officials’ performance assessment system, prompting local governments to increase environmental protection expenditures. In contrast, in regions with relatively backward economic development, local governments have an “inequality aversion” mentality. Their core goal is economic development, which can facilitate regional economic performance [8]. Consequently, local governments tend to attract investment by lowering the industrial land price, competing to lower investment quality, relaxing environmental regulations, and allocating land resources to manufacturing, especially heavy industry and real estate projects that can bring immediate and high tax revenues [40]. From a societal perspective, as the income level of a region increases, public environmental awareness also increases [41], thus improving regional environmental quality. Based on the above analysis, this paper proposes the following research hypothesis:
Hypothesis 2.1: The impact of LRM on CE will only diminish when regional economic development reaches a high level.
Fiscal Decentralization Threshold Effects
Fiscal decentralization refers to the ability of local governments to dispose of financial resources autonomously. A higher decentralization degree means that local governments gain more fiscal freedom to maximize regional interests [42]. In order to promote economic growth and expand fiscal revenue, local governments usually implement a land resource allocation model aimed at “investment attraction” by offering industrial land at low prices and “land finance” by offering commercial and residential land at high prices. With a higher regional fiscal decentralization degree, local governments can achieve a higher revenue self-sufficiency ratio and are more motivated to grant industrial land cheaply and excessively and commercial land at high prices and in limited amounts. This can inevitably exacerbate environmental pollution problems, such as CE [9]. In order to maximize profits, local governments are more inclined to develop the economy than to focus on environmental quality issues. This, together with the prevalence of “free-riding” in environmental governance, further leads to ineffective environmental governance by local governments [43, 44]. Since local fiscal expenditures are mainly borne by the central government, a low regional fiscal decentralization degree may reduce the motivation of local governments to engage in LRM and facilitate their compliance with central policies regarding the implementation of industrial and environmental policies [45]. This is conducive to promoting environmental pollution management and reducing local CE levels. In conclusion, fiscal decentralization will indirectly change the behavior of local governments by introducing government incentives, which will affect the regional environment. Based on the above analysis, this paper proposes the following research hypothesis:
Hypothesis 2.2: The impact of LRM on CE will vary with the regional fiscal decentralization degree.
Spatial Spillover Effects of LRM on CE
As land is an important tool for local governments to make profits or compete with other local governments, inter-regional mutual learning and imitation of land concessions exist, leading to a “demonstration-imitation” diffusion mechanism of LRM behavior across regions [7, 46]. As an externality factor in economic development, CE is influenced by natural climatic conditions, factor flows, and industrial transfers and thus has a more significant spatial correlation effect [30, 47]. Therefore, this paper further investigates the spatial effects of LRM on CE.
From the spatial correlation perspective, neighboring LRM can affect local CE. Neighboring LRM may increase local CE levels through spatial spillover effects while exacerbating their own CE. “Competition for growth” may cause local governments to interact spatially in their land resource allocation strategies, i.e., a local government will adjust its land concession strategies according to its competitors’ behavior. Thus, this can trigger local governments to imitate each other in their land allocation strategies and develop a strategic interaction pattern. The strength of such interactions is closely related to “distance”: the closer the “distance”, the stronger the interaction [7]. Based on the above analysis, this paper proposes the following research hypothesis:
Hypothesis 3: LRM in neighboring regions can lead to imitation and competition, thus exacerbating local CE.
Method and Data
Econometric Models
The above theoretical analysis (Section 3) shows an inherent logical relationship between LRM and CE. In order to reliably characterize the direct impact of LRM on CE, this article refers to the approach of Zhou et al. (2022) [1] and constructs the following model:
where i denotes the city; t denotes the year; pco2, lrm, and Z denote the CE level, the LRM degree, and the control variables of the model, respectively; ηi, ξt, and μit denote the unobservable regional effects, time effects, and random disturbance terms, respectively. The above mechanism analysis also indicates that LRM may affect CE by acting on industrial structure, technological innovation, and industrial agglomeration. In order to test the existence of Hypotheses 1.1-1.3, the following intermediate mechanism test model was constructed to further identify the transmission channels that generate the effects, drawing on Peng et al. (2022) and Xie et al. (2022) [5, 21]:
Where M denotes intermediate variables, including industrial structure (stru), technological innovation (tech), and industrial agglomeration (agg); β and χ are coefficients; π and τ are random disturbance terms.
Hypotheses 2.1 and 2.2 suggest that the impact of LRM on CE may have economic development level and fiscal decentralization threshold effects. In this paper, the partition function of LRM on CE was constructed by taking the regional economic development level (ey) and fiscal decentralization (dec) as unknown variables [22]. Taking the existence of a single threshold effect as an example, the following threshold model was constructed:
where th is the threshold variable, θ is the threshold value, and I(·) is the corresponding indicator function. Multithreshold models can be obtained by extending Eq. (4). Since CE is a dynamic and continuous process, this paper adopted a panel threshold for empirical analysis.
CE has significant spatial spillover characteristics, and there are also significant imitative strategic interactions among local governments in land resource allocation decisions. Thus, this spatial correlation should be considered to construct the econometric model in order to test Hypothesis 3. Local CE can also affect inter-regional CE due to its temporal dynamics, and the time and spatial lag terms of CE were introduced into the model. In order to analyze the influence of neighboring LRM on local CE, the spatial lag term of neighboring LRM indicators was also introduced into the model. In addition, the spatial Durbin model (SDM) is a general form of the spatial lag model (SAR) and the spatial error model (SEM). In this paper, a dynamic spatial Durbin model based on dynamic spatial panel estimation was used to examine the impact of LRM on CE [22]:
where Wpco2it and Wlrmit denote the spatial lag terms of pco2 and lrm, respectively, and W is an N×N dimensional spatial weights matrix including three types of weights: geographical, economic, and mixed. Geographical weight matrix Wd = 1/d2ab, a≠b, otherwise, 0; economic weight We = 1/|gdpa-gdpb|, a≠b, otherwise, 0; and mixed spatial weight matrix Wm = Wd·We.
Data Selection
The panel data of 216 prefecture-level and above cities in China from 2011-2019 in mainland China except Tibet were mainly obtained from the China Urban Statistical Yearbook, the China Urban Construction Statistical Yearbook, and the China Land and Resources Statistical Yearbook. All price-related indicators were adjusted for urban data using provincial-level price indices from the China Statistical Yearbook. Detailed descriptions of the indicators and measures are presented as follows, and the descriptive statistics of each variable are shown in Table 1.
1. Explained variable (pco2). The CE level (pco2) was expressed as the amount of CE per unit of GDP in each region. CE from direct energy consumption can be obtained by multiplying the consumption of different energy sources in the China Energy Statistics Yearbook by the corresponding CE coefficients from the United Nations Intergovernmental Panel on Climate Change in 2006. In terms of indirect CE: the amount of CE from electricity was obtained by multiplying the baseline emission coefficient of each regional grid with the amount of consumed electricity in each city; the amount of raw coal used as the main thermal energy source in each city can be obtained, and then the amount of CE from heat supply was measured according to the emission coefficients provided by the IPCC (2006) using the thermal efficiency, the raw coal heat release rate and the heat amount in the China Urban Construction Statistical Yearbook; the amount of CE by urban transport can be measured by calculating the energy consumption per unit of passenger and freight volume of different traffic modes according to the China Statistical Yearbook, and then multiplying the energy consumption by the passenger and freight volumes in the China Urban Statistical Yearbook. Finally, the total amount of regional CE can be obtained by summing up the amount of CE from various energy consumptions. In the subsequent robustness tests, the above CE level indicator was replaced by per capita CE (rco2).
2. Core explanatory variables (lrm). Drawing on Han and Huang (2022) [7], this paper used the LRM index (lrm) to measure regional LRM degree. Based on land sale information from the China Land Market Network, data on each commercial and industrial land transaction during the study period were collected, collated, and then summed at the city level. The ratio of average commercial and residential land prices to average industrial land prices was used to construct the LRM index.
3. Control variables. To address estimation bias due to omitted model variables, relevant control variables Z were included in this paper. (1) Economic development level and corresponding squared terms (ey and ey2): measured by real GDP per capita and its squared term, respectively [48]. (2) External openness (fdi): measured by the share of FDI in local GDP [49]. (3) Environmental regulation (es): measured by the ratio of environmental protection expenditure to local general public budget expenditure [50]. (4) Population density (den): expressed by the number of people per unit local area [16].
Table 1.
Descriptive statistics of variables.
(5) Fiscal decentralization (dec): measured by the ratio of general budget revenue to local fiscal expenditure [51].
4. Intermediate variables. (1) Industrial structure (stru): since China is still undergoing industrialization, the industrial energy consumption scale is significantly higher than that in other national sectors. The rapid development of the real estate market has also driven the demand for construction and its upstream and downstream heavy energy consumption products such as steel and cement. These lead to large amounts of fossil energy consumption and pollution emissions. Therefore, drawing on Wang and Liu (2022), the value added of the secondary sector (including industry and construction) as a share of GDP was selected to reflect the industrial structure [14]. (2) Technological innovation (tech): the impact of different categories of technological innovation on CE varies. In particular, green technological innovation, as the progress on clean technology, can significantly reduce resource and energy consumption and pollutant emissions and thus effectively control CE [52]. Drawing on Li et al. (2022), this study used the International Classification Code for green patents listed in the World Intellectual Property Organization (WIPO) database to manually obtain green patent data of each city from the patent platform of the State Intellectual Property Office (SIPO) in order to measure regional technological innovation levels [49]. The patent type, classification code, and organization address were specified as search parameters.
(3) Industrial agglomeration (agg): various methods are available to measure industrial agglomeration. In particular, the location quotient method has unique advantages in eliminating regional scale differences and reflecting spatial distribution characteristics in detail. Manufacturing is an important CE source in China. Thus, drawing on Fan et al. (2023), this paper selected manufacturing agglomeration characterized by location quotients to measure the industrial agglomeration level [36].
5. Threshold variables. (1) Economic development level (ey): as described above; (2) fiscal decentralization (dec): as described above.
Results
Analysis of Baseline Regression Results
To effectively control endogeneity and weak instrumental variables in the dynamic panel data models, this paper used a two-step systematic generalized method of moments (GMM) for empirical testing. A stepwise regression method with the sequential addition of control variables was also used in the empirical test to achieve robust estimation results. From Table 2, the estimation results show that AR(2) statistics did not reject the original hypothesis of “no autocorrelation in the nuisance term” at the 10% significance level, indicating no second-order serial correlation. The p-value of the Sargan test indicates that the instrumental variables were suitable for the model, and the model estimates based on the systematic GMM approach can be considered valid. The estimated coefficients and significance of the variables in Models 1~6 were similar, indicating robust model regression results. After controlling for the relevant variables, the estimated coefficient of LRM (lrm) in Model 6 was significantly positive at 1%. This indicates that land resource allocation distortion by local governments exacerbated regional CE, which validates the findings of Zhou et al. (2022) [1]. The coefficient of the time lag term of CE (pco2t-1) was also significantly positive, indicating a significant inertia effect of regional CE with time path-dependent characteristics, i.e., if the amount of CE is at a high level in the current period, then the CE level may continue to increase in the next period [7]. This phenomenon predominantly stems from China’s hierarchical political governance system and land-centric development model. Local governments often pursue a “two-pronged land supply” strategy, characterized by abundant sales of industrial land alongside constrained residential land offerings, leading to industrial land overexpansion. This distorted land factor market shields industries with obsolete production capacity, heightened resource consumption, significant pollution, and low production efficiency from elimination, consequently fostering substantial pollution [20].
In terms of the control variables, the coefficient of the primary term (ey) for the effect of the economic development level on CE was significantly negative, while the coefficient of the secondary term (ey2) was significantly positive. This indicated a U-shaped relationship between economic growth and CE and thus did not satisfy the classical environmental Kuznets curve (EKC) hypothesis, indicating that China has not yet “decoupled” economic growth from CE. This is consistent with the findings of Sun et al. (2021) [10]. In practical terms, most regions in China (particularly the central and western regions) are still in the stage of accelerated industrialization, indicating that it is challenging to achieve the twin goals of economic growth and CE reduction. The coefficient on environmental regulation (es) was significantly negative, suggesting that government environmental regulation effectively suppressed CE; this is similar to the research conclusion of Li et al. (2022) [50]. The coefficient on the effect of opening up to the outside world (fdi) was positive but insignificant, this may be attributed to the concentration of FDI projects in industrial sectors, which inherently generate pollution [49]. The coefficient on fiscal decentralization (dec) was significantly positive, suggesting that fiscal decentralization gave local governments more freedom, which may favor development and relax the level of environmental access and regulation [44]. The coefficient on population density (den) was positive but insignificant for CE. This may be attributed to the scale effect and agglomeration effect of population density on environmental pollution, with the former exacerbating environmental pollution and the latter mitigating it [53].
Table 2.
Baseline regression results.
[i] Note: Robust standard errors are shown in parentheses for each variable; ***, ** and * denote significance levels at 1%, 5% and 10%, respectively; AR(1) and AR(2) indicate the first-order and second-order autoregressive (AR) models, respectively; AR(1), AR(2) and Sargan test values are given as the p-values corresponding to the statistics.
To ensure the robustness of the above regression results, this paper also used the amount of CE per capita (rco2) as a CE level indicator for robustness testing. After the explanatory variables were replaced, the estimation results were generally consistent with Table 2. Thus, we can conclude that LRM has a significant effect on CE.
Analysis of Impact Mechanisms
The theoretical mechanism in this paper shows that LRM can exacerbate regional CE by influencing industrial structure, inhibiting technological innovation, and weakening industrial agglomeration. This paper tested the mechanism by using LRM to regress industrial structure (stru), technological innovation (tech), and industrial agglomeration (agg), respectively, and then further regress CE using these three channels. The mechanism test results are shown in Table 3.
From Table 3, the regression coefficient of LRM (lrm) on industrial structure (stru) was positive and passed the significance test at 1%. The coefficient of industrial structure on CE was also significantly positive. This suggests that biased land resource allocation modes of local governments commonly lead to the over-industrialized and real estate-oriented regional industrial structure, with a disproportionately high share of secondary industries [22, 54]. This can inhibit industrial structure optimization and upgrading and thus exacerbate regional CE. The coefficient of LRM (lrm) on technological innovation (tech) was significantly negative, and the coefficient of technological innovation on CE was negative and passed the significance test at 1%. This indicates that LRM significantly inhibited regional technological innovation and did not facilitate the full realization of the positive impact of technological innovation on CE reduction; this is similar to the research results of He and Du (2021) [55], verifying Hypothesis 1.2. The coefficient of LRM (lrm) on industrial agglomeration (agg) and the coefficient of industrial agglomeration on CE were both significantly negative, indicating that LRM exacerbated regional CE by weakening the regional industrial agglomeration effect. This may be because diversified agglomeration increases the CE of local and surrounding cities, this phenomenon may arise from the enhanced agglomeration of diversified industries, leading to increased competitiveness among local and neighboring cities [35]. This finding verified Hypothesis 1.3.
Table 3.
Intermediate mechanism regression results.
Analysis of Threshold Effects
Before the threshold test, we calculated the F-test and threshold confidence interval of the corresponding threshold significance test. The impact of LRM on CE exhibited a single threshold effect for both the economic development level threshold and the fiscal decentralization threshold, and both passed the F-test at the significance level of 1%.
Table 4 shows the estimation results of the threshold effects of the economic development level and fiscal decentralization. The coefficients of lrm were all significantly positive at different economic development levels, but the effect decreased as the regional economic development level increased. This also confirmed Hypothesis 2.1, suggesting a more pronounced threshold effect of economic development level on the impact of regional LRM on regional CE. The LRM phenomenon may become more serious when local governments in regions with more backward economic development are more eager to pursue economic development [24]. They tend to adopt various measures, including lowering environmental regulation standards at the expense of the environment, reducing the screening of industrial enterprises, and allocating land resources within their jurisdictions to manufacturing and real estate projects that can generate more GDP and fiscal revenue. This can inevitably increase CE [53].
For fiscal decentralization, the coefficients of lrm were 0.013 at dec≤0.47 and 0.003 at dec>0.47. They both passed the significance test, indicating that the fiscal decentralization degree affected local governments’ behavior in LRM [44], in line with Hypothesis 2.2. This may be because local fiscal expenditure depends more on central fiscal support at a low regional fiscal decentralization degree; local governments have weak incentives to increase fiscal revenue through LRM and are more likely to align with central policies in implementing industrial and environmental policies [45]. This is conducive to reducing local CE. However, with a high regional fiscal decentralization degree, local governments have more financial freedom and fewer motivations to save energy and reduce emissions. This may stimulate local governments to obtain more fiscal revenue by distorting land resource allocation. The probability of LRMs introducing high-polluting industries is higher [23], thus exacerbating regional CE.
Analysis of Spatial Spillover Effects
Before conducting the spatial regression analysis, this paper first tested the spatial correlation of CE using Moran’s I index. Most cities were located in the typical observation areas during the study period, indicating significant spatial agglomeration of regional CE in neighboring areas. Local CE was closely related to the CE level in neighboring areas, driven by natural and anthropogenic factors.
In order to verify the SDM applicability, likelihood-ratio (LR) tests were conducted, and all p-values were less than 0.01. Wald tests were also conducted. The p-values in the test of whether SDM could degenerate to SAR were all less than 0.01, indicating SDM was rejected to degenerate into SAR and SEM. Combined with the Hausman test, the fixed-effects SDM was selected to estimate the spatial spillover effect of LRM on CE.
Table 5 presents the results of the estimated spatial effect of LRM on CE based on the dynamic SDM estimation. The coefficients of the indirect effects of LRM in Columns (2), (5), and (8) were all significantly positive, whether under economic, geographical, or economic-geographical weight, indicating that LRM from neighboring regions promoted local CE. This may be because local government officials are driven by dual incentives and are keen to use land as a target policy tool; there are significant spatial strategic interactions and imitations of land concession policies between regions [55]; particularly, LRM in neighboring regions can exacerbate local CE, which has strong spatial correlations, further aggravating local CE. This also verified Hypothesis 3.
Table 4.
Estimated threshold effects.
Following the aforementioned tests, the spatial impact of LRM on CE, as estimated by the spatial Durbin model (SDM), is presented in Table 5. Across economic geography, economic, and geographical matrices, the indirect effect of LRM exhibits significant positivity, indicating an interaction effect among adjacent cities. This study decomposes spatial spillover effects into direct, indirect, and total effects, employing partial differentials to elucidate LRM’s impact on CE in neighboring areas. For instance, considering the geographical matrix, the indirect effect of LRM on CE yields a coefficient of 0.004, passing the 1% significance test; similarly, for the economic matrix, the coefficient stands at 0.002, also passing the 1% significance test. Moreover, the coefficient of LRM in the total effect is 0.006, passing the 1% significance test. These findings suggest that LRM not only significantly enhances local CE but also exacerbates CE in neighboring areas. This may be because local government officials are driven by dual incentives and are keen to use land as a target policy tool; there are significant spatial strategic interactions and imitations of land concession policies between regions [55]; particularly, LRM in neighboring regions can exacerbate local CE, which has strong spatial correlations, further aggravating local CE. This also verified Hypothesis 3.
Among the control variables, instances occur where the indirect effect surpasses the direct effect, notably observed in the squared terms of economic development level and environmental regulation level. Conversely, for other variables, the indirect effect is smaller than the direct effect, highlighting the necessity to enhance regional coordination in LRM. Specifically, the significant coefficient of the economic development level (-0.654) suggests that elevating local economic development can mitigate CE in neighboring areas. However, China has yet to achieve the desired “decoupling” of economic growth from CE, evident in the significantly positive indirect effect of the squared term of economic development (ey2) [10]. Notably, the significant coefficient of environmental regulation (0.043) indicates that stringent regulations may prompt the relocation of polluting enterprises, exacerbating CE in surrounding regions [50]. Conversely, the negative coefficient of direct foreign investment (-0.049) implies that attracting foreign-invested enterprises locally can diversify land resource usage in neighboring cities, thereby reducing CE [49]. Similarly, the negative coefficient of fiscal decentralization (-0.005) suggests that local fiscal autonomy may incentivize relaxed environmental regulations, potentially attracting polluting enterprises from neighboring regions [44]. Conversely, the insignificant coefficient of population density may stem from differences in scale and agglomeration effects between local and neighboring cities [53].
Heterogeneity Tests
In November 2013, the Third Plenary Session of the 18th CPC Central Committee adopted the Decision of the CPC Central Committee on Several Major Issues of Comprehensively Deepening Reform. The decision highlighted the need to actively and steadily promote factor market-oriented reforms in terms of breadth and depth and significantly reduce direct resource allocation by the government. Considering the significant differences in the corresponding policies before and after the study period, this paper divided the full sample into two periods (i.e., 2011-2013 and 2014- 2019) to explore the differences in the impact of LRM on CE, respectively. The estimation results are shown in Columns 2 and 3 of Table 6. The impact of local LRM (lrm) on CE (pco2) was significant in the two periods, with impact coefficients of 0.008 and 0.005, respectively. The coefficient decreased in the latter series. This may be because various policy measures have been introduced by the central government to reform market-based land factor allocation in recent years; thus, land granting by local governments has been further regulated, and the structural imbalance in granting urban construction land has been mitigated [55]. Decreasing LRM degrees was also conducive to reducing CE.
Table 5.
Analysis of the spatial effect of LRM on CE.
[i] Note: P-values are shown in square brackets [ ]. The average direct effect (LR_D), average indirect effect (LR_I) and average total effect (LR_T) are separately reported for each explanatory variable; where W, E and EW are the geographic, economic and geographic-economic mixed weight matrixes, respectively.
Table 6.
Analysis of time series and regional heterogeneity.
Considering the differences in land resource endowments and policies across regions, further analysis was conducted from the perspective of regional heterogeneity in East, Central, and West China, respectively. It is found that LRM significantly increased CE in these regions. Nevertheless, the adverse impact is particularly pronounced in the eastern and central regions. This can be attributed to several factors: First, cities in these regions harbor significant industrial and economic hubs, with tighter land supply and stricter controls, leading to a more pronounced marginal crowding-out effect of industrial transformation and technological innovation compared to their Western counterparts. Secondly, the relatively underdeveloped industrial base and economic status of western cities intensify spatial interaction and competition among local governments to activate the “land engine,” resulting in regional heterogeneity in the effect of LRM on CE, again verifying the existence of Hypothesis 1.
Conclusions
From the perspective of market-based land resource allocation, this paper systematically elaborated the theoretical mechanism by which the biased land resource allocation approach in China’s urban construction land affects regional CE. Then, using the data samples of 216 cities in China from 2011-2019, we empirically tested the impact of LRM on regional CE in multiple dimensions using econometric methods such as dynamic panel threshold and spatial dynamic panel models. The results show that (1) LRM exacerbated regional CE [22], but this effect was moderated as the reform of market-based land factor allocation advanced; (2) industrial structure, technological innovation, and industrial agglomeration were three important transmission mechanisms of LRM’s impact on CE; this verifies the research conclusions of Ma et al. (2021) and He and Du (2021), respectively [24, 55]; (3) there were also significant threshold effects of economic development level and fiscal decentralization on LRM’s impact on CE; (4) LRM’s impact on regional CE had a significant spatial spillover effect.
The findings in this paper can provide some important policy insights for China to promote urban green and low-carbon sustainable development, accelerate ecological civilization, and realize the vision of a beautiful China. (1) Government departments should deeply promote the reform of market-based land factor allocation to effectively reduce the impact on CE due to distorted land resource allocation. Government departments should also fully utilize the decisive role of the market in land resource allocation, enhance the land market’s competitiveness, and integrate the synergy of market-led and government-led approaches. The government should coordinate the transfer of urban construction land increment with stock and gradually establish a national unified secondary market for the transfer, lease, and mortgage of construction land use rights, as required by the Opinions of the Central Committee of the Communist Party of China State Council on Accelerating the Construction of a National Unified Market. (2) This paper shows that the impact of LRM on CE exhibited a significant economic development level and fiscal decentralization threshold effect. Thus, in adjusting land resource allocation methods, government departments should fully consider economic development and fiscal decentralization in different regions, formulate adjustment plans and determine adjustment strengths according to time and place, and steadily and orderly promote the reform of market-oriented land factor allocation. Government departments also need to improve the inter-regional trading mechanism of surplus indicators for linking urban and rural construction land increases and decreases, implement the ecological function zoning and compensation system, coordinate ecological protection costs between regions, and promote inter-regional coordinated development through development benefit sharing and ecological fiscal transfer.
(3) Government departments should establish a regional collaboration mechanism to promote CE reduction and form a regional synergy for ecological civilization. Due to the regional agglomeration characteristics and spatial spillover effects of CE, it is challenging for local governments to fight alone to achieve regional low-carbon economic development. It is imperative to build a regional community for green and low-carbon development. Based on continuing to strengthen the concept of ecological civilization and unified development ideas among local government officials, government departments should actively explore mutual credit enhancement mechanisms and build an information-sharing network for energy conservation and emission reduction. Thus, inter-regional synergistic carbon reduction can be achieved.
Although this research has made some progress, it is not without limitations. Firstly, focusing solely on China restricts generalizability, as LRM may also be present in other developing nations. Incorporating data from multiple countries would enhance the realism of the conclusions drawn. Future endeavors will aim to investigate the international dynamics of the relationship between LRM and CE. Secondly, while this paper underscores the significance of structural, technological, and agglomeration effects in this relationship, it acknowledges the potential influence of related land or CE policies on outcomes. Subsequent studies will delve into existing policies to discern their impact on the LRM-CE relationship.

