

Introduction
Chinese fir (Cunninghamia lanceolata) is extensively cultivated as a man-made forest species, especially in China, because of its quick growth, high yield, and superior-quality lumber [1]. In 2019, the area covered by Chinese fir (CF) plantations exceeded 10.96 million hectares, which has been continuously increasing with time [2]. Guangxi has grown to be one of the provinces in China with the greatest planting area of CF plantations due to its distinct climate and geographical conditions [3]. However, there is a serious long-term problem in which the productivity of CF plantations in Guangxi has been at a low level. For example, the volume per hectare of CF plantation in Guangxi is only 64 m3, which is only 67.36% of the national average of 95 m3 and only 48.85% of the global average of 131 m3 [4]. The Guangxi government has launched various kinds of conservation measures in response to the aforementioned issue. As we all know, maintaining soil fertility has been highlighted as a crucial strategy for the long-term growth of CF plantations [5]. Among them, sustaining the transformation and utilization of soil total nitrogen (TN) and especially labile nitrogen (LN) fractions through cycling is an efficient strategy to increase the sustainability of CF plantations [6].
Nitrogen (N) is one of the most important elements across terrestrial ecosystems [7]. Soil TN and LN fractions were significant predictors of soil fertility and plant supply needs [8]. Among them, soil LN is directly related to forest ecosystem productivity and is the most active part of N cycling [6]. To be specific, compared with the TN, the LN fractions may be more responsive to plant demands and soil N cycling, which was attributed to LN fractions having the characteristics of easy mineralization and decomposition, as well as a short turnover period; more crucially, they can be directly absorbed by plants [6]. The LN fractions are active fractions of soil N, which include particulate organic nitrogen (PON), alkali-hydrolyzable nitrogen (AN), microbial biomass nitrogen (MBN), ammonium nitrogen (NH4+-N), and nitrate nitrogen (NO3--N). Based on the characteristics of LN fractions, it can be determined that the active part is a remarkable method to reflect soil N cycling and forest ecosystem productivity [9].
Notably, the research on soil LN in different ecosystems has been gradually carried out, but these studies mostly stay on the bulk soil, and there are few studies on soil LN based on the perspective of soil aggregates. Soil aggregates are complex ensembles consisting of primary particles and organic matter (OMs), which are the fundamental units of soil structure [10]. Generally, micro-aggregates (<0.25 mm) are generated when primary particles and persistent binders combine to form aggregates [11, 12]. When micro-aggregates are further aggregated with temporary binders, large aggregates (>0.25 mm) will be formed [13]. From the above, because of the different characteristics of different aggregates, different size aggregates present specific abilities to adsorption, storage, and transformation capabilities for soil N [14]. Soil aggregate stability is an essential indication of soil N storage and nutrient cycling [15]. Meanwhile, several studies have found that the distribution of soil aggregate is essential for soil nutrient availability and retention [16- 19]. Consequently, in order to better understand how soil structure influences soil N balance and cycling in forest ecosystems, it is important to research the distribution of TN and LN fractions at the aggregate scale. Our early research on the transformation of CF plantations by returning farmland to forest showed that stand age was beneficial to enhance soil structure and promote the accumulation of laible organic carbon (LOC) fractions during the development of CF plantations [16]. Recent studies have also shown that with the increase in stand age, the effectiveness of soil N increases, which is conducive to the circulation of soil N. Nevertheless, most of the small amount of relevant studies still stay on the bulk soil, and the response of stand age to the dynamic changes of soil TN and LN fractions from aggregate perspectives is still relatively lacking [20]. Therefore, the purpose of this study was to investigate the changes of TN and LN fractions in various soil aggregates (>2, 2-1, 1-0.25, and <0.25 mm) in 0-, 9-, 17-, and 26-year-old CF plantations. Here are three hypotheses we developed: (i) soil N is primarily accumulated in micro-aggregates because of its greater specific surface area, which could promote OM adsorption [16]; (ii) soil N is enriched within 17-year CF plantations because the stability of soil aggregates was the highest in these plantations [16, 21]; (iii) stand age influences soil N by changing aggregate composition.
Materials and Methods
Study Sites and Experimental Design
This study site (coordinate: 108.900°E, 25.133°N) was located in Liuzhou City, Guangxi, China (Fig. S1). This experiment began in June 2019, and the experimental location information from our earlier study [16, 17] has been detailedly reported. The subtropical monsoon climate dominates this region, featuring a yearly mean temperature and precipitation of 18.8ºC and 1824.8 mm, respectively. The landform was mainly composed of low hills and mountains, with altitudes and gradients ranging from 500 to 900 m and 18 to 23°, respectively. This study region’s exposed soil layer was primarily formed during the Mesozoic, and the soils are loamy clay krasnozem and latosol types [22]. A near-natural management model has been chosen to reduce human interference during the development of CF plantations. Furthermore, the undergrowth vegetation is dominated by Allantodia metteniana, Cibotium barometz, and Allantodia hachijoensi. In this study, the approach of “space-for-time” was employed to investigate the effect of CF planting stand ages on soil aggregate-related N [23]. However, the spatial variation of soil may have some confounding effects. As a result, we sought to reduce these effects by selecting CF plantations of different ages (0, 9, 17, and 26 years) with similar geomorphic units. Specifically, this experiment conducted a completely randomized block design on twelve plots (S = 20 m × 20 m) with four treatments (i.e., one treatment for each stand age) and three replicates per treatment. To minimize spatial self-correlation and avoid pseudo-replication, the distance between these plots exceeds 800 m.
Soil and Litter Sample Collection
Five different sub-plots were set in each quadrat according to the “S” shape, and the specific sampling position was set below the edge of the canopy. Then, the 1 m2 (S = 1 m × 1 m) litter samples were taken from the soil surface of each sub-plot (a total of 5 litter samples in each plot) and then combined into one blended litter sample. For each plot, five soil samples were obtained from five sub-plots utilized for litter sample collection, and these soil samples were mixed together to merge into one blended soil sample. Finally, the litter samples and soil samples in each square were mixed and brought back to the laboratory for pretreatment. Twelve blended litter samples (4 stand ages × 3 replicates) were collected and dried at 80ºC until their weight became constant. Following the dry weight, the carbon and N contents of these blended litter samples were measured. In addition, twelve blended soil samples (4 stand ages × 3 replicates) were gently broken into natural aggregates along the natural structure and subsequently processed via a five-millimeter sieve to eradicate plant roots, macro-fauna, and small stones. In addition, a portion of the sieved soil samples was utilized to determine the bulk soil properties (Table 1 and Fig. 1), and another portion was utilized for aggregate separation.
Soil Aggregate Classification
In this study, the optimum moisture sieving approach was used to classify soil aggregates that had less influence on soil aggregate structure and soil chemical properties than dry sieving and wet sieving [24, 25]. Specifically, we placed the collected fresh soil (<5 mm) in 4ºC for cool-drying, resulting in soil with appropriate soil moisture (about 60 g kg-1), and then placed 300 g of cold-dried soil through 2, 1, and 0.25 mm continuous sieves. Vertical oscillation was performed at an oscillation rate of 1 s−1 and an amplitude of 50 mm for 15 minutes to obtain coarse macro- (>2 mm), medium macro- (2-1 mm), fine macro- (1-0.25 mm) aggregates, and micro-aggregates (<0.25 mm). Subsequently, soil aggregate-related TN and LN fraction contents were determined.
Soil Chemical Property Analyses
We used a cutting ring to measure bulk density and detected soil pH using a pH electrode in a l:2.5 with a soil/water ratio (weight:volume) [26]. The soil TN contents were examined through the micro-Kjeldahl methods [27]. The alkali-hydrolysis and diffusion methods were used to detect soil AN contents [26]. Soil PON contents were determined by the 5 g/L sodium hexametaphosphate extraction method [28]. The chloroform fumigation extraction method was used to detect soil MBN contents [26]. The multi-N/C 2100 S CN analyzer was used to conduct analyses on fumigated and non-fumigated extracts (Analytik Jena, Germany). The contents of soil NH4+-N and NO3--N were abstracted through KCL solution and then detected with the continuous-flow analyzer (Skalar Analytical, Breda, The Netherlands) [26].
Date Analysis
Kemper and Chepil’s [29] formula was applied to calculate soil mean weight diameter (MWD, mm). The formula of Nimmo and Perkins [30] was used to calculate soil geometric mean diameter (GMD, mm).
Table 1.
Litter and soil properties in Chinese fir plantations with different stand ages.
Where Xi denoted the ith size aggregate’s mean diameter, ‘Wi’ and ‘Mi’ denoted the proportion and mass proportion of the ith size aggregate in bulk soil.
The following formula was used to compute soil TN stocks (g m−2) [31]:
Where TNi denotes the ith aggregate’s TN contents, Bd denotes soil bulk density, and H represents the soil depth. Similarly, the stocks of soil LN fractions were also calculated.
All the results were presented as means ± standard error (n = 3). The impact of CF stand age on litter and soil physical and chemical properties was investigated by SPSS 22.0 with one-way ANOVA and Duncan’s new multiple range test. The effect of CF stand age, soil nitrogen; NO3--N, nitrate nitrogen. aggregate properties and their interaction on the physical and chemical properties relating to soil were investigated by a two-way ANOVA. The impact of the soil aggregate properties on soil N contents and stocks was measured using CANOCO 5.0 to perform redundancy analysis (RDA). Furthermore, we used Pearson’s correlation analysis to investigate the relationship between soil aggregate properties and soil N contents and stocks.
Fig. 1.
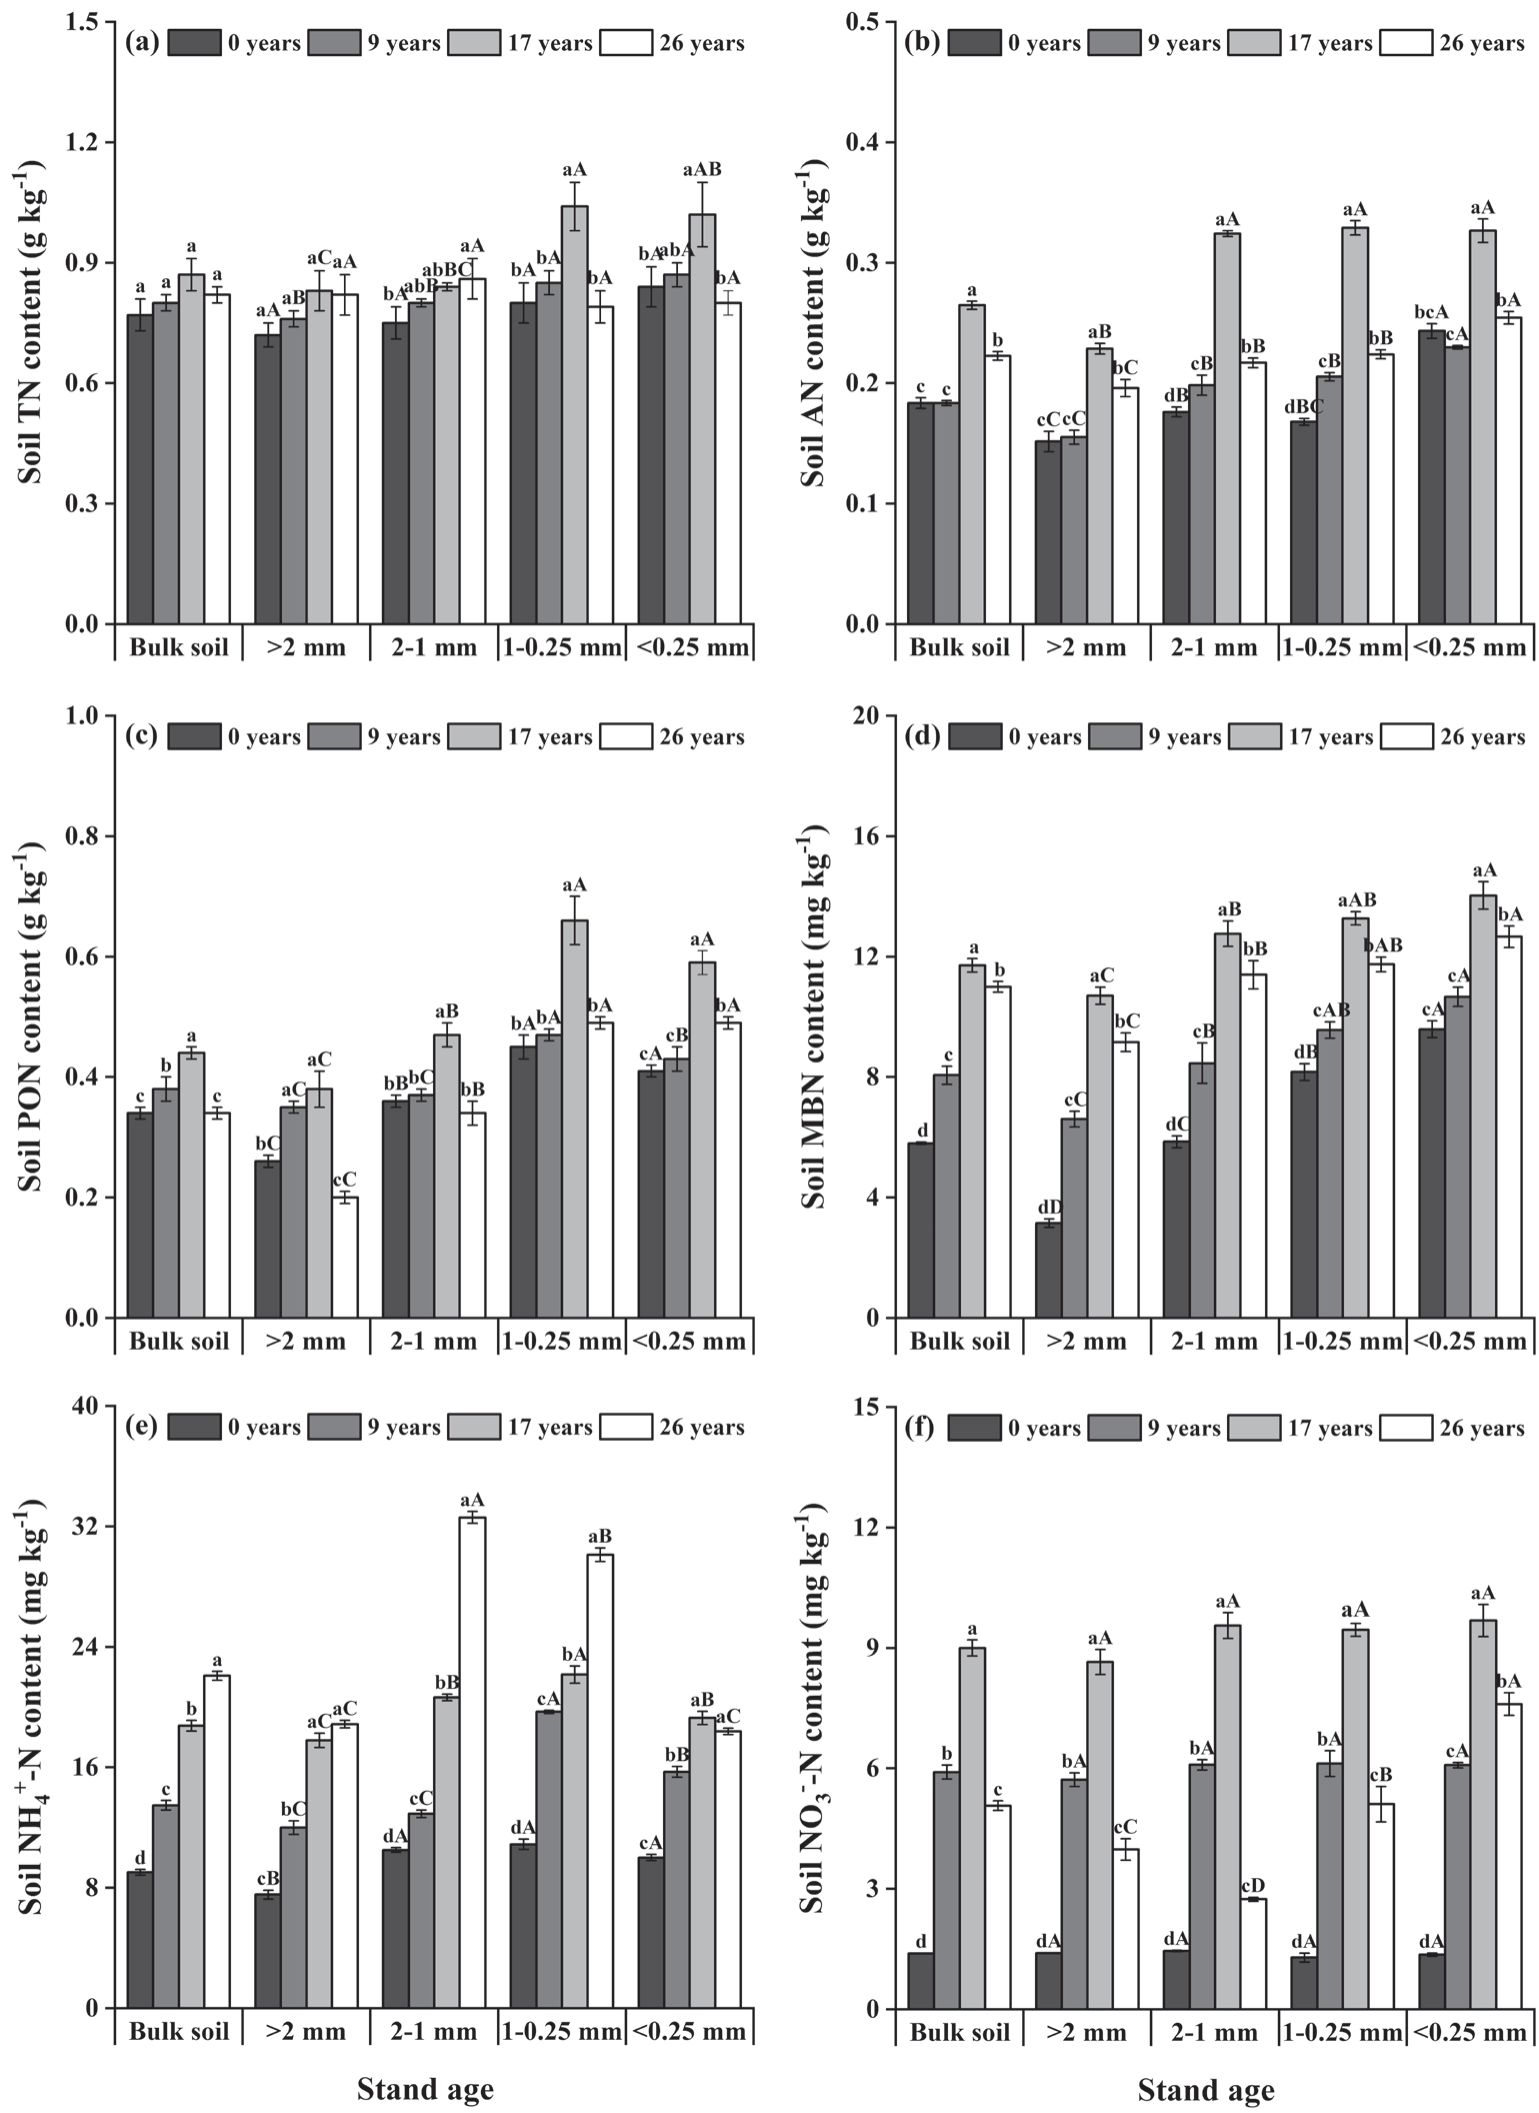
Soil aggregate-related nitrogen contents in Chinese fir plantations with different stand ages. Data represent the average of three replicates and error bars stand for the standard errors. Different lowercase letters indicate significant differences (p<0.05) among the different stand ages. Different capital letters indicate significant differences (p<0.05) among the different aggregate sizes. TN, total nitrogen; AN, alkali-hydrolyzable nitrogen; PON, particulate organic nitrogen; MBN, microbial biomass nitrogen; NH4+-N, ammonium nitrogen; NO3--N, nitrate nitrogen.
Results and Discussion
Composition and Stability of Soil Aggregates
In the distribution of aggregate, coarse macro-aggregates (average of 51.90%) dominated the composition of soil aggregates, and their proportions were considerably greater compared to those of other aggregate sizes, subsequent to micro-aggregates (24.85%) and medium macro-aggregates (16.79%), while fine macro-aggregate proportions (6.88%) were the smallest (Table 3). As shown by Table 3, it is obvious that the proportion of various sizes of soil aggregates was significantly affected by stand age (except for the medium and fine macro-aggregates). During the development of CF plantations, the aggregate proportion of each particle size changed in a different way. Coarse macro-aggregate proportions grew and then dropped, reaching a maximum in 17-year CF plantations, while micro-aggregates displayed a reverse tendency. However, the proportions of medium macro- and fine macro-aggregates displayed similar proportions at different stand ages and did not change. Meanwhile, MWD and GMD (characterizing soil aggregate stability) reached their maximum values in 17-year CF plantations (Table 3).
Soil Aggregate-Related N Fraction Contents
Total Nitrogen
Regardless of the stand ages, soil TN contents grew as aggregate sizes dropped (Fig. 1a). Specifically, soil TN contents were considerably greater in fine macro-and micro-aggregates relative to coarse macro-aggregates. Notably, during the development of CF plantations, there were no obvious changes in soil aggregate-related TN contents. Nevertheless, finer aggregate TN contents showed the maximum value in 17-year CF plantations.
Alkali-Hydrolyzable Nitrogen
At the aggregate scales, soil AN contents grew with the drop in aggregate sizes, and levels in the coarse macro-aggregates were considerably lower than <2 mm aggregates (Fig. 1b). During the development of CF plantations, soil aggregate-related AN contents grew considerably before 17 years ago and then declined dramatically thereafter.
Particulate Organic Nitrogen
At the aggregate scales, soil PON contents showed a major distribution in the fine macro- and micro-aggregates, while coarse macro-aggregates had a lower level of this parameter (Fig. 1c). During the development of CF plantations, soil aggregate-related PON contents primarily grew, followed by drops with time, with the 17 years of CF plantations having significantly higher PON contents compared to other stand ages.
Microbial Biomass Nitrogen
At the aggregate scales, soil MBN contents grew with the drop in aggregate sizes, and the highest level of soil MBN was found in the micro-aggregates, which was considerably greater than that of other aggregates (Fig. 1d). During the development of CF plantations, soil aggregate-related MBN contents first displayed a growing trend but then dropped dramatically.
Ammonium Nitrogen
At the aggregate sizes, soil NH4+-H contents were found to be most concentrated in fine macro-aggregates and least concentrated in coarse macro-aggregates (Fig. 1e). Regardless of the aggregates, soil NH4+-H contents elevated remarkably across the CF planting process, reaching the greatest levels in the 26-year CF plantations.
Table 2.
Composition and stability of soil aggregate in Chinese fir plantations with different stand ages.
[i] Note: Data represent the average of three replicates±standard errors. Different lowercase letters indicate significant differences among the different stand ages (p<0.05). Different capital letters indicate significant differences among the different aggregate sizes. MWD and GMD indicate mean weight diameter and geometric mean diameter, respectively.
Table 3.
One-way ANOVA and Two-way ANOVA regarding the effects of aggregate size, stand age, and their interactions on the physicochemical properties of litter and soil in Chinese fir plantations.
[i] Note: S indicate stand age; A indicate aggregate size; **, *, and NS indicate significant differences at p<0.01, p<0.05, and p>0.05 (not significant), respectively. TN, total nitrogen; AN, alkali-hydrolyzable nitrogen; PON, particulate organic nitrogen; MBN, microbial biomass nitrogen; NH4+-N, ammonium nitrogen; NO3--N, nitrate nitrogen; MWD, mean weight diameter; GMD, geometric mean diameter.
Nitrate Nitrogen
Specifically, aggregate size had no significant impact on soil NO3--N contents. To be specific, various sized aggregates displayed similar soil NO3--N contents (Fig. 1f). During the development of CF plantations, soil aggregate-related NO3--N contents grew considerably before 17 years ago and then declined dramatically thereafter.
Soil Aggregate-Related N Fraction Stocks
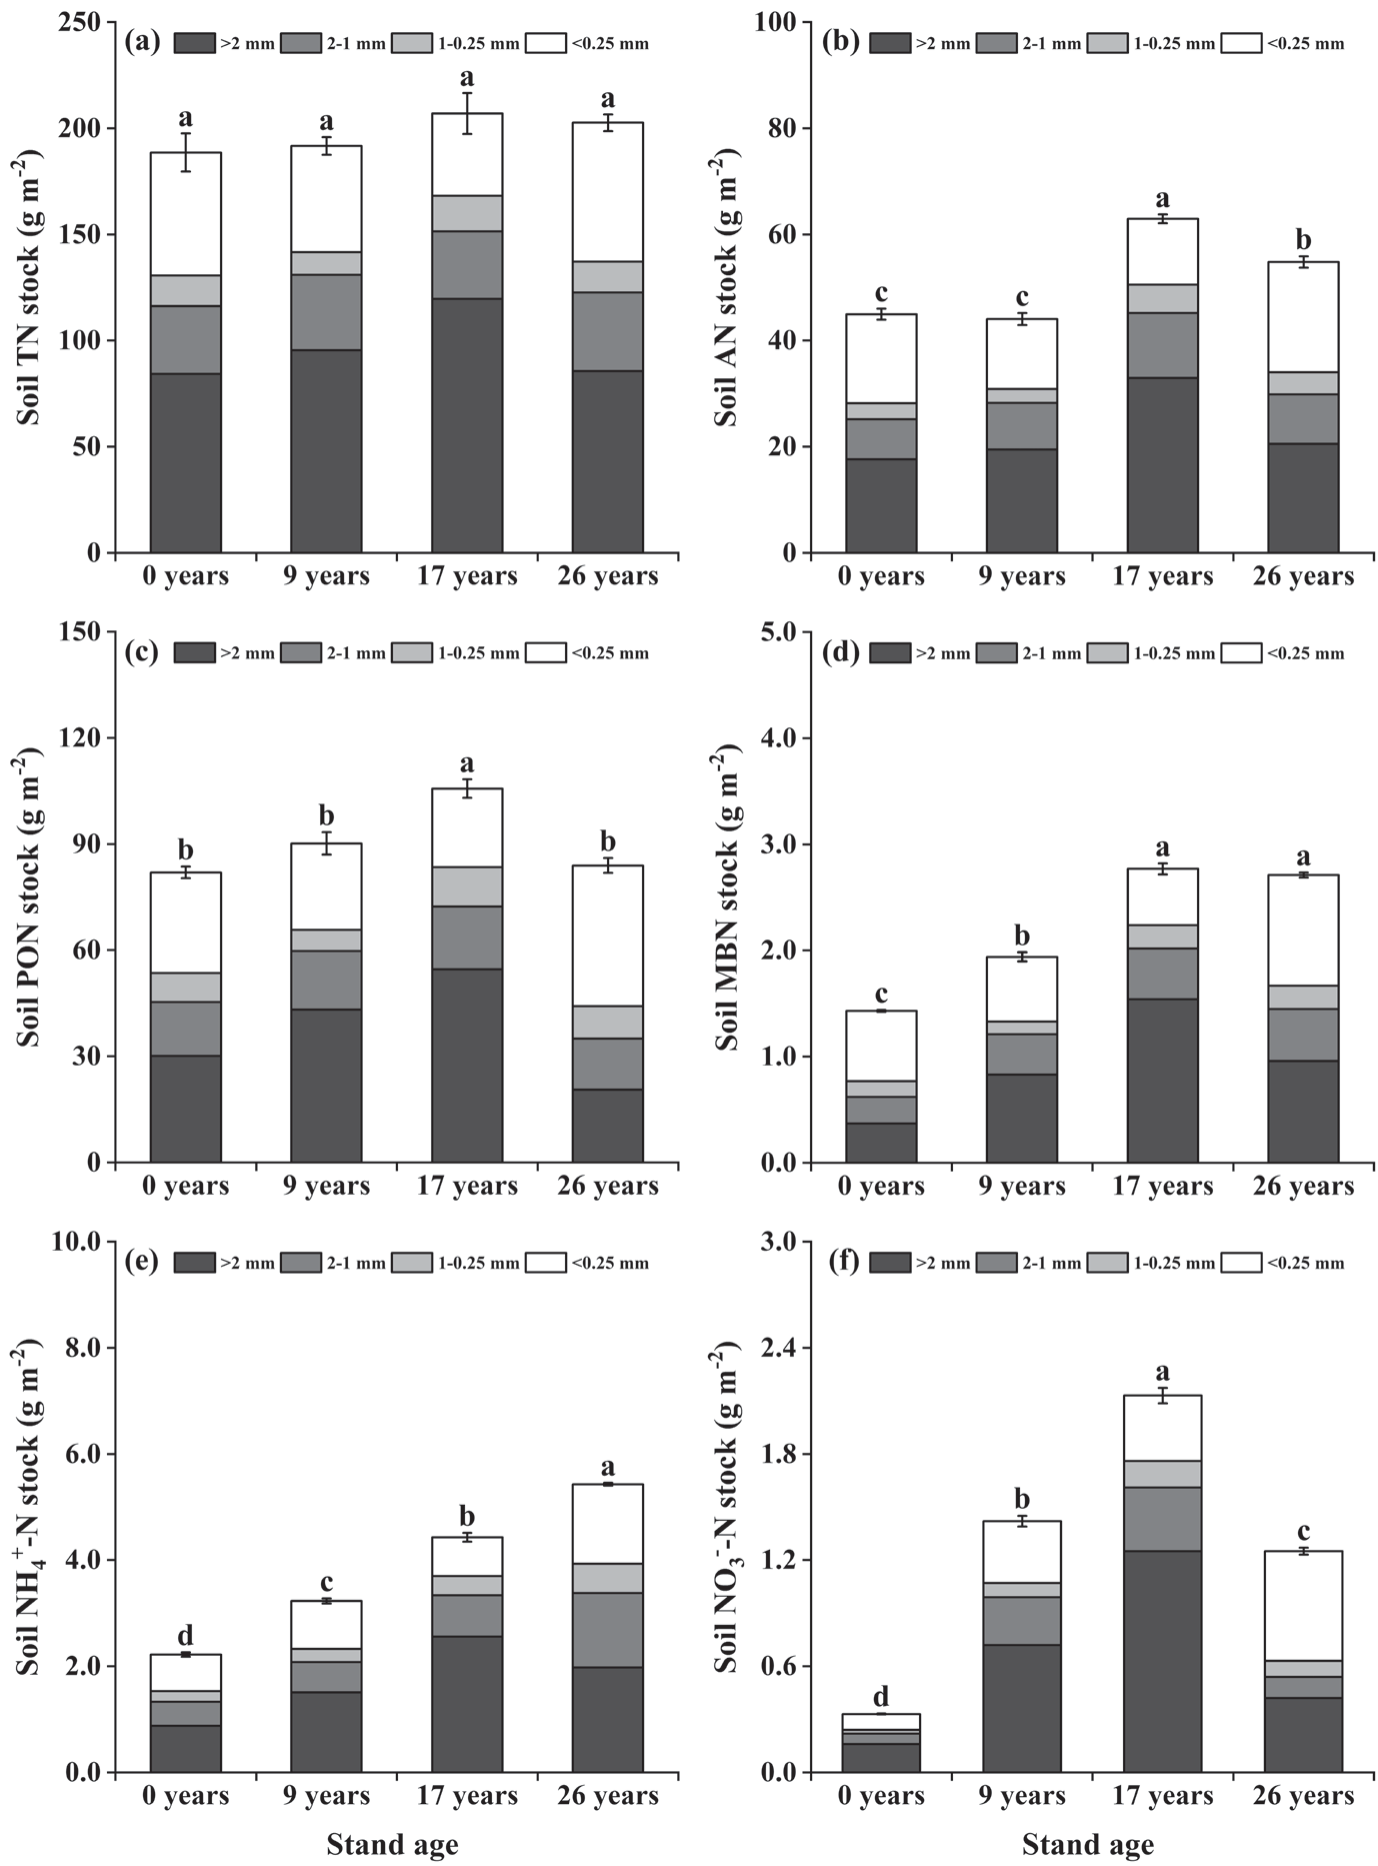
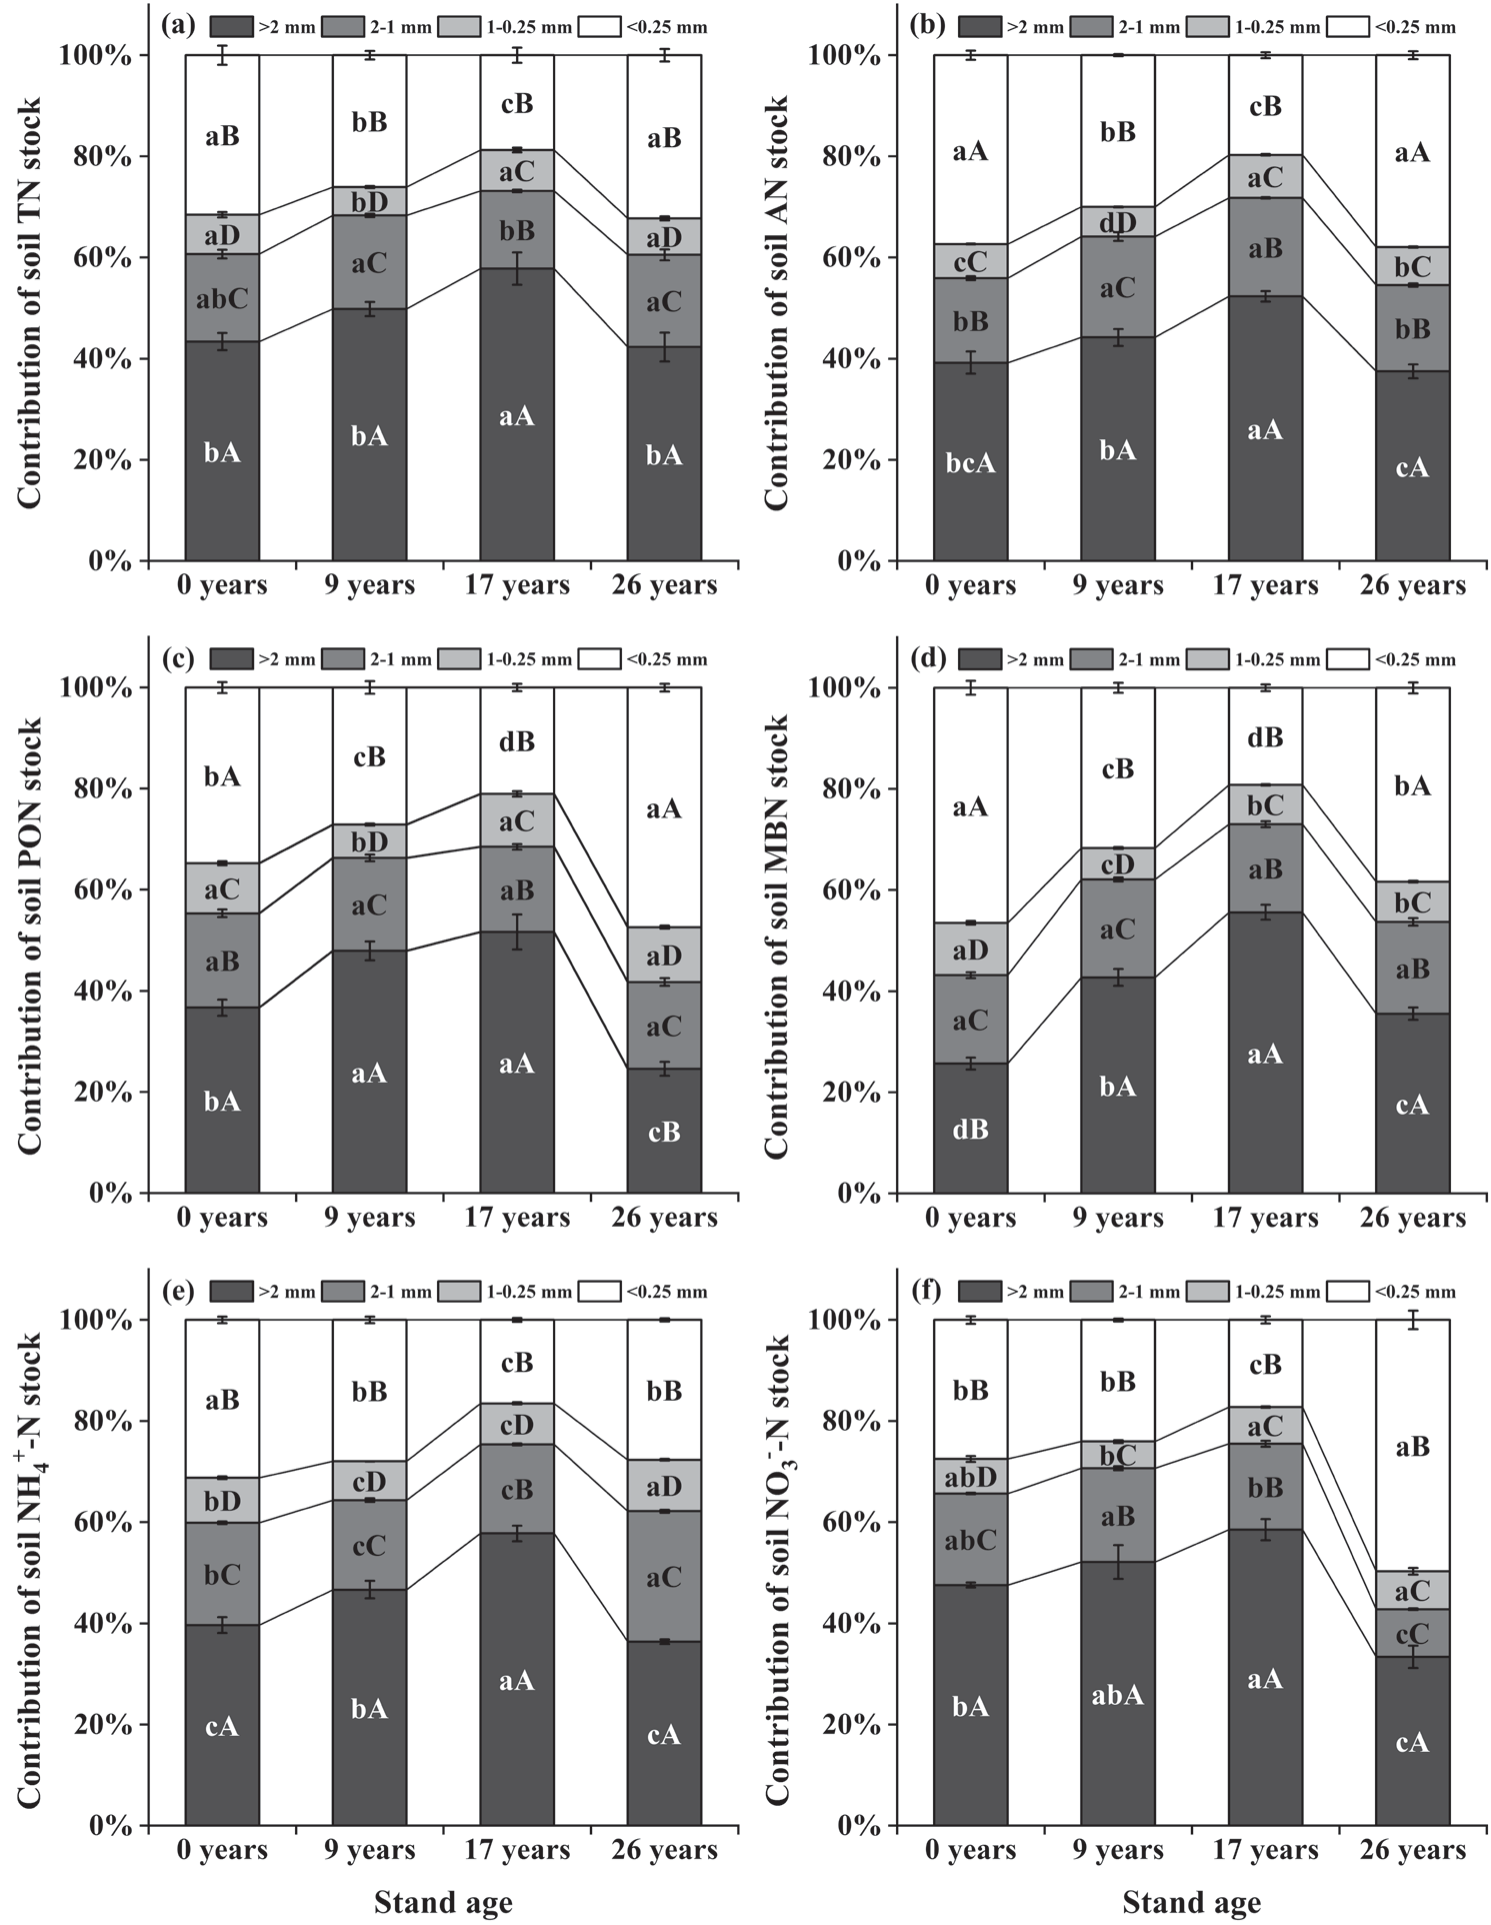
At the aggregate scales, soil N fraction stocks showed a major distribution in coarse macro- and micro-aggregates (Fig. 2). For instance, in all four stand ages, soil TN stocks in coarse macro- and micro-aggregates were 84.4-119.7 g m-2 and 38.8-65.4 g m-2, respectively (Fig. 2a), contributing 42.3-57.8% and 18.7-32.3% of TN stock in bulk soil, respectively (Fig. 3a). Similarly, LN fraction stocks were also mainly distributed in coarse macro- and micro-aggregates (Fig. 2). In this study, various sized aggregates significantly transformed soil N fraction stocks. During the development of CF plantations, the stocks of TN and part of the partial LN fractions (including TN, PON, MBN, and NO3--N) initially grew and then dropped, reaching the maximum levels in 17-year CF plantations (apart from NH4+-H) (Fig. 2). On the contrary, the stock of the soil AN first decreased, then grew, and finally dropped with time, reaching the greatest levels in 17-year CF plantations (Fig. 2b). Besides, continuous CF planting had remarkable effects on the stock of soil NH4+-H, reaching the highest levels in 26 years of CF plantations (Fig. 2e).
Fig. 2.
Soil aggregate-related nitrogen stocks in Chinese fir plantations with different stand ages. Data represent the average of three replicates and error bars stand for the standard errors. Different lowercase letters indicate significant differences (p<0.05) among the different stand ages. TN, total nitrogen; AN, alkali-hydrolyzable nitrogen; PON, particulate organic nitrogen; MBN, microbial biomass nitrogen; NH4+-N, ammonium nitrogen; NO3--N, nitrate nitrogen.
Interactions Between Soil Aggregate Characteristics and Soil N
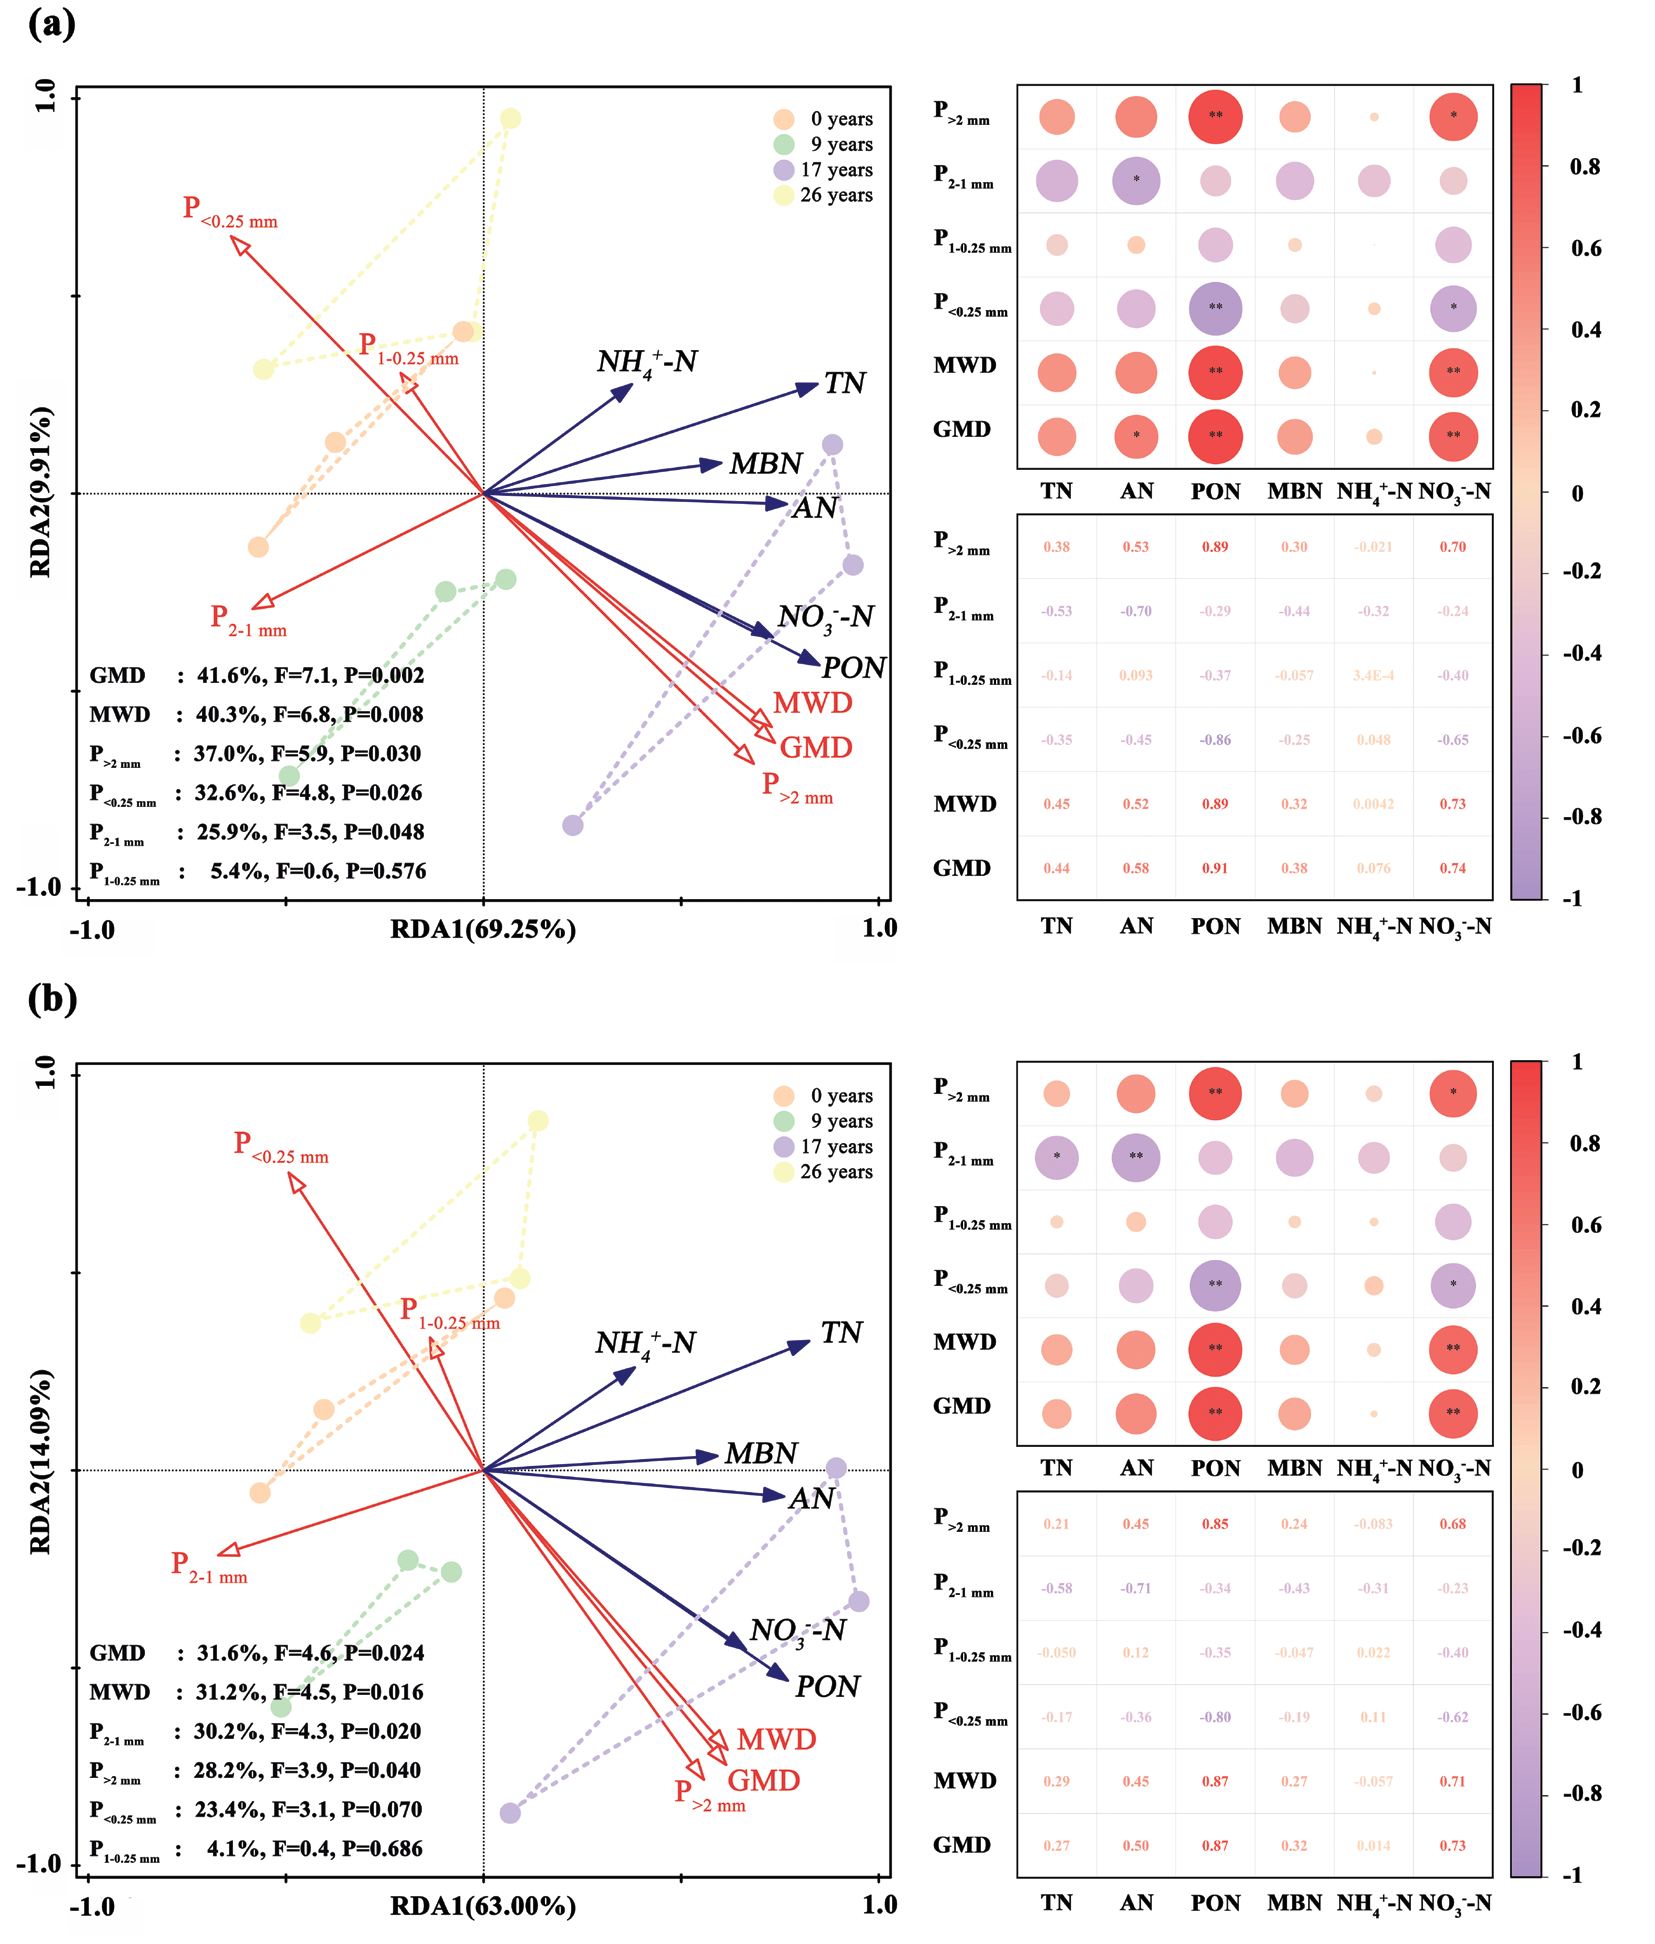
According to the RDA ordination results (Figs 5 and 6), the variance of the first two axes of Fig. 5 could account for 79.16% of the total variance, and the variance of the first two axes of Fig. 6 could account for 77.09% of the total variance, demonstrating strong interactions between soil aggregate characteristics and soil N contents and stocks in bulk soil. All of the soil aggregate characteristics factors, including MWD, GMD, P>2 mm (>2 mm aggregate proportions), P2-1 mm (2-1 mm aggregate proportions), P1-0.25 mm (1-0.25 mm aggregate proportions), and P<0.25 mm (<0.25 mm aggregate proportions), in the variance decomposition analyses, independently explained 40.3%, 41.6%, 37.0%, 25.9%, 5.4%, and 25.9% of the variation of soil N contents with the development of CF plantations, respectively (Fig. 5). These factors also independently explained 31.2%, 31.6%, 28.2%, 30.2%, 4.1%, and 23.4% of the variations of soil N stocks with the development of CF plantations, respectively (Fig. 6). According to the RDA model, GMD, MWD, and P>2 mm had a significant (p<0.05) effect on the chronological variation of soil N contents and stocks. Meanwhile, Pearson’s correlation analysis revealed a substantial positive link between these soil aggregate characteristic factors and soil N contents and stocks.
Fig. 3.
Contribution of soil aggregate-related nitrogen stocks to bulk soil in Chinese fir plantations with different stand ages. Data represent the average of three replicates and error bars stand for standard errors. Different lowercase letters indicate significant difference (p<0.05) among the different stand ages. Different capital letters indicate significant differences (p<0.05) among the different aggregate sizes. TN, total nitrogen; AN, alkali-hydrolyzable nitrogen; PON, particulate organic nitrogen; MBN, microbial biomass nitrogen; NH4+-N, ammonium nitrogen; NO3--N, nitrate nitrogen.
Composition, Stability, and Transformation of Soil Aggregate
Stand ages significantly had a substantial impact on the composition and stability of the soil aggregate of CF plantations in our investigation. To be specific, the proportion of coarse macro-aggregates first grew and then dropped, having the greatest levels in 17 years of CF plantations, whereas micro-aggregates exhibited the opposite trend (Table 2). It was indicated that the transforming trend of the composition of soil aggregate in CF plantations along planting age increased that transformation from micro-aggregates to coarse macro-aggregates between 0-17 years and from coarse macro-aggregates disintegrated into micro-aggregates between 17-26 years [10]. Based on the hierarchical theory of soil aggregates [11], litter quality is the essential factor that impacts litter decomposition products and particle sizes, which result in a change in soil aggregate composition and stability, which were found in 17-year CF plantations, showing that the stability of soil aggregate was best in 17 years, probably because the 17-year CF plantations had the greatest coarse macro-aggregate proportions.
Contents of N Fractions in Soil Aggregates
Regardless of stand ages, micro-aggregates possessed higher soil N contents (Fig. 1), which aligned with Six et al. [11] and Egan et al. [32] findings, probably because micro-aggregates possessed a greater specific surface region so that they were more likely to adsorb OMs through root exudates and litter residues. It is worth mentioning that micro-aggregates have a relatively stable structure due to the combination of primary particles and persistent binders, which makes the turnover time of OMs in micro-aggregates longer, and soil OMs in micro-aggregates are more difficult for soil microorganisms to decompose and exploit [33].
Fig. 4.
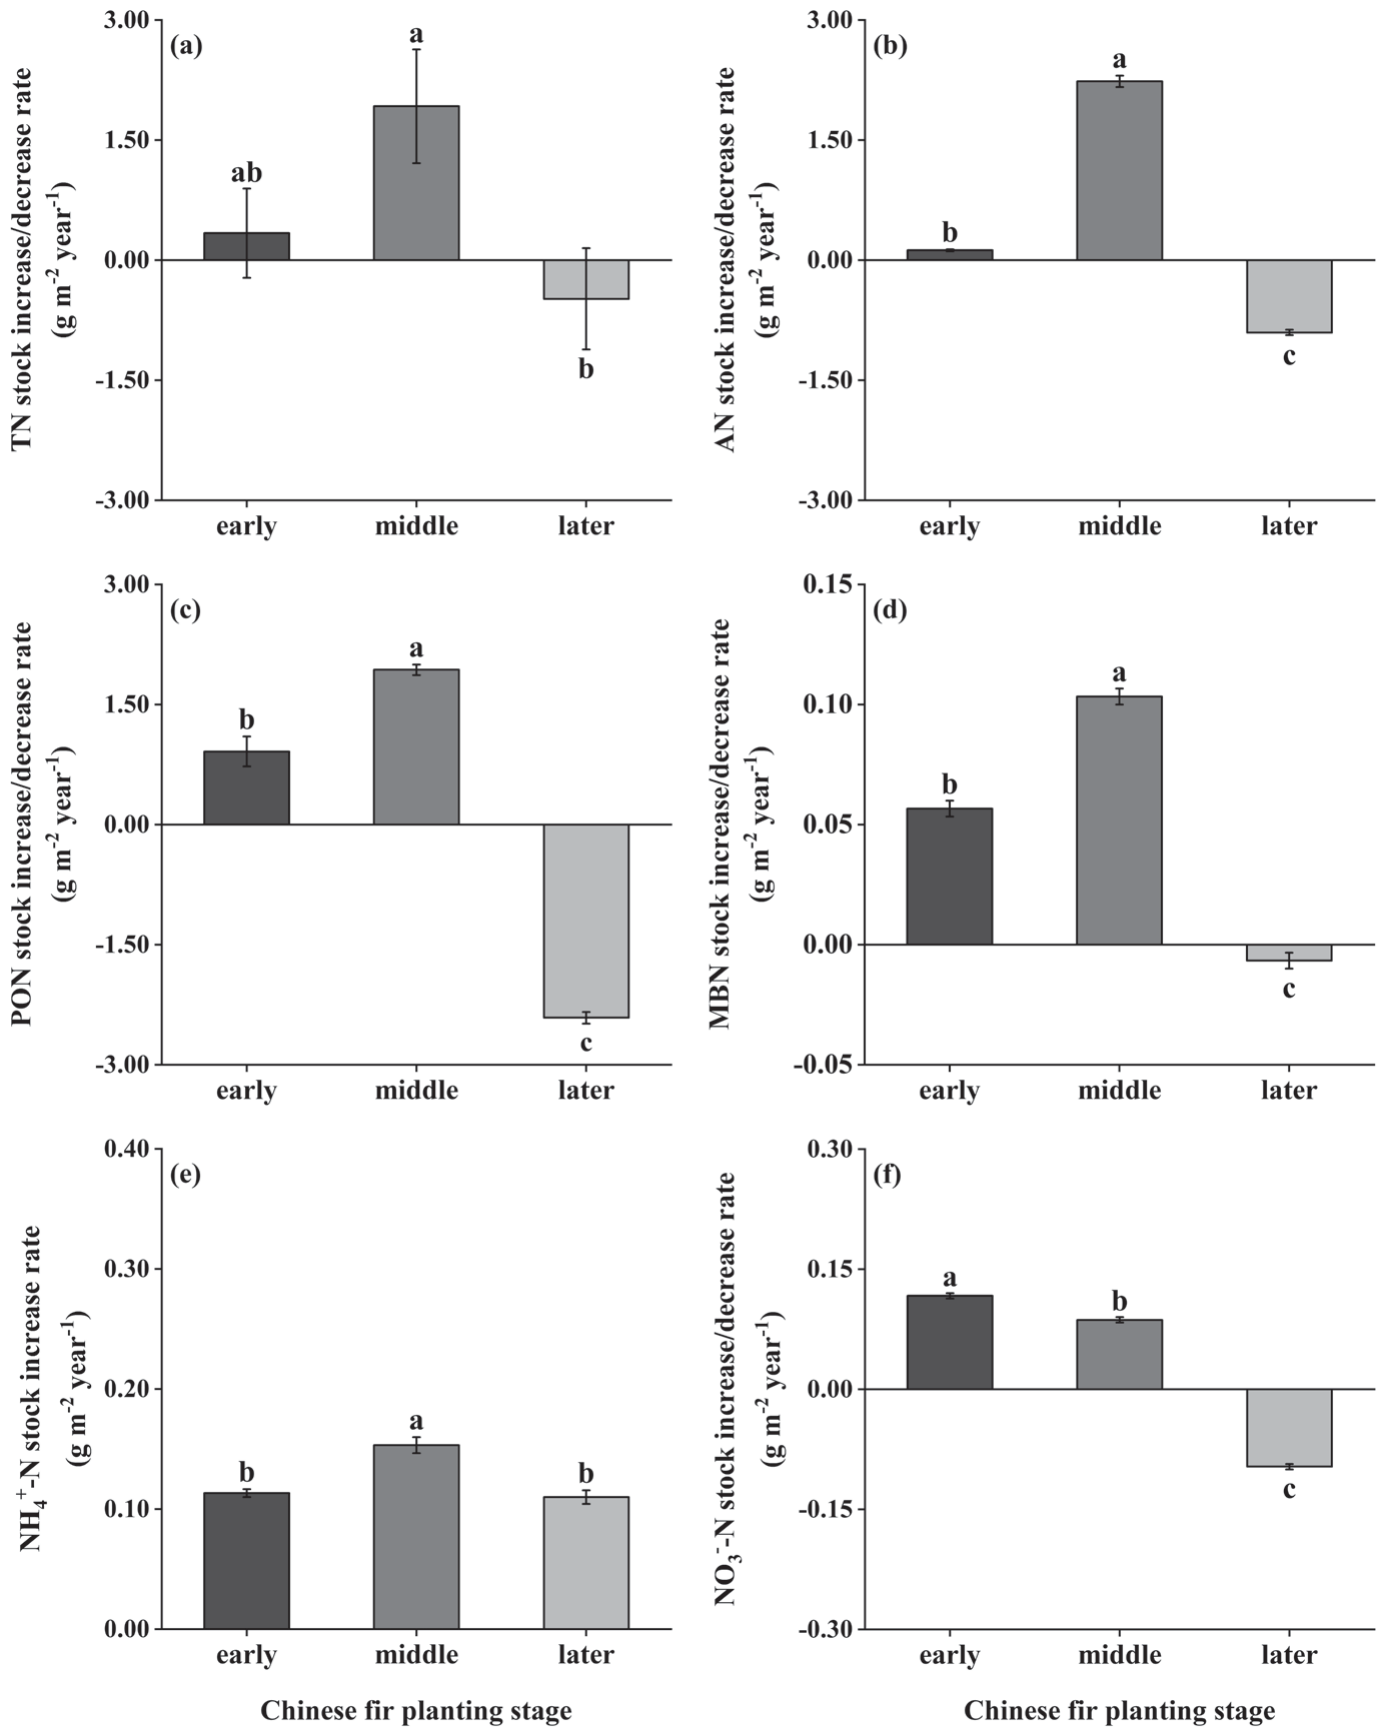
Change rates of soil aggregate-related nitrogen stocks to bulk soil in Chinese fir plantations with different stand ages. Data represent the average of three replicates and error bars stand for standard errors. Different lowercase letters indicate significant difference (p<0.05) among the different Chinese fir planting stages. Early stage: from 0 years to 9 years; middle stage: from 9 years to 17 years; later stage: from 17 years to 26 years. TN, total nitrogen; AN, alkali-hydrolyzable nitrogen; PON, particulate organic nitrogen; MBN, microbial biomass nitrogen; NH4+-N, ammonium nitrogen; NO3--N, nitrate nitrogen.
Our findings regarding the distribution of each of these LN fractions in soil aggregates are presented in detail below. First of all, soil AN was substantially centered in micro-aggregates, which might be owing to micro-aggregates’ greater specific surface region, which is more sensitive to active AN in litter residues and root exudates [15, 34]. Second, micro-aggregates and fine coarse-aggregates possessed significantly greater contents of soil PON compared with the other aggregate fractions regardless of fir plantation age, which aligned with the research by Wang et al. [35] and Lehmann et al. [36]. A possible reason is that the micro-aggregates and fine coarse-aggregates had fewer pores and lessened O2 content; thus restraining soil PON breakdown. Third, the soil MBN content tendency is consistent with TN, which was observed to have the highest contents in the micro-aggregates, probably due to the fact that macro coarse-aggregates are sensitive to environmental change and easily decomposed and utilized by soil microorganisms, thus, the macro coarse-aggregates are unfavorable for the sequestration of MBN [37]. Fourth, soil fine macro-aggregates contained the highest NH4+-N contents in all fir plantations, confirming Yu et al. [38] findings and indicating that the fine macro-aggregates had stronger adsorption to soil NH4+-N. Finally, unlike TN and other LN fractions, soil NO3--N content was uniformly distributed in different sized aggregates. As revealed by Liu et al. [39], soil NO3--N is extremely active and easy to absorb and utilize by microorganisms, as well as easily lost from the soil; hence, its regularity in various size aggregates is not as obvious as soil NH4+-N. Overall, our study found that higher TN and LN fraction contents were observed in the micro- and fine coarse-aggregates, which supports the first hypothesis.
Fig. 5.
Redundancy analysis and correlation analysis of soil aggregate parameters (proportion and stability) with soil N contents a) and stocks b) in Chinese fir plantations with different stand ages. a): TN, AN, PON, MBN, NH4+-N, NO3--N indicate the content of total nitrogen, alkali-hydrolyzable nitrogen, particulate organic nitrogen, microbial biomass nitrogen, ammonium nitrogen, and nitrate nitrogen; b): TN, AN, PON, MBN, NH4+-N, NO3--N indicate the stock of total nitrogen, alkali-hydrolyzable nitrogen, particulate organic nitrogen, microbial biomass nitrogen, ammonium nitrogen, and nitrate nitrogen; a) and b): MWD, mean weight diameter; GMD, geometric mean diameter; P>2 mm, P2-1 mm, P1-0.25 mm, and P<0.25 mm indicate the proportion of >2 mm, 2-1 mm, 1-0.25 mm, and <0.25 mm aggregate size fractions; “*” and “**” stand for significant differences at p<0.05 and p<0.01, respectively.
During the development of CF plantations, soil TN and LN fraction contents were initially elevated and then declined, reaching the maximum in 17-year CF plantations (except for soil NH4+-N), which indicated that continuous planting of CF contributes to the accumulation of soil TN and LN fractions (Fig. 1). The reasons may be related to the following aspects: First, in forest ecosystems, inputs to soil OMs consist primarily of litter residues and root exudates from the trees themselves [11]. In our investigation, the greatest amount and quality of litter (characterized by the smallest litter C/N ratio) was presented in 17 years of CF plantations; however, the amount and quality of litter decreased remarkably with time (Table 1), primarily caused by CF plantations through a natural decline in age [40], which could explain soil TN and LN fraction contents tendency at stand ages. In addition, the effect of rainfall eluviation could be enhanced by the reduced amount of litter, which may lead to the topsoil TN and LN fractions leaching into the subsoil [41]. Second, near-natural management may improve the soil microenvironment and accelerate N fixation, increasing the efficiency of N cycling [42, 43]. Third, as per our past studies [16] and our present research, it can be observed that soil aggregates of the 17-year CF plantations possessed the greatest stability (indicated as MWD and GMD), thus being conducive to the protection of OMs [11], which is consistent with our result; these positively affected the accumulation of soil TN and LN fractions in the 17-year CF plantations, supporting our second hypothesis.
Notably, contrary to other LN fractions, this research found the highest contents of soil NH4+-N of CF plantations in 26 years, primarily resulting from soil NH4+-N being in a reduced state and easy to replace soil exchangeable cations to make it leaching, thereby increasing the soil NH4+-N content [39]. As reported in our previous studies [44], soil exchangeable base ion contents (including exchangeable Ca2+ and Mg2+) dropped with the increase in stand age, which may explain why the soil NH4+-N content was highest in 26-year CF plantations. This greatly supports the above result because of the increasing soil NH4+-N content under the Ca2+ and Mg2+ that were replaced in the topsoil during the development of CF plantations.
The proportions of soil LN fractions accounting for TN can represent not only the components in soil OMs and the nutrient supply but also reflect the effect of the development process of CF on soil N behavior [16, 39, 45]. Compared with soil LN content, the proportions of soil LN can better represent soil quality [45]. In accordance with the bulk soil TN and LN contents and the proportion of LN components (Table S1) with the stand age, we can find that the TN and LN accumulation of CF plantations in 17 years was the highest, and the proportions of LN to TN in this period also increased significantly. These findings indicated that the LN fractions and their proportion in TN increased with stand age, a finding that was in line with prior research [46]. The order of the proportion of LN components to TN under CF plantations with various stand ages was: PON>AN>NH4+-N>MBN>NO3--N, and it was basically compatible with the previous findings [47]. To be specific, PON and AN were the primary components of LN, accounting for 41.37%-50.96% and 22.97%-30.51% of TN, respectively. Meanwhile, the contribution of PON and AN to soil TN was large [48], and the effect increased significantly with stand age.
Stocks of N Fractions in Soil Aggregates
In our study, we found that soil N stocks in coarse macro- and micro-aggregates contributed more than other aggregates in all CF stand ages, demonstrating that coarse macro- and micro-aggregates constituted the primary carriers for soil N stocks in CF plantings (Fig. 2). Interestingly, we discovered that the lowest N content appeared in coarse macro-aggregates (Fig. 1), yet they contributed most to soil N stocks, probably because of their greatest proportions in soil aggregates (Table 2). Our study suggested that soil N stocks in aggregates were predominantly influenced by the distribution of different sizes of soil aggregates rather than soil N contents, which aligned with the findings of Bai et al. [49] and Egan et al. [32]. According to these studies, only when the nutrients are evenly distributed in various aggregate sizes could the nutrient content in aggregate influence the nutrient stocks. The ratio of variations in soil TN and LN fraction stocks to CF planting years can be utilized to estimate the rate of increase or decline of these stocks in CF plantations [50]. Our findings show that during the early CF planting stages (0-9 years), the increased rate of soil TN and LN fraction stocks was 0.34 g TN m-2 year-1 and 1.32 g LN m-2 year-1, respectively (Fig. 4a-f). During the middle CF planting stages (9-17 years), the increased rate of soil TN and LN fraction stocks was 1.92 g TN m-2 year-1 and 4.50 g LN m-2 year-1, respectively. However, during the later CF planting stages (17-26 years), the decreased rates of soil TN and LN fraction stocks were 1.92 g TN m-2 year-1 and 3.22 g LN m-2 year-1, respectively. From these results, it is evident that the accumulation of soil N stocks achieved the greatest rates during the middle stages, which was roughly aligned with the findings of our prior studies in He et al. [16] and He et al. [51], which indicated that the middle stages were the most advantageous stage for N storage and circulation in CF plantations. On the contrary, soil TN and LN fraction stocks present rapidly declined at later stages, which could be attributed to the fact that N had been transferred from the underground part to the aboveground part after the CF plantations had experienced the growth of the period, so that in CF mature plantations, this was also possibly related to soil N contents and the variation of the coarse macro-aggregate proportions in CF plantations [21].
Interactions Between Soil Aggregate Characteristics and Soil N
As a ready-made nutrient pool in a forest ecosystem, soil LN fractions have the characteristics of rapid turnover, which affects the material circulation and nutrient transformation of the forest ecosystem [14] and can characterize the nutrient availability of forest soil. Soil aggregate features are the main driving variables affecting soil nutrients, and the mechanism of aggregate formation significantly impacts the dynamic distribution of soil LN [45, 52, 53]. Therefore, from the perspective of soil aggregate, studying the interaction between soil N and soil aggregate features (proportion and stability) can provide new theoretical ideas for the sustainable development of CF plantations. The contents and stocks of soil aggregate-related N in 17 years of CF plantation were considerably greater than those in other forest ages (Fig.s 1 and 2). This is probably due to the fact that stand ages significantly increased soil coarse macro-aggregate proportions and soil aggregate stability, thereby significantly increasing soil N contents and stocks in aggregates, which supported our third hypothesis. RDA and Pearson’s correlation analysis revealed that coarse macro-aggregate proportions and soil aggregate stability (represented by GMD and MWD) significantly affected the dynamic change of soil N stocks at the four developmental stages of CF. Meanwhile, coarse macro- and micro-aggregate proportions contributed 37.0% and 32.6% to the change of soil N contents, respectively, while the contribution of soil N stocks changed mainly depended on large aggregates (>1 mm). Meanwhile, as compared to soil N contents, soil N stocks and the contribution rate of CF planted at different stand ages are more consistent with soil aggregate characteristic parameters [51], indicating that the soil aggregate structure has a stronger influence on soil N stocks. Although soil N contents in micro-aggregates are higher, coarse macro-aggregates mainly carry the stocks of soil TN and LN fractions, and the variations in soil N stocks are predominantly displayed in coarse macro-aggregates. It is further proved that improving the maintenance of coarse macro-aggregates to increase coarse macro-aggregate proportions and soil aggregate stability is beneficial to the soil N stocks in CF plantations, which was consistent with our previous research that the largest contribution rate of organic N [51], OC, and LOC stocks [16] have the largest contribution rate in coarse macro-aggregates in the study area.
Conclusions
This study demonstrated the dynamic changes of soil TN and LN fractions in CF plantations from aggregate perspectives. It can be seen from this study that aggregate properties and stand ages were major factors affecting the storage and circulation of soil N pools. During the development of CF plantations, the coarse macro-aggregates were mostly responsible for storing the stocks of soil TN and LN fractions, and the changes in N stocks were also mainly reflected in the coarse macro-aggregates, which indicated that the stocks of TN and LN fractions were mainly determined by the distribution of soil aggregates rather than the contents of soil TN and LN fractions. RDA and Pearson’s correlation analysis further demonstrated that coarse-aggregate proportions and the stability of soil aggregates are likely to be the dominant reasons leading to the soil TN and LN fraction stock variations in the CF planting area. In conclusion, in order to sustain the N supply and demand of plants and soil, the stability of soil aggregates and the proportions of coarse macro-aggregate should be increased by means of fertilization, which is conducive to promoting the accumulation of soil N storage in Chinese fir plantations, especially after 17 years of planting CF plantations. This study increases understanding of soil N dynamics and gives critical information to better understand the soil N cycle during CF planting, which might offer new theoretical ideas for improving soil fertility and managing sustainably for CF plantations. In addition, more study on N dynamic changes in diverse components of forest ecosystems (plants, soil, and litter) is needed to better understand the pools and cycles of N in forest systems.

