

Introduction
Heavy metal pollution in water has become one of the world’s most significant environmental problems, and this problem has been studied and discussed extensively worldwide [1–3]. Heavy metal pollution not only harms the environment but also creates a cumulative effect through migration into the human body, posing a threat to human health [4–5]. In recent years, many studies have shown that some toxic heavy metal elements – including arsenic (As), chromium (Cr), cadmium (Cd), mercury (Hg), and lead (Pb) – have carcinogenic, teratogenic, and mutagenic triple effects [6]. For example, As can cause skin cancer and lung cancer, and Cd6+ can cause toxic reactions in the viscera and nervous system. In addition, industrialization is an important driving force for the expansion of construction land. With the increase in the proportion of the secondary industry, land use patterns have undergone tremendous changes, the proportion of the permeable area of the underlying surface has plummeted, and the environmental pressure and environmental pollution level have also increased each year, resulting in frequent ecological problems, such as deterioration of the ecological environment and degradation of the ecosystem.
The migration and transportation of heavy metals are all carried out in a certain form: pH, organic matter content, and type of land use are all important factors that affect the content and migration performance of heavy metals [7]. Heavy metals entering the environment cannot be biodegraded, will exist for a long time, and continue to accumulate and enter the food chain through crop absorption and other ways to affect human health and ecological environment safety. The environmental effect of heavy metals is not only related to their total amount, but also determined by their chemical form to a greater extent. The potential harm degree of heavy metals to the environment can be judged according to their bioavailability, existence form, and ecological hazard risk degree. Studying the distribution characteristics of the form of heavy metals is helpful in analyzing its environmental effects, which hold great ecological significance for environmental control and restoration.
Wuhu is one of the core cities in the Yangtze River Delta Economic Belt, with the secondary and tertiary industries serving as the main industries, which are supplemented by the primary industry. Vehicle activity in the urban area is frequent, and the sources of pollutants are complicated. Rainfall runoff, as the primary cause of non-point-source pollution, carries a large number of heavy metals from atmospheric deposition, road surfaces, and rooflines. In addition, pipeline sediments contribute to rainwater runoff migration and transformation, which finally move into the receiving water body [8]. Heavy metals in rivers are transformed into more toxic forms of heavy metal under the action of microorganisms, which has a direct negative effect on aquatic organisms. Therefore, it is essential to evaluate the ecological risk of heavy metal content in rainfall runoff. At present, however, the ecological risk assessment has mostly studied the concentration and distribution of pollutants in water, and the research objects are mostly water bodies and sediments, such as oceans and lakes [9]. Research is lacking on the risk assessment of heavy metals carried by rainfall runoff in different types of land use.
Ecological risk assessment (ERA) is used to evaluate the possibility and harmfulness of adverse factors in an ecosystem or its components under a specific pollutant exposure concentration and to judge the probability and magnitude of its adverse effects [10]. The species sensitivity distribution (SSD) method is a statistical extrapolation method with high confidence that has been widely used in the ecological risk assessment of pollutants and the derivation of water quality standards. Yu [11] provided technical support for the protection of Cd pollution in agricultural land. Using different Cd toxicological data from 23 test endpoints, they used the SSD method to assess interspecific inference, determined the dangerous concentration of 5% species (HC5, 95% protected species), and established a prediction model according to several soil parameters. Ding [12] conducted a case study of Cd pollution in surface water in China to evaluate key water quality parameters and species distribution characteristics and then revised the water quality standards of Cd in different regions. They revealed that the difference in long-term water quality standards between different regions was 84 times, and the difference in the risk quotient (RQ) increased 280 times, which revealed that scientific progress in water quality standards is the most significant challenge to ensuring the safety of aquatic ecosystems.
In this study, we analyzed and summarized the concentrations of Cu, Cd, and Pb in Wuhu rainwater runoff by selecting different types of land use as research areas. Based on the SSD curve of toxicity data and the measured concentrations, we calculated, analyzed, and compared the RQ of three heavy metals in different types of land use. In addition, we evaluated the ecological risk of heavy metal pollution in Wuhu rainwater runoff to provide a scientific theoretical basis for risk management and risk assessment of heavy metal pollution in China.
Materials and Methods
Overview of the Study Area
Wuhu City is located in the southeast of Anhui Province, with a warm and humid monsoon climate and abundant rainfall, with an average annual precipitation of 1565 mm and 146 days of precipitation. The research areas are located in the new districts of Wuhu City (area of the government affairs center, 7.3 km2; area east of Biandan River, 5.7 km2) and the old districts (Jinghu area, 3.9 km2; Baoxinghan area, 7.3 km2), as shown in Fig. 1, with a total area of 24.2 km2. The study area is densely populated and has dense river networks. We sampled rainfall four times and obtained data for four effective rainfall events, which were recorded as rainfall times 08/20/2023, 09/20/2023, 09/13/2023, and 11/07/2023, including two heavy rains, one moderate rain, and one mild rain. The rainfall characteristics during the sampling period are presented in Table 1.
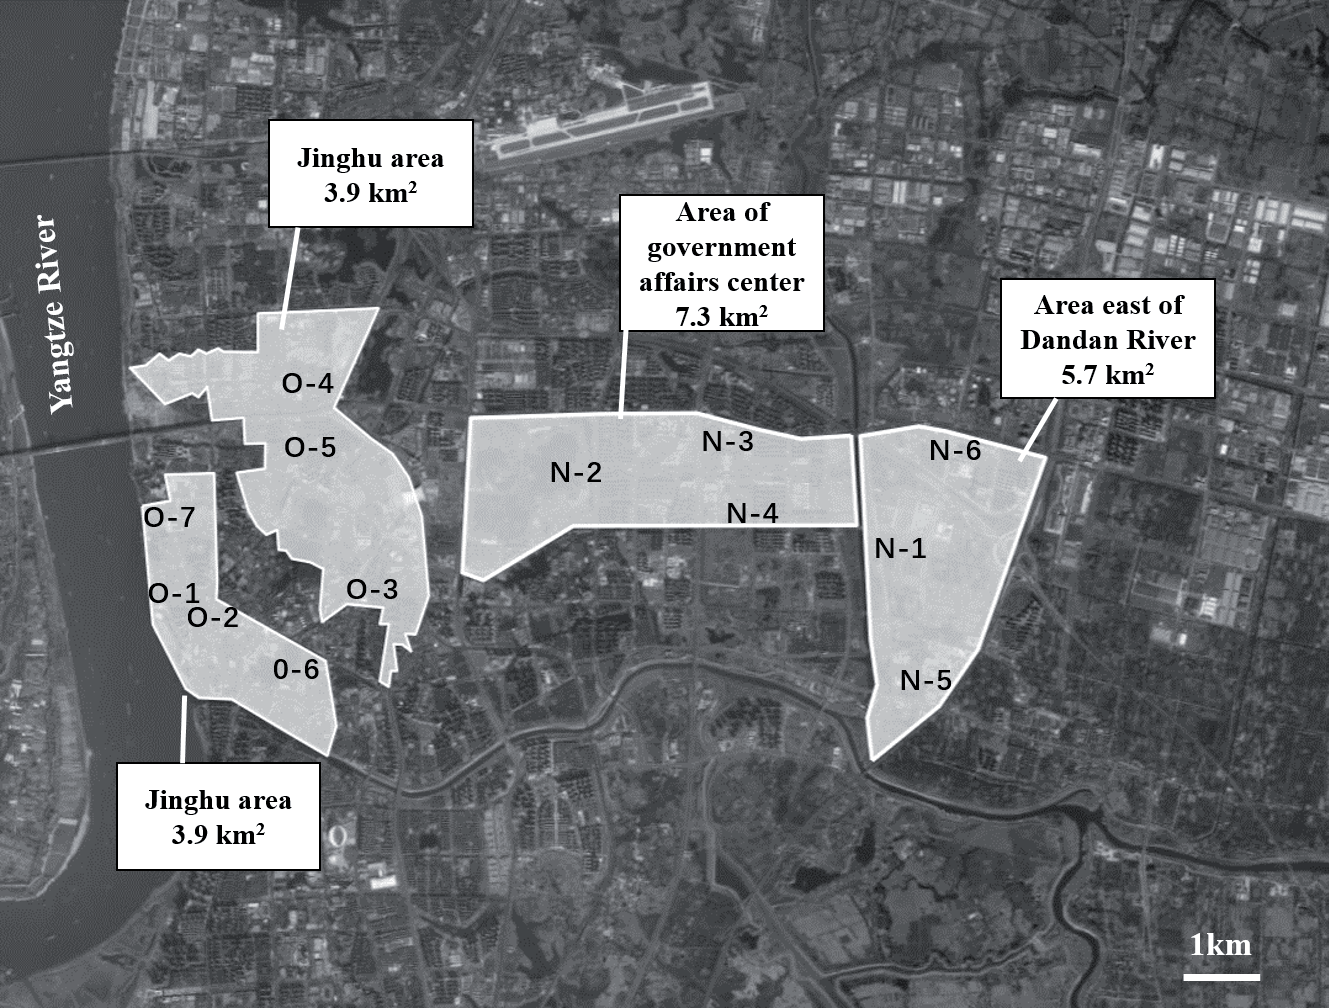
Table 1.
Precipitation characteristics in monitoring.
Types of land use had obvious differences in the accumulation of heavy metals in surface dust and soil [13–14]. For example, the concentration of heavy metals in runoff produced in industrial areas, commercial areas, and high-density residential areas was higher than that in green areas and low-density residential areas. In this study, we selected seven typical types of land use-namely, road square land (RSL), green land (GL), commercial land (CL), residential land (RL), industrial land (IL), public building land (PBL), and dock land (DL). After on-the-spot investigations and pipeline network information exploration, we identified 13 monitoring points in the new and old districts, with one monitoring point for each land type (there are no docks in the new districts, so we did not have a dock detection point in the new districts). Table 2 lists the comprehensive information for each monitoring point. Each monitoring point was representative. We set three rainfall monitoring points near the monitoring point (< 1 km). The layout of the rainfall runoff monitoring points is shown in Fig. 1.
Sample Collection and Analysis
To determine the contribution rate of rainwater runoff to heavy metal pollution in the receiving water body in Wuhu City, our investigation and analysis work focused on terminal sampling. We collected runoff samples from the inspection well near the outlet of the drainage system and collected runoff water quality hydrograph samples at the interval of initial density and subsequent thinning after runoff formation, with a general sampling interval of 5–30 min (sampling at the 5th, 10th, 15th, 20th, 30th, and 60th min after runoff generation). Sample collection began in August 2023. The collected water samples were put in polyethylene bottles and transported to the laboratory for storage at 4°C, and the sample analysis was completed as soon as possible.
Table 2.
Orientation and surrounding characteristic information of rainfall runoff water quality monitoring points.
Surface dust particles have always been regarded as carriers of urban pollutants and an important source of pollution for rainfall runoff. Because of frequent human activities, such as municipal construction and traffic, urban surface dust contains a high content of heavy metals. When rainfall washes across the surface to form runoff, these heavy metal pollutants are carried into pipelines and are discharged into rivers, which eventually affects the urban water environment. In addition to collecting runoff and rainwater, we collected dust particles on impervious pavement from seven land types on sunny days. Each monitoring point was composed of mixed samples by multipoint sampling. We packed the samples into polyethylene self-sealing bags and brought them to the laboratory.
According to the Monitoring and Analysis Methods of Water and Wastewater (4th edition) [15], we determined the concentrations of heavy metals Cu, Cd, and Pb using a flame atomic absorption spectrophotometer. First, we pretreated the collected rainwater samples and road particles differently: the runoff water samples and road particles (total state) before and after filtration were digested with acid, and the road particles were pretreated according to a chemical reagent extraction method proposed by Wang [16]. After completing the different pretreatments, we determined the concentrations of total heavy metals in the runoff water samples, dissolved heavy metals and total heavy metals in the particulate matter, and water-soluble heavy metals and weak acid extracted heavy metals in the particulate matter using a flame atomic absorption spectrophotometer. We determined the Cu and Pb concentrations using APDCMIBK extraction flame atomic absorption spectrometry and determined the Cd concentration using direct inhalation flame atomic absorption spectrometry. The heavy metals concentration analyses were conducted in triplicate.
Ecological Risk Assessment of Heavy Metals
In this study, we used the Environmental Quality Standard for Surface Water (GB 3838–2002), SSD method, and RQ to evaluate the ecological risk posed by heavy metals. The technical route shown in Fig. 2 is adopted for research.
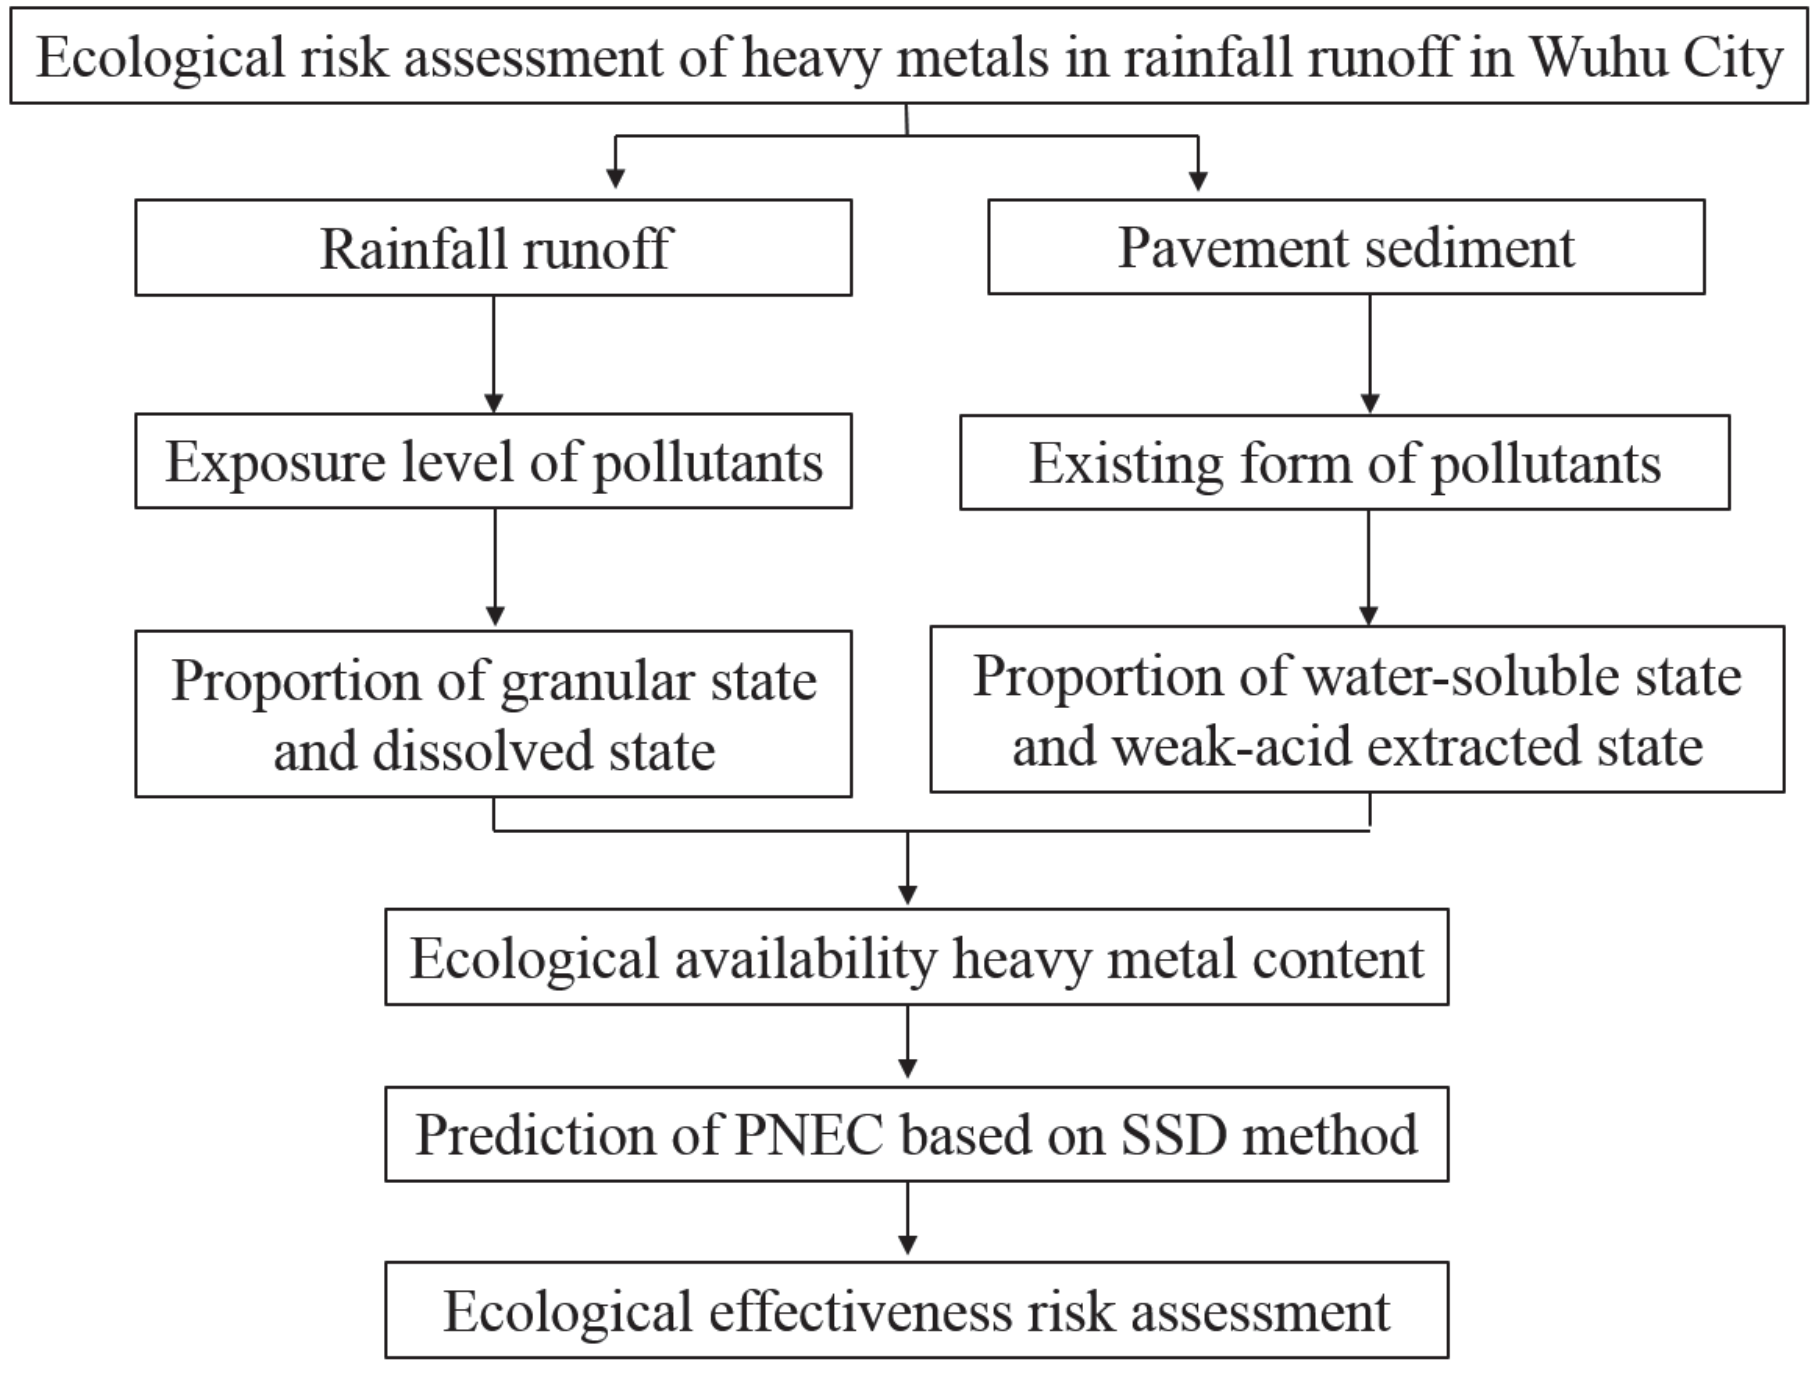
Table 3.
Criteria of Cu, Cd, and Pb concentrations according to the Surface Water Environmental Quality Standard of China (unit in mg/g).
| Heavy metal concentration | Ⅰ | Ⅱ | Ⅲ | Ⅳ | Ⅴ |
|---|---|---|---|---|---|
| Cu | ≤0.01 | ≤1.0 | ≤1.0 | ≤1.0 | ≤1.0 |
| Cd | ≤0.001 | ≤0.005 | ≤0.005 | ≤0.005 | ≤0.01 |
| Pb | ≤0.01 | ≤0.01 | ≤0.05 | ≤0.05 | ≤0.1 |
According to the Environmental Quality Standard for Surface Water, we divided the water quality into five categories from high to low according to the requirements of environmental function and protection objectives of surface water. The standard values are shown in Table 3 [17].
In this study, we derived the toxicological data, the number of evaluated species, and the HC5 value from the SSD curves for Cu, Cd, and Pb constructed by Zhang et al. [18]. The acute toxicological data of heavy metals used in this study originated from the U.S. Environmental Protection Agency’s (EPA) ECTOX database (http://www. epa.gov/ecotox), in which the number of toxicological data points for Cu, Cd, and Pb was 16, 18, and 21, respectively. We selected data for all species (not grouped) to fit the SSD curve, including algae, fish, crustaceans, mollusks, worms, and other invertebrates. According to the research results [19], we obtained the toxic concentration (HC5) corresponding to the 5th percentile, which indicated the maximum pollutant concentration that could guarantee that 95% of the species in the ecosystem would not be affected. The predicted no-effect concentration (PNEC) is the ratio of HC5 to the assessment factor (AF). According to the technical guidelines of the European Union risk assessment [20], we determined the appropriate value of AF. In this study, according to the number of species included in the selected SSD curve, toxicity data, and the dominance of model fitting, we selected AF = 2.
Where HC5 means the maximum pollutant concentration that can guarantee that 95% of the species in the ecosystem would not be affected, and PNEC and AF represent the predicted no-effect concentration and the assessment factor of heavy metals, respectively.
RQ is the ratio of measured environmental concentration (MEC) to PNEC, and its ratio determines the degree of ecological risk impact [21]. An RQ < 0.1 indicates low ecological risk; 0.1 ≤ RQ ≤ 1 indicates medium ecological risk, and RQ > 1 indicates a high ecological risk. In the process of rainfall runoff, the MEC is taken as the event mean concentration (EMC), which is more representative of the rainfall process in the whole region.
Where EMC represents the event mean concentration, mg/L; M, V, t, Ct, and Qt represent total pollutant quality during rainfall (g), total runoff (L), time (min), the concentration of pollutants at time t (mg/L), and runoff rate at time t (L/min).
Considering that the collected runoff water samples were mixed with road particles and that different states of heavy metals have different effects on aquatic organisms, it is one-sided to calculate ecological risk using only the total heavy metal concentration in runoff water samples. The heavy metals in the water phase of runoff water samples are easily absorbed and utilized by organisms, and the heavy metals in the form of water-soluble and weak acid extracted in particulate matter are easily exchanged with the upper water body because of weak bonds as well as biological effectiveness. Therefore, to effectively reflect the ecological risk of heavy metals in runoff water samples, we selected the ecologically effective heavy metal content (MECE), that is, the MECE consisted of the following parts: the dissolved-state heavy metal content and the granular-state heavy metal content in the form of a water-soluble state and a weak acid-extracted state, as follows:
Where MECE represents the ecologically effective heavy metal content; D% and G% represent the percentage of dissolved heavy metals and particulate heavy metals in total heavy metals, respectively; and mWS, mWAE, and mG denote the quality of the water-soluble state, weak acid-extracted state, and particulate heavy metals, respectively.
Results and Discussion
Analysis of Rainfall Runoff Pollution Level
Heavy Metal Concentration Distribution
The premise of runoff produced by rainfall is to contact the catchment surface, and the material and properties of the catchment surface are quite different in different types of land use, which is the key factor affecting the concentration of heavy metals [22–23]. The statistical results in Fig. 3 show that the concentrations of Cu, Cd, and Pb were different in the new and old districts and among the different types of land use. In the new and old cities, the sites with higher concentrations of Cu and Pb were concentrated in industrial areas, followed by commercial areas, docks (the old districts), road squares, and public building areas, with less distribution in green spaces and residential areas. The high-pollution areas of Cd in the new and old cities were all located in the road square, and the concentration of monitoring points in the commercial area, industrial area, and public building area was moderate; the concentration of monitoring points in residential areas and docks was low; and the green space was not detected. By comparison, we concluded that the industrial area was the most polluted by heavy metals, and the four monitoring points of road squares, commercial areas, public building areas, and docks were all polluted by different heavy metals to varying degrees. The green spaces and residential areas were the least polluted by heavy metals.
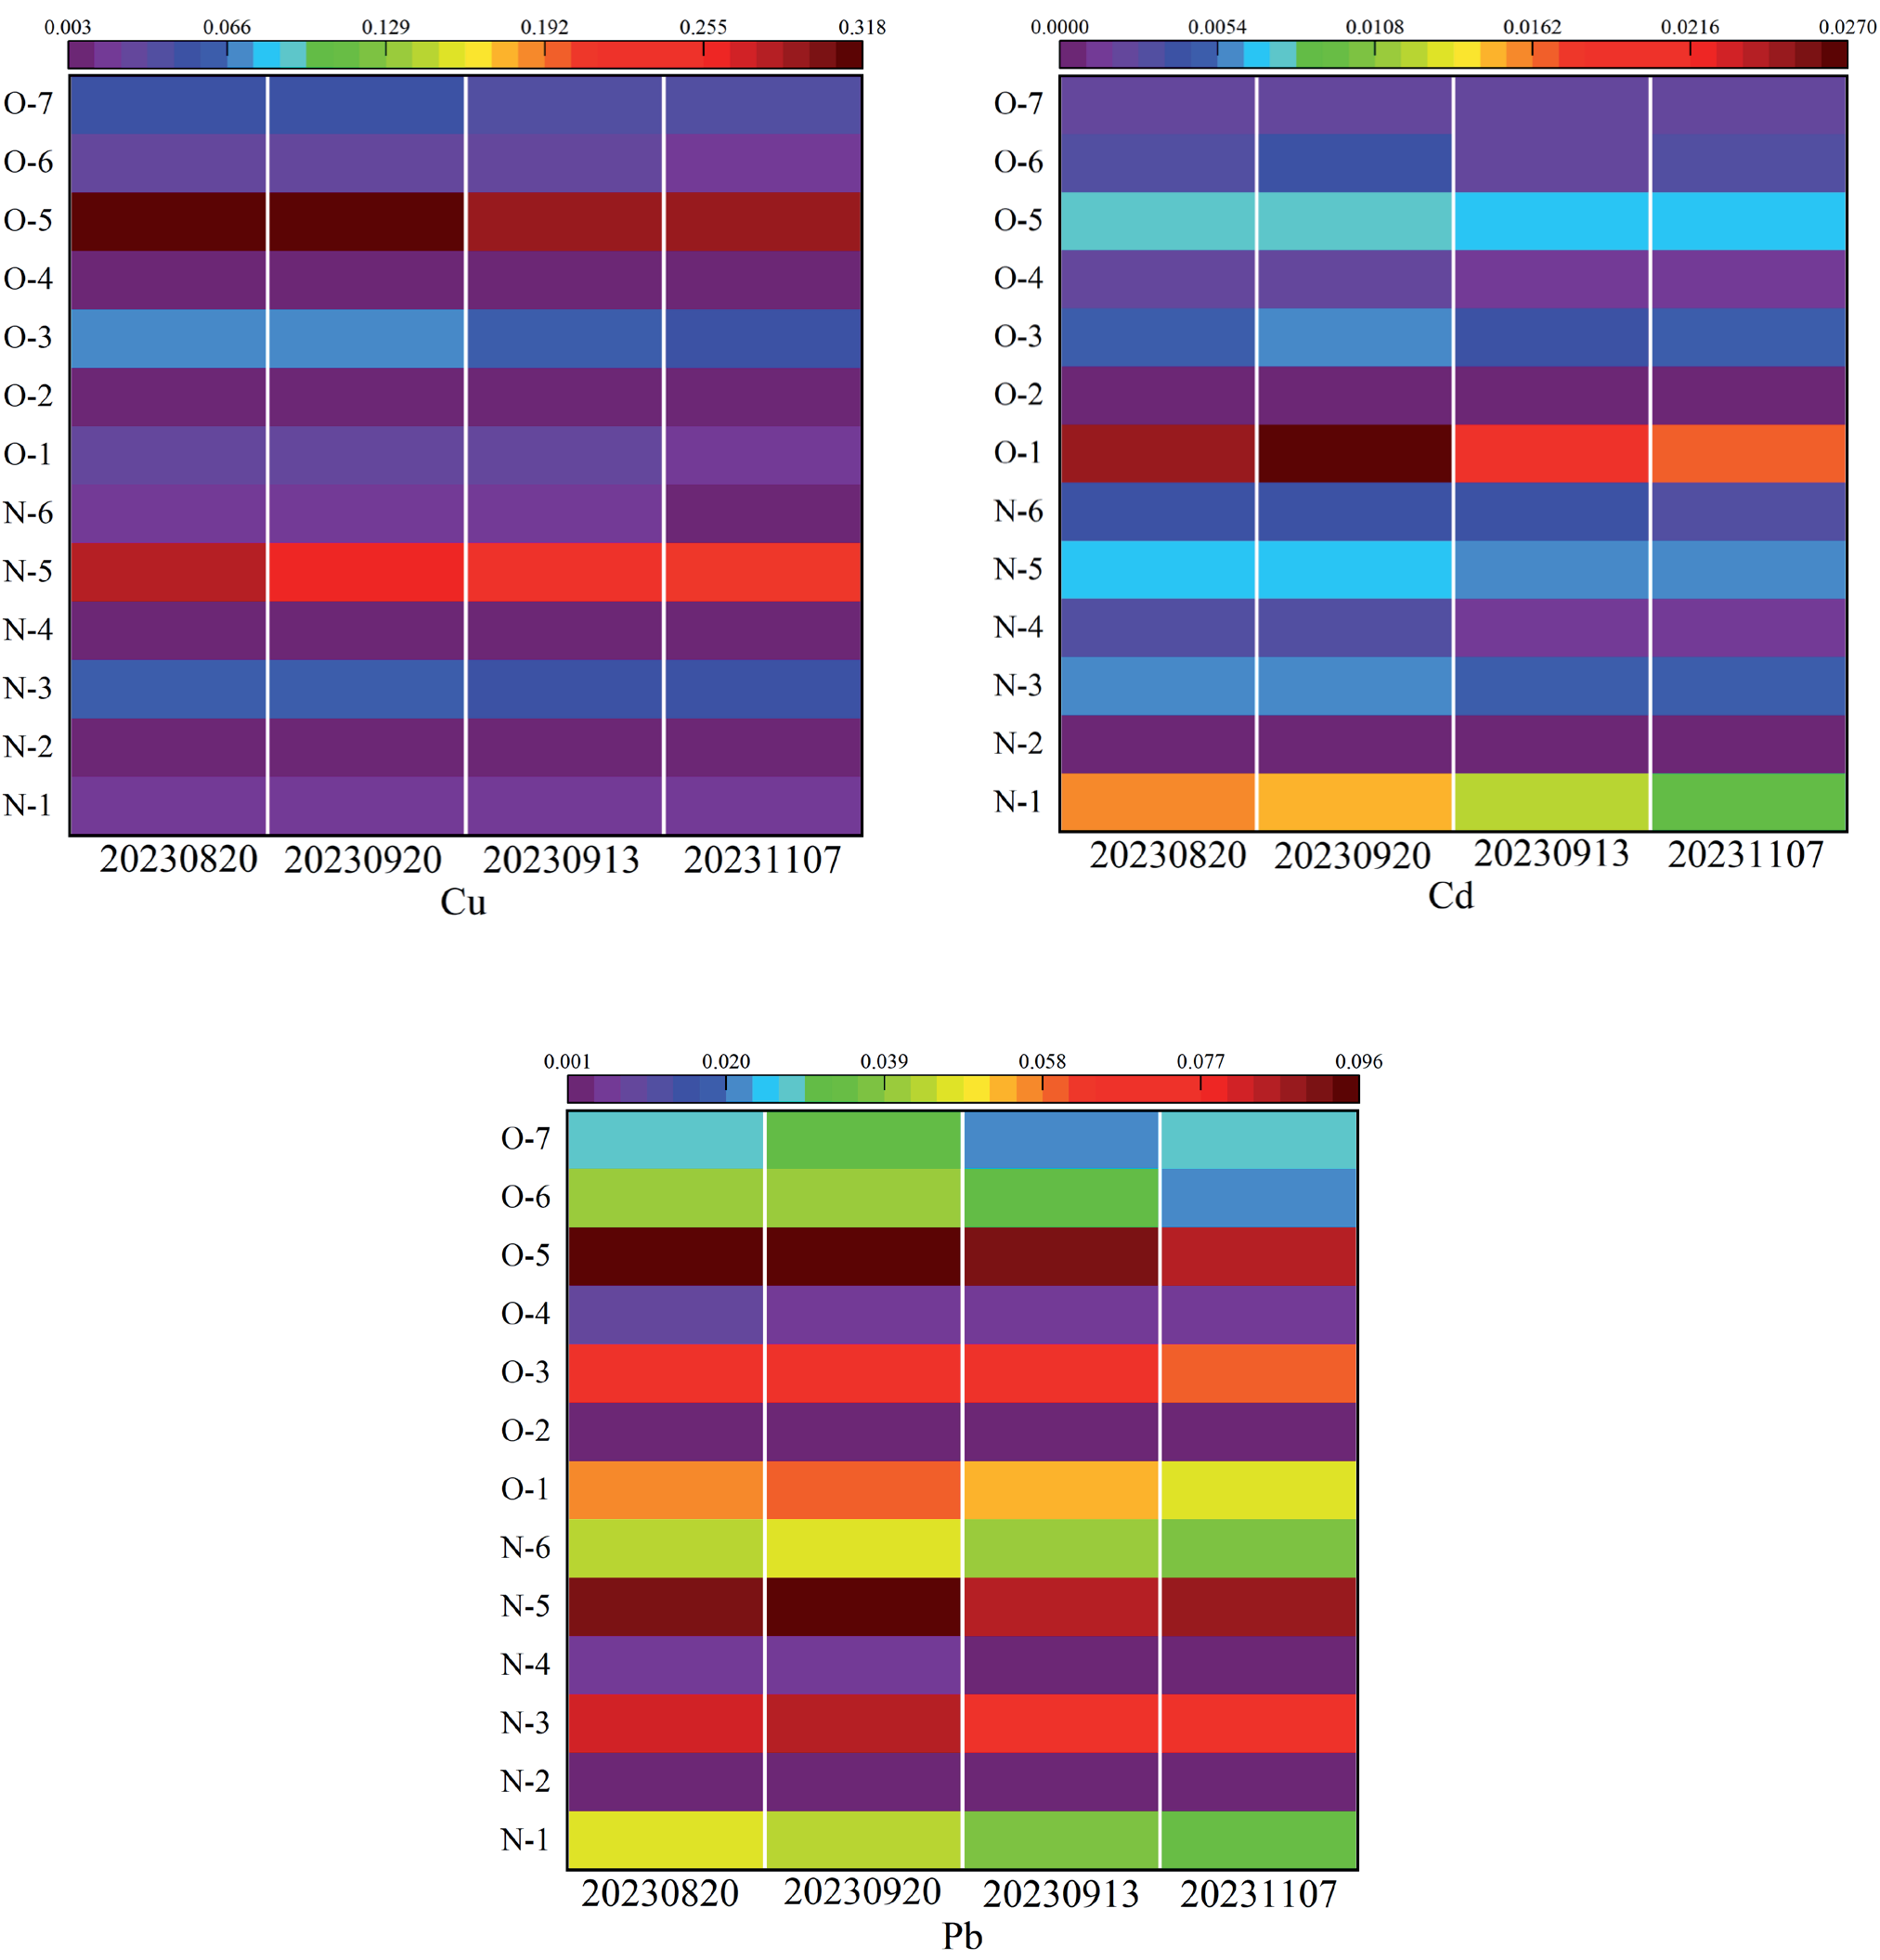
Rainfall runoff from different types of land use was monitored during four rainfall events (08/20/2023, 09/20/2023, 09/13/2023, and 11/07/2023) that occurred in the four-month period from August 2023 to November 2023. The rainfall intensities of the four rainfall events of 08/20/2023, 09/20/2023, 09/13/2023, and 11/07/2023 belonged to heavy rain, moderate rain, and mild rain, respectively. Fig. 4 shows the levels of heavy metal concentrations of Cu, Cd, and Pb in runoff rainwater at monitoring points with rainfall intensity. It can be seen that the rainfall intensity has a significant impact on the EMC of heavy metal outflow. In two heavy rain events (08/20/2023 and 09/20/2023), the concentration of heavy metals in runoff rainwater was the highest, followed by moderate rain (09/13/2023) and mild rain (11/07/2023). The possible reason is that the greater the rainfall intensity, the greater the scouring intensity of pollutants on the ground so more pollutants are stripped off the ground and mixed in the rain [24–25].
According to China’s Environmental Quality Standard for Surface Water, and based on statistics for a single effective rainfall event, the Cu concentration at 13 monitoring points in the new and old districts was generally low, all of which were categorized as having Class I water quality (4 points, accounting for 30.8%) and Class II water quality (9 points, accounting for 69.2%). The Pb concentration varied significantly, ranging from Class I water quality to Class IV water quality. The Cd concentration varied the most, however, ranging from Class I water quality to Class V water quality. In the rainwater runoff water samples for rainfall events 08/20/2023 and 09/20/2023, the Cd concentration was generally high. Based on the average statistical results, we found that among the 13 typical monitoring sites at the different types of land use in the new and old districts of Wuhu, the Cu concentration met the Class II water quality standard, and the Pb concentration met the Class IV water quality standard. The Cd concentration in the industrial area was close to the Class V water quality standard and even exceeded the Class V water quality standard in the road square, which may have been due to the high Cd concentration caused by the tire wear from road vehicles [26]. Xue et al. studied the characteristics of heavy metal pollution in rainfall runoff in Nanjing City, China, and found that the concentration of heavy metal Cd (0.05 mg/L) on roads was significantly higher than that on other land types [27], which was consistent with the results of this study.
Fig. 3.
EMC values of heavy metals in different types of land use (RSL, GL, CL, RL, IL, PBL and DL represent road square land, green land, commercial land, residential land, industrial land, public building land and dock land. The bars represent standard deviations).
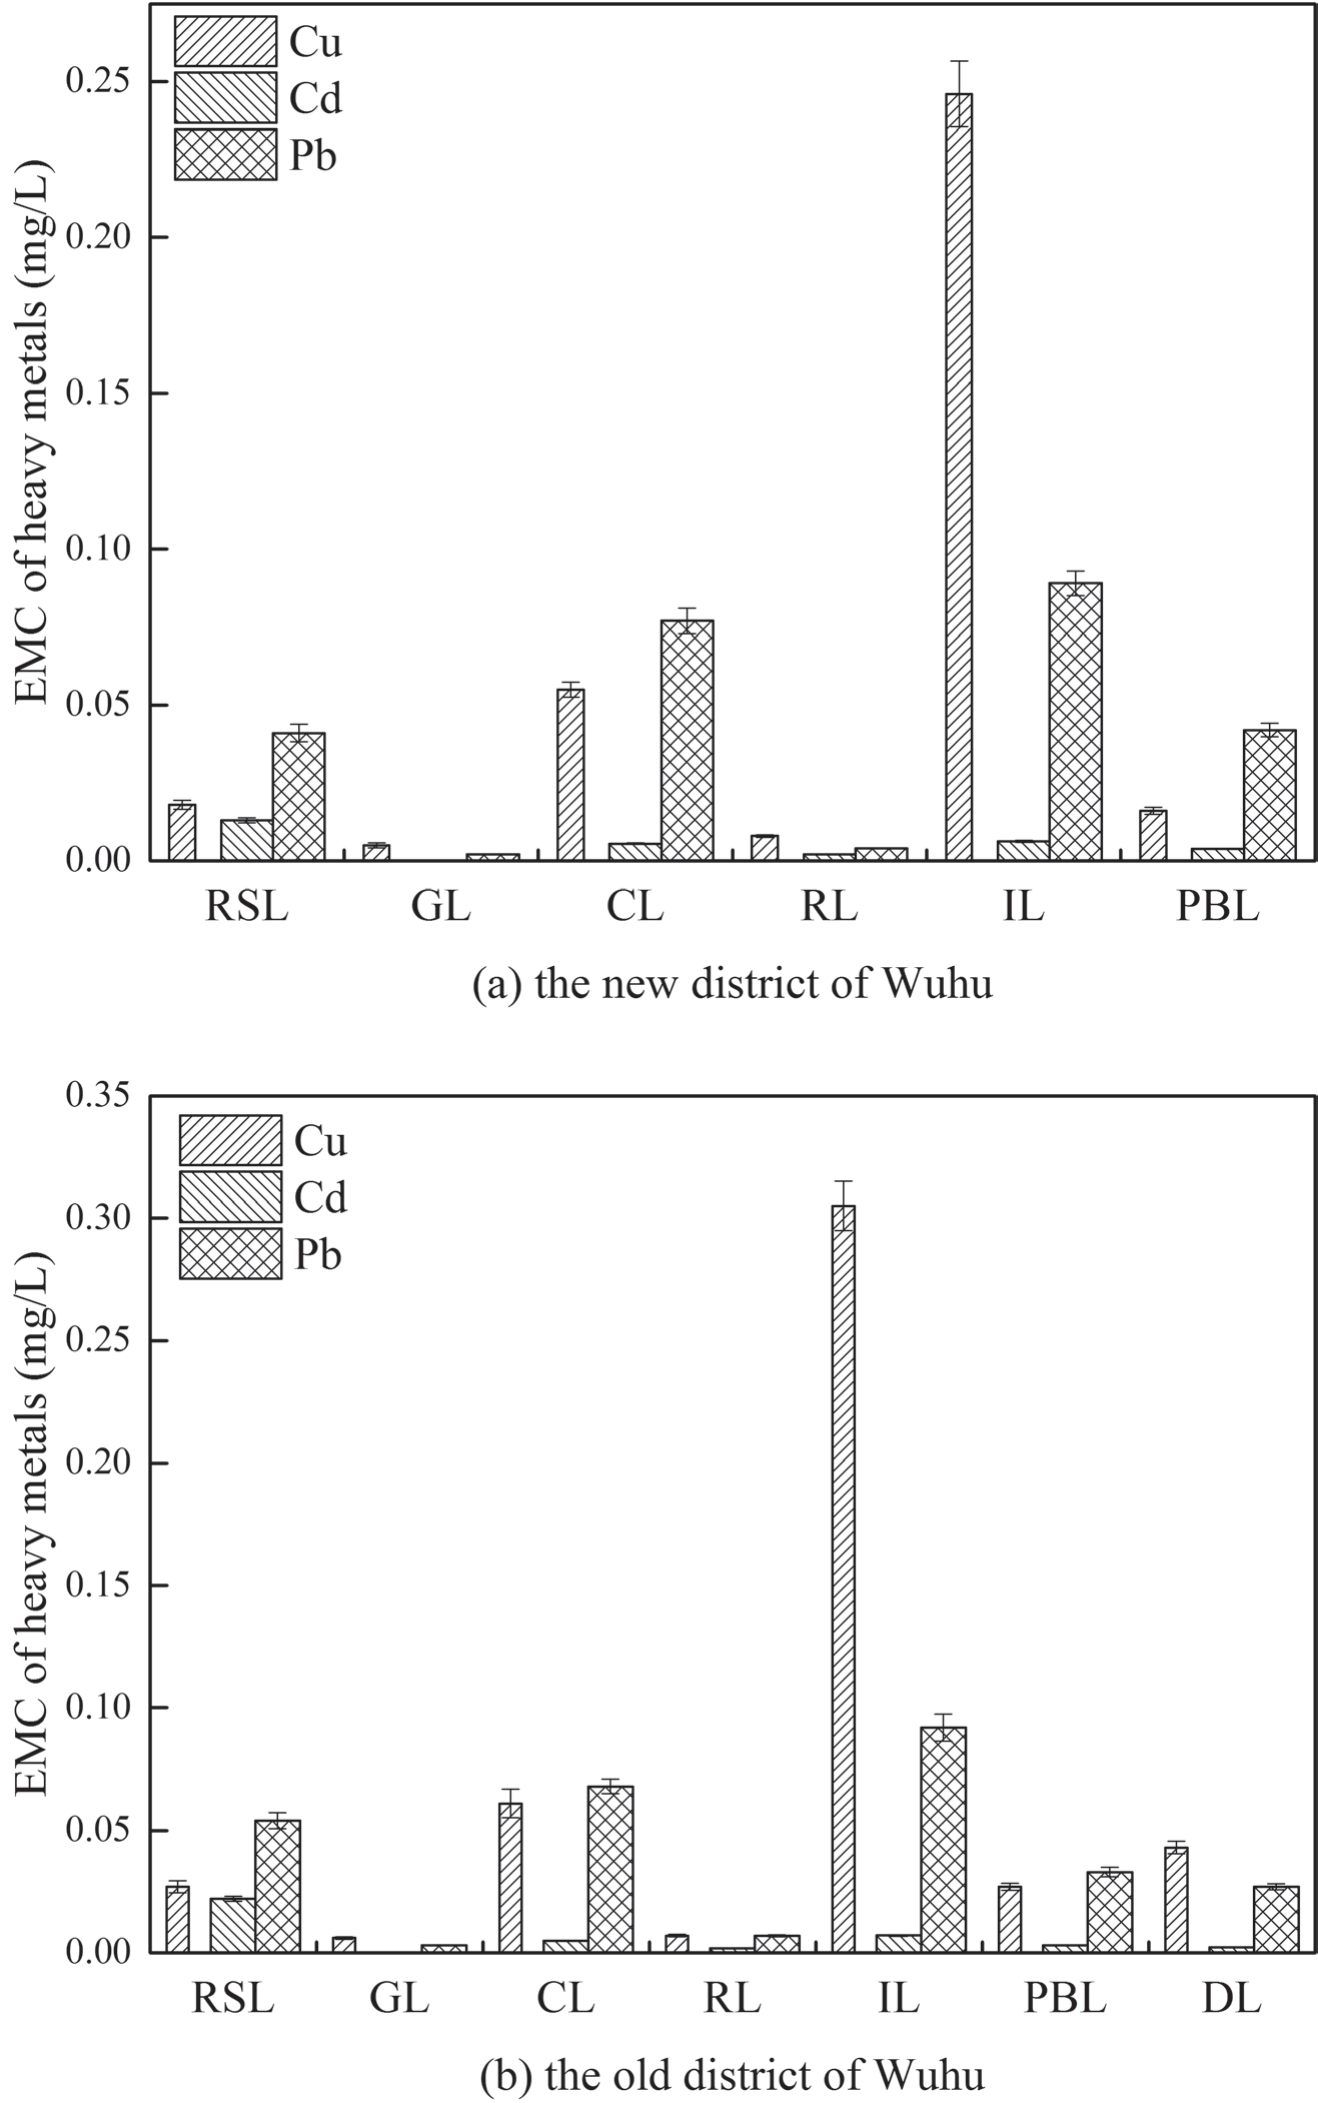
Fig. 4.
The levels of EMC values heavy metal concentrations of the four rainfall events in different types of land use (N-1, N-2, N-3, N-4, N-5 and N-6 stand for Road square land, Green land, Commercial land, Residential land, Industrial land and Public building land of the new district, respectively. O-1, O-2, O-3, O-4, O-5, O-6 and O-7 stand for Road square land, Green land, Commercial land, Residential land, Industrial land, Public building land and Dock land of the old district, respectively).
Existing Forms of Heavy Metals
Based on the EMC value, we calculated the distribution characteristics of heavy metal concentration in runoff samples collected at each monitoring point. As shown in Fig. 5, on the whole, heavy metal Cd pollutants mostly existed in a granular state, whereas heavy metal Cu pollutants existed in a dissolved state. The distribution of heavy metal Pb did not follow an obvious rule, which may have been due to the different inherent properties of heavy metals, which resulted in different forms of heavy metal pollutants in the rainwater runoff [18]. Although the road areas in the 13 monitoring points in the new and old districts accounted for only about 32.1% of the catchment area of the monitoring points, the contribution rate of rainfall runoff to the concentration of heavy metals in the water environment was between 43.2% and 72.3%. Pavement dust had a wide variety of sources and complex components and often occurred in a variety of forms. By analyzing the water-soluble state and weak acid-extraction state of the pavement particles, we more accurately evaluated the ecological risk posed by heavy metals in the rainfall runoff to the water environment [28].
Fig. 5.
Different states of heavy metals average concentrations of different types of land use in the four events (the bars represent standard deviations).
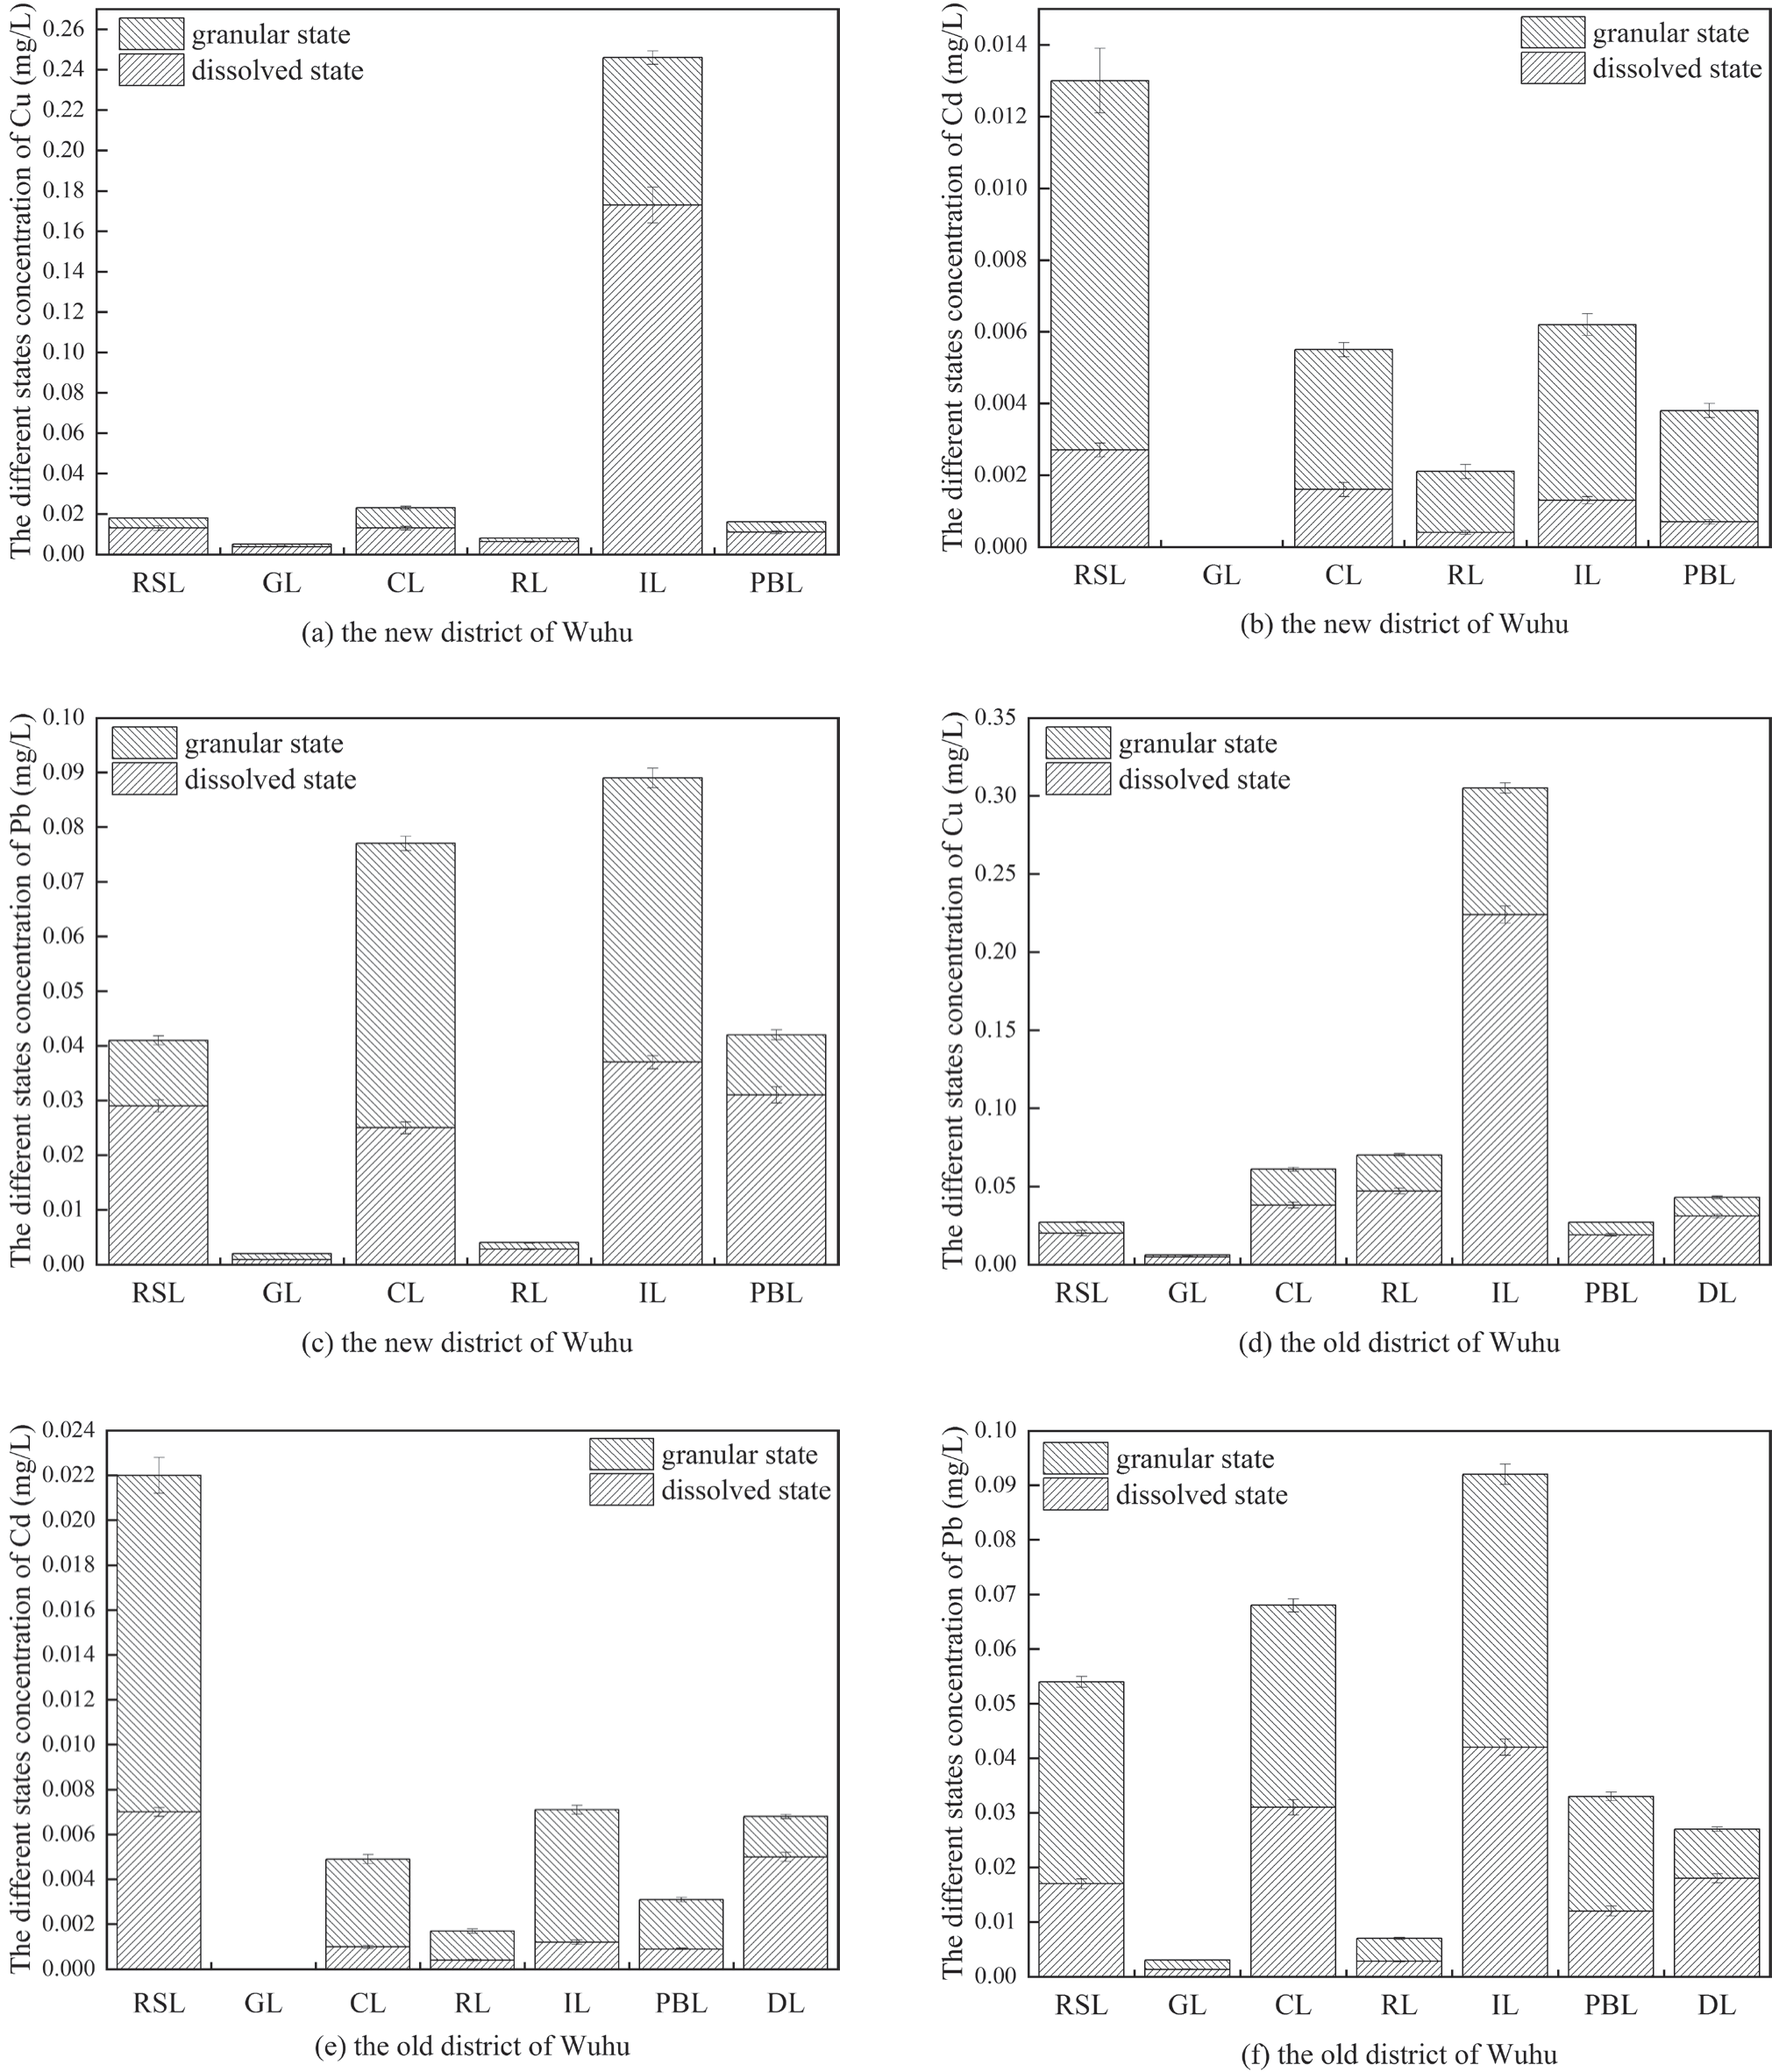
Table 4 shows the speciation distribution results of heavy metals in the pavement sediments from the various types of land use. The pollution caused by heavy metals Cu, Cd, and Pb in the pavement sediments from the new and old districts, road squares, and industrial areas was more serious than that caused by them in other types of land use. We attributed this to the following: (1) the high frequency of road vehicles and the serious wear of vehicle tires resulted in a high concentration of heavy metal residue, and (2) relevant heavy metal additives were used in the production activities for industrial delivery rooms [29]. According to the data, the total amount of heavy metals Cu, Cd, and Pb per unit mass in the pavement sediments of different types of land use in the new urban area reached 1.6704, 8.4400, and 17.0764 mg/g, respectively. In the old city, the total amount of heavy metals Cu, Cd, and Pb per unit mass of particulate matter in the pavement sediments of different types of land use reached 2.1019, 11.1069, and 18.5297 mg/g, respectively. Thus, heavy metal content in particulate matter per unit mass followed the trend of Pb > CD > Cu, and the heavy metal content in the pavement sediments in the old districts was higher than that in the new districts. The possible reasons are as follows: (1) the traffic flow in the old districts was significant, and the vehicle exhaust emission and tire wear were serious; and (2) the buildings in the old districts were dense, and the wind decreased rapidly, which made it difficult for the particles containing heavy metals to be blown away. In the new urban area, the content of bioavailable heavy metals Cu, Cd, and Pb per unit mass of particulate matter was 0.0618, 0.7703, and 0.6478 mg/g, respectively. In the old district, the content of bioavailable heavy metals Cu, Cd, and Pb per unit mass of particulate matter was 0.0988, 0.8831, and 0.8209 mg/g, respectively. The content of bioeffective heavy metals in particulate matter per unit mass followed the order Cd > Pb > Cu. In addition, Li et al. studied the migration characteristics of heavy metals in southern China and found that among many heavy metals, Cd and Pb have high migration characteristics [7], which aggravate the potential pollution risks of such heavy metals. Wuhu City is one of the typical cities in southern China, and measures should be taken to prevent heavy metals Cd and Pb from polluting the water ecological environment.
Table 4.
Existing state of heavy metals in the particulate matter according to different types of land use (unit in mg/g).
Study on the Contribution of Land Use Types to Heavy Metals in Runoff Rainwater
We divided sources of heavy metals in runoff rainwater into natural sources and man-made sources, including urban development and construction, traffic pollution, and domestic pollution [30]. According to the Bulletin on Ecological Environment of Wuhu City in 2022, the ambient air quality has improved continuously. Wuhu City had 293 days of excellent air quality (including 84 excellent days and 209 good days), accounting for 80.3%. Therefore, the heavy metal content in rainfall runoff caused by natural means, such as atmospheric deposition, was relatively low [31]. Herath [32] evaluated the pollution degree of Colombo City (CMR) by using various records of geological and biological pollution index methods and found that human activities were the main source of heavy metals in the city.
According to research reports globally, heavy metals in urban rainfall runoff are primarily from ground traffic activities and roofing. The impact of ground traffic activities is reflected mainly in automobile exhaust emissions, car body wear, aging of pavement materials, and building dust. Gunawardana [33] found that road dust contained a large number of slender particles with rough surfaces caused by tire wear and further showed that these particles contained heavy metal elements, such as Fe, Cu, Zn, Ni, and Pb. The content of heavy metals from roof runoff was affected mainly by atmospheric dustfall and roof material corrosion [34].
We observed significant differences in population density, traffic conditions, and underlying surface characteristics of the monitoring points for the different types of land use, which contributed to significant differences in heavy metal distribution. The industrial zone contains a large number of industrial workshops, which are engaged in the production of a variety of commodities. The raw materials of these commodities contain a variety of heavy metals, which have caused the most serious heavy metal pollution in the industrial zone. Road squares and commercial areas are located in the most frequent areas of ground traffic and human activities. Their cleaning methods include manual cleaning and high-pressure water guns, which are used to wash the road surface, and as a result, their heavy metal pollution is more serious. In contrast, decoration materials, such as coatings, coils, and paints, are used in the business district. The busy and crowded business districts have introduced serious obstacles to the driving of motor vehicles. Frequent braking causes tire wear and brake component wear and also increases combustion exhaust gas. According to a report by Wang [35], the Cu concentration in road sediments was more than eight times that of the background level in typical deceleration environments, such as traffic lights, circular roads, and intersections. In this study, we confirmed this phenomenon. The concentrations of heavy metal Cu in the new and old commerce districts were 0.055 mg/L and 0.061 mg/L, respectively, and its pollution situation was second only to that in the industrial district. There was less traffic in public building areas and dock monitoring points, and there was more traffic during specific time periods, but the duration of this traffic was not long and the overall pollution level was not high. The roads inside the residential areas are narrow, and the traffic of motor vehicles is limited. Many sanitation workers are responsible for the cleanliness of these residential areas; it was difficult to form the cumulative effect of heavy metal pollution. Thus, the degree of heavy metal pollution was light. The green area does not have motor vehicles, and people’s activities are limited. In addition, because the green land type is highly permeable, it did not accumulate heavy metals. The green plants could absorb related heavy metals, and therefore, the heavy metal pollution in the green area was the lightest.
Comparison of Ecological Risk Assessment Results
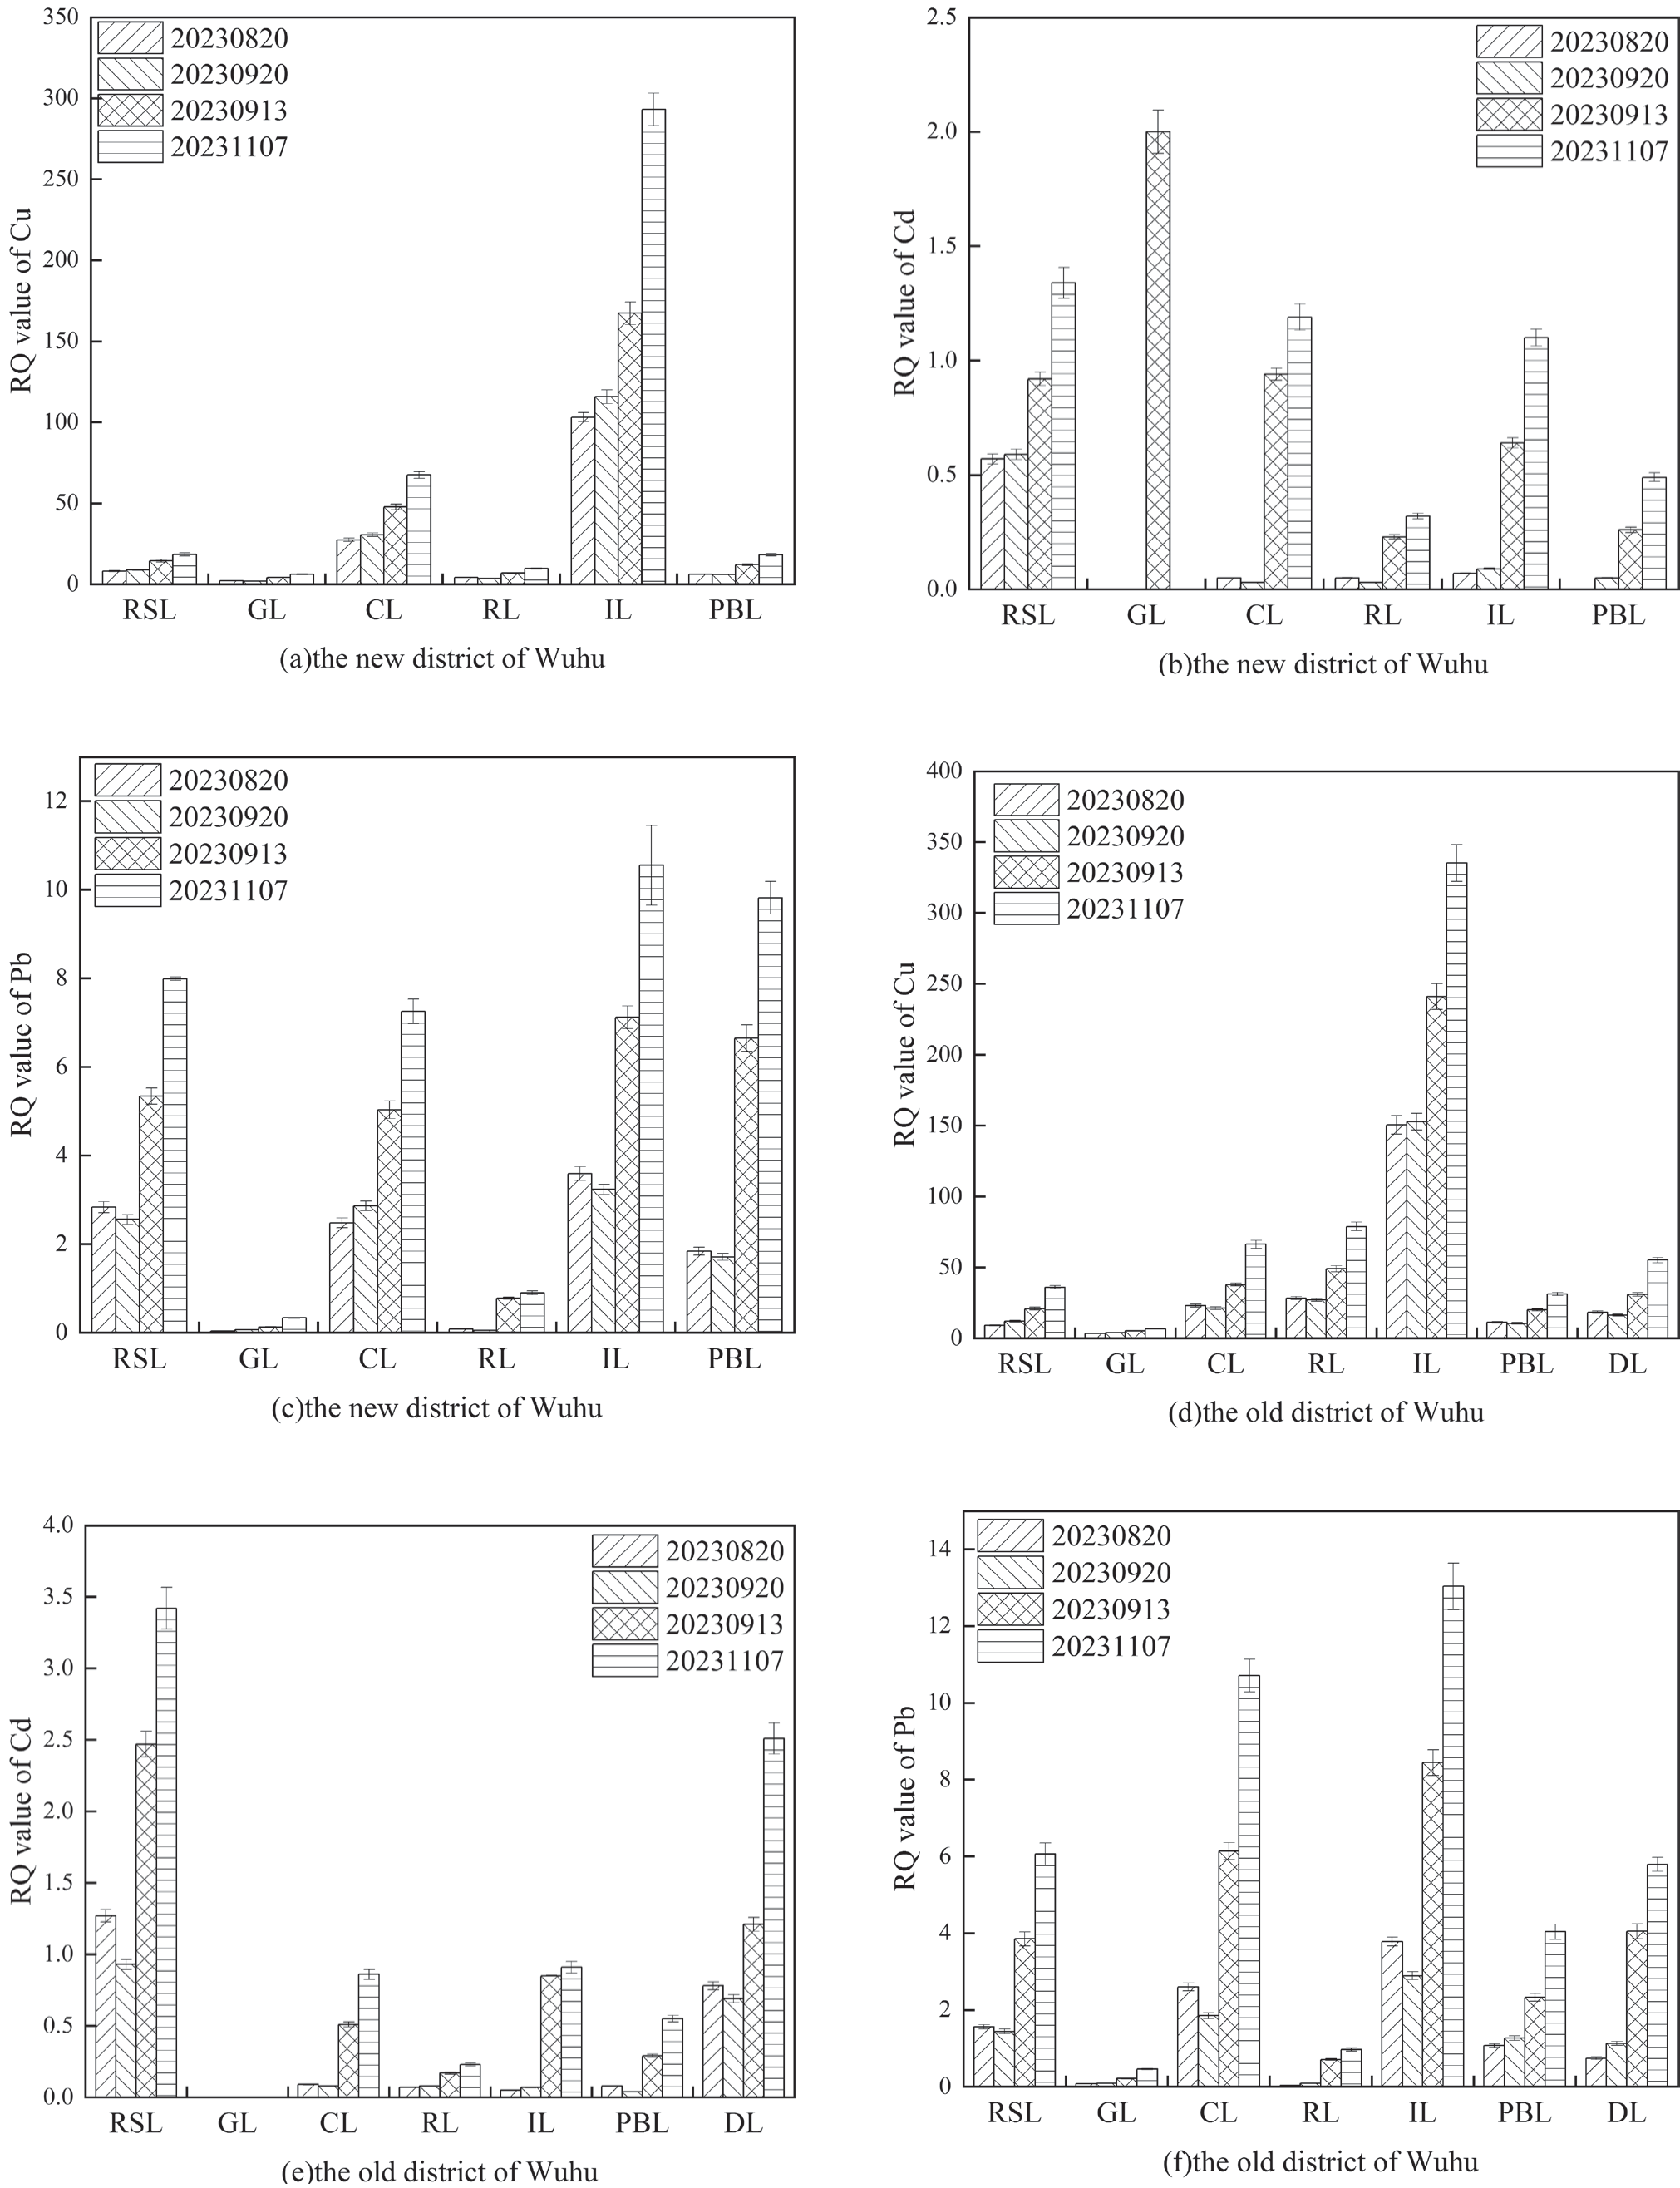
We obtained the concentration corresponding to a 5% cumulative probability for each heavy metal from the SSD curve, and the HC5 values of Cu, Cd, and Pb were 2.09, 7.76, and 12.59 μg/L, respectively [18]. The AF value used in this study was 2, and the PNEC values of Cu, Pb, and Zn were 1.045, 3.88, and 6.295 μg/L, respectively. According to the significance of the HC5 and PNEC values, the smaller the value was, the greater the potential ecological risk of the toxic pollutant, and the more sensitive freshwater organisms were to changes in its concentration [36]. The concentration of heavy metals in runoff water samples was divided into two parts (dissolved and granular), and the heavy metals in the granular form had different modes of occurrence. Among these different modes, the water-soluble and weak acid–extracted forms were highly mobile, making it easy for them to be exchanged with the upper water body and thus have a strong ecological effectiveness. Therefore, in the ecological risk assessment of heavy metal concentration in rainfall runoff, we calculated only the part with ecological effectiveness. We selected 13 monitoring sites with different types of land use to calculate the RQ values of heavy metals during the four rainfall events 08/20/2023, 09/20/2023, 09/13/2023, and 11/07/2023. Table 5 presents the statistical results of the average RQ values, and Fig. 5 shows the RQ values of heavy metals Cu, Cd, and Pb for the four rainfall events at each monitoring site. From the comprehensive average, the ecological risks posed by the three heavy metals were in the following order: CD < Pb < Cu and the ecological risks posed by different heavy metals were slightly different according to the different types of land use.
As shown in Fig. 6, the RQCu values of different land use types in the new and old districts ranged from 2.08 to 335.24, both of which were greater than 1, that is, Cu belonged to the high ecological risk among all types of land use. Because the industrial zone was engaged in a variety of commodity production activities and the raw materials contained a variety of metals, the higher RQCu value was concentrated mainly in the industrial zones in the new and old districts (103–335.24). In addition, among the four rainfall events, the RQCu values of the different types of land use in the new and old cities all reached the maximum value during the rainfall event 11/07/2023, which may have been due to the high cumulative pollutant load on the ground caused by the greatest number of dry days before the rainfall event on 11/07/2023 [37].
RQCd values for the different types of land use in the new and old districts ranged from 0 to 3.42, with low ecological risk (RQ < 0.1), medium ecological risk (0.1 ≤ RQ ≤ 1), and high ecological risk (RQ > 1) accounting for 46.15%, 38.46%, and 15.39%, respectively. The maximum value of RQCd (3.42) was distributed in the road squares, followed by an RQCd value of 2.51 for docks, which was inconsistent with the distribution law of RQCu value. The possible reason for this inconsistency is that the vehicles in road squares and docks were frequent and the tires were seriously worn, which made the load of Cd metal pollutants on the ground higher than that for other types of land use. Similar to the distribution phenomenon of the RQCu value, the RQCd values for different types of land use in the new and old districts also reached the maximum during the rainfall event 11/07/2023 because of the higher number of dry days before rainfall.
The RQPb values for different types of land use in the new and old districts range from 0.04 to 13.03, with low ecological risk, medium ecological risk, and high ecological risk accounting for 15.38%, 17.31%, and 67.31%, respectively, which showed that the ecological risk posed by Pb was relatively high. The maximum value of RQPb (13.03) was distributed in the industrial land types, and the RQPb values for the different land types in the new and old districts also reached the maximum values during the rainfall event 11/07/2023, which was consistent with the distribution law of RQCu values.
We used HC5 values based on the SSD curve combined with the RQ evaluation method to evaluate the ecological risk posed by heavy metals in this study. The results showed that the average RQs for the different types of land use for Cu, Cd, and Pb in the new and old districts were 47.83, 0.53, and 3.24, respectively, and the overall ecological risk posed by heavy metals was in the following order: Cd < Pb < Cu. This result indicated that the heavy metal Cd posed a medium ecological risk to aquatic organisms, whereas the heavy metals Pb and Cu posed a high ecological risk to aquatic organisms. As discussed in Section 2.1, however, the analysis results for the heavy metal pollution level of the runoff samples showed that the Cu concentration met the standards of Class I water quality (accounting for 30.8%) and Class II water quality (accounting for 69.2%). Therefore, we considered that the formulation of the Environmental Quality Standard for Surface Water in China (GB3838–2002) did not fully consider the ecological impact and underestimated the ecological risks of some metals. Cao [38] conducted an ecological risk assessment of 7 typical heavy metals in water bodies of the Henan section of the Yellow River in China. The results showed that Cu, Cd, and Pb all showed high ecological risks in each river basin, and the highest rates of heavy metal content exceeding HC5 (chronic toxicity) were 88.7%, 55.8%, and 65.5%, respectively. These results indicated that the heavy metal pollution in the water bodies of major river basins in China was severe. If the Environmental Quality Standard for Surface Water (GB3838–2002) is used to evaluate the degree of water pollution in practical projects, the actual impact of heavy metals on aquatic organisms may be ignored, resulting in the long-term poor health of waterbodies in China.
Table 5.
Statistical results from four rainfall events: average RQ values of heavy metals for different types of land use.
Fig. 6.
RQ value of heavy metals in rainfall events in different types of land use in Wuhu City (the bars represent standard deviations).
A significant amount of runoff rainwater is collected by rainwater pipes and flows into rivers. To date, scholars have conducted ecological risk assessments on lakes and marine water quality [39–40]. In a risk assessment of heavy metal pollution in China’s lakes, Zhang [18] showed that there were potential ecological risks posed by the heavy metal Cu in many lakes. The Cd concentration in lakes was extremely low, so there was no ecological risk to freshwater lakes. Lakes with heavy Pb pollution are located primarily in economically developed areas, which may be the result of the significant use of leaded gasoline. The results of an ecological risk assessment in Tianjin Bohai Bay by Jin [41] found that the RQ values of Cu at all stations were greater than 1, which indicated a high ecological risk. The RQ value of Cd was less than 0.1, which showed a low ecological risk. The RQ value of Pb was between 0.1 and 1.0, which showed a moderate ecological risk. These studies demonstrated that the concentration of heavy metals in the water environment reached a level that could adversely affect aquatic organisms. As one of the main sources of water pollution, rainfall runoff pollution has made a great contribution to the rate of heavy metal pollution in water bodies. Therefore, it is necessary to take certain treatment measures for urban runoff rainwater. For example, efforts should include strengthening urban environmental management and increasing the intensity and frequency of road cleaning; ensuring the rational use of surface greening and paving permeable pavement materials; and, according to the terrain, setting up grass planting ditches and detention ponds. On the basis of the different components and proportions of pollutants in runoff rainwater affecting different types of land use, different treatment methods should be adopted to reduce environmental pollution, which supports the practical significance of this study [42–44].
Conclusion
In this study, we selected different types of land use in the old and new districts of Wuhu City as the research areas and analyzed the concentration and distribution characteristics of heavy metals in the rainfall runoff samples. According to the Environmental Quality Standard for Surface Water, SSD method, and RQ, we conducted an ecological risk assessment of heavy metals with biological effectiveness. The main conclusions of the results are as follows: (1) For the runoff water samples from 13 monitoring points of seven typical types of land use in Wuhu City, the Cu concentration met the Class II water quality standard, and the Cd concentration (Class I–V water quality standard) and Pb concentration (Class I–IV water quality standard) varied widely. (2) Different types of land use led to notable differences in the distribution of heavy metals in the rainfall runoff. The degree of pollution of heavy metals in the industrial areas was the highest, followed by that in road squares and commercial areas, and the degree of pollution of heavy metals in residential areas and green areas was relatively low. (3) Based on the SSD method combined with RQ values, we found that the ecological risks posed by different heavy metals in different types of land use were also different, and the ecological risks posed by the three heavy metals Cd, Cu, and Pb followed a trend of Cd < Pb < Cu. (4) The formulation of an Environmental Quality Standard for Surface Water in some areas like Wuhu City, China, has failed to fully consider the ecological impact and has underestimated the ecological risks posed by some heavy metals. Therefore, it is necessary to strengthen urban environmental management.

