

Introduction
Nitrous oxide (N2O) is the third most important anthropogenic greenhouse gas, atmospheric levels of N2O reached new highs at 334.5 ppb in 2022, with a global warming potential approximately 310 times higher than CO2 [1]. Dung and urine excreted onto grasslands are a major source of N2O [2]. The application of dicyandiamide (DCD) was an effective #The authors contributed equall way of decreasing N2O emissions from nitrification process [3, 4].
The N2O production by the slurry amended soil was twice as that of the mineral amended one [5]. DCD retained soil nitrogen in the ammonium form, which is expected to reduce nitrogen loss [6]. Emission factors were 0.89% and 0.59% for urea fertilizer and urea with DCD in south-west Scotland, this indicated a reduction of 33.7% on N2O [7]. DCD reduced N2O emissions by 33.0% in the UK grasslands [3]. DCD treatments decreased alpine meadow N2O emissions by 36.3% on the Tibetan Plateau [8]. Application of DCD reduced N2O emissions to 4.8 kg ha−1, representing 40.0% reductions [9]. DCD reduced N2O emissions from slurries applied in the spring by 45.0% [10]. To sum up these results, DCD reduction rate ranged from 30.0 to 45.0% [6-10]. Furthermore, DCD was highly effective in reducing N2O emissions, with the N2O emission factor of the urine being decreased by 58-63% in New Zealand [11]. The reduction in the N2O emission factor by DCD ranged from 58% to 83% in New Zealand [12]. Consequently, the incorporation with DCD supplement was a robust method to successfully reduce emissions of N2O in global grasslands. However, it was also reported that addition of DCD to urine caused no significant reduction in emissions [13]. In addition, strong heterogeneity was reported by aforementioned manipulated results across the global grasslands.
Global N2O emission rates were affected by soil nitrification and denitrification processes [12]. N2O emitted in a greater proportion from nitrification rather than from denitrification in the slurry treatment grasslands [5]. The episodic N2O emissions was a major source of agricultural fields N2O following heavy rainfall [14]. Numbers of ammonia-oxidizing bacteria amoA gene copy was significantly inhibited by DCD [15]. Ammonia oxidizing bacteria was more greatly inhibited by DCD [8]. DCD appear to be less effective at reducing N2O emissions due to the higher soil temperature [3]. Soil pH and soil organic matter were considered to be the most important factors influencing the inhibition efficiency of DCD [16]. DCD had no effect on grasslands N2O at the Southland site, probably due to extremely wet soil conditions [17]. DCD efficiency was positively correlated with soil moisture and temperature, but negatively correlated with soil bulk density [4]. In summary, ammonia-oxidizing bacteria, precipitation, soil temperature, pH and organic matter were referenced as robust driven factors on grassland N2O emission rates. In addition, the effects of DCD on N2O emission rates were driven by multifactor across the global grasslands.
Previous studies have focused on the response of N2O emission rates to DCD in single manipulation, and little study explored its driven factor through meta-analysis. Furthermore, there is a lack of systematic quantitative analyses of the effect size of N2O rates to DCD application. In this study, the objective of this study was to investigate the impacts of different dosages of DCD on N2O emission rates. Furthermore, we hypothesized that DCD would significantly reduced N2O emission rates with the dosage increasing. Meanwhile, precipitation and air temperature and bulk density were the driven factor of effect size. Our study aimed to provide a scientific basis for mitigation N2O emission rates in grazing grasslands.
Materials and Methods
Data Compilation
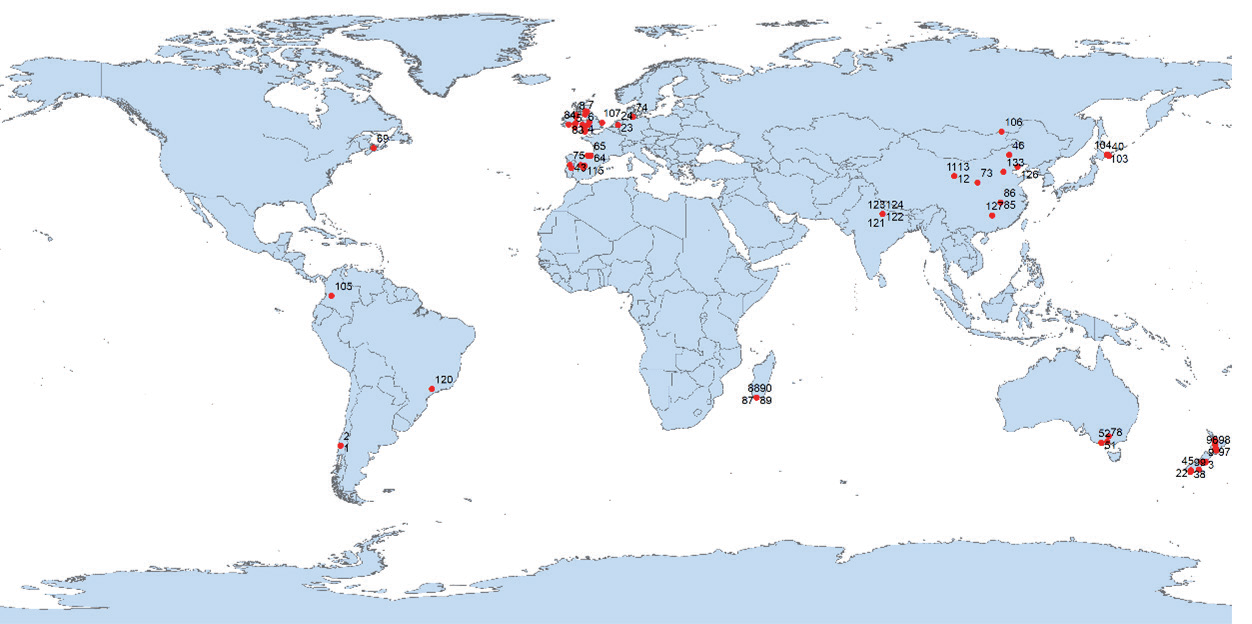
We collected published papers using the keywords “nitrification inhibitors” or “dicyandiamide” or “DCD” and “grassland” and “N2O” or “nitrous oxide” to search web of science and Chinese articles database (China National Knowledge Internet, https://www.cnki.net) from January, 1990, to March, 2023. Total 154 articles were selected, and we screened the full articles to ensure that all the following criteria were met: (1) Concentrations of N2O rates were measured in both DCD application and the control plots; (2) The concentration of N2O was determined by gas chromatography. Furthermore, N2O emission rate was average value during the whole research, and unit was μg/m2/hour. All used data were collected from published article including DCD dose. In this study, we indicated that DCD dose ranged from 1.7 to 60 kg/hm2, and the recommended dose of DCD was approximately 10 kg/hm2. DCD were divided into three groups, including light group (1.7-8.0 kg/hm2), moderate group (10-15 kg/hm2) and high group (20-60 kg/hm2). Partial data were extracted using WebPlotDigitizer software. We collected 133 groups of field experimental results from 69 articles (Fig. 1) and recorded climatic factors, soil and plant characteristics. If the standard error was missed, 1/10 of the average value was used as the default value, if not, then used the average standard error.
Fig. 1.
Geographical locations are showed of the 133 studies in this meta-analysis across the global, and locations of red dots may present multiple effect sizes.
A random-effect-model meta-analysis was performed, and log response ratios were calculated as a measure of the effect size. A 95% confidence interval (95% CI) was calculated.
where Xe and Xc are the mean values of N2O emission rates in the DCD treatment and control, respectively.
Variance of lnR was calculated as follows:
where Se, Ne, xe, Sc, Nc and xc represent the standard deviations, sample sizes, and mean emission values of N2O rates and controls, respectively.
The effect size of DCD on N2O rates and confidence interval based on the random effect model were calculated as follows:
Individual field study weight
where vi and τ2 represent the intra- and inter-study variance of N2O rates.
Effect size
Standard error
95% confidence interval of effect size: CI = y̅ ±1.96 SE, yi was the single study effect size value.
Statistical Analysis
Meta-statistical analyses were performed using R 3.6.2, and we ran a random-effect model of meta-analysis in metafor1.9-8 (Benítez-López et al., 2017). Random effects models were conducted to analyse the estimated values and standard errors (rma). The effect of climatic factors and soil characteristics on effect sizes of DCD were analysed using mixed effects models (mods). There are likely biases due to the selection of negative results. In our study, the regression test for funnel plot asymmetry of publication bias was analysed using a mixed-effects meta-regression model (funnel and Egger’s test, rma in R 3.6.2).
Publication Bias Analysis of Effect Sizes of DCD on N2O Rates
Quantitative evaluation of the effect size was achieved from published papers. The bias in the evaluation results was perhaps affected by our selection of the papers. This result indicated that there was not significantly affected by a publication bias using Egger’s regression test for funnel plot asymmetry (z = -0.845, p = 0.398). Thus, confirming that this study had no preference for paper publishing, and that the results had full credibility.
Result
Effect Size of DCD Application on N2O Emission
Rates in the Global Grasslands
Overall, DCD application had a significantly negative effect on N2O emission rates in the global grasslands, and the effect size was significantly different from zero (P<0.0001, Table 1). The estimated value of effect size was -0.784±0.048 (95% confidence interval: -0.877 – -0.691, P 0.0001), indicating a reduction of 54.34% across the global grasslands. Effect sizes varied from -2.430 ± 0.003 to -0.006±0.039 (Fig. 2). Average N2O emission rates were approximately 70.171±8.659 and 177.645±23.757 μg/m2/hr in DCD application and control plots.
Effect Size of Different DCD Application Dosages on N2O Emission Rates
There was a significant difference between different dose of nitrogen fertilization (P<0.05, Table 2). Effect sizes of light, moderate and high dose DCD were -0.587±0.127, -0.823±0.057 and -0.739±0.102, separately. Moderate DCD decreased N2O emission rates with the best mitigation effect of 56.09%. Decrease ranges of light and high dose of DCD were 44.40% and 52.24%. Meanwhile, other moderators would be involved because tests for residual heterogeneity (Qe = 38289.563, df = 130) were also significant (P<0.0001).
Effect of Soil and Climate Factors on the Effect Size Based on Explained Moderator Heterogeneity Statistic
Precipitation, bulk density (P<0.01) and air temperature (P<0.05) significantly influenced effect size based on test of moderators (Table 3). Mixed effect model results indicated that three factors could explain 16.93%, 12.31% and 3.02% variations in effect size. Furthermore, the precipitation was negative with effect size of DCD, but soil bulk density and air temperature were positive with effect size. Meanwhile, pH, organic matter and altitude showed insignificantly positive effect on the effect size.
Table 1.
Effect size of DCD on nitrous oxide emission rates in global grasslands.
| Items | Effect sizes | Decrease range (%) | 95% confidence interval | P | df |
|---|---|---|---|---|---|
| DCD | -0.784±0.048 | 54.34 | -0.877 – -0.691 | <0.0001 | 132 |
Discussion
In grazed dairy pasture systems, a major source of N2O is the nitrogen returned in the urine from the grazing animal [18]. The N2O emissions reduction ability of DCD application on urine and dung patches was attracting much concern in global grasslands [19, 20].
In this study, we indicated that dose of nitrification inhibitor DCD significantly reduced global grazed grasslands N2O emissions rates by approximately 54.34%. Similar studies were also reported for instance, DCD reduced N2O emissions by 8% and 44% in dairy slurry and urea in Chile grasslands, respectively [21]. N2O emissions could be reduced by up to 16 % and 51 % through the use of DCD in England and Wales [22]. Addition of DCD to cattle urine also reduced N2O emission between 23% and 67% [23]. Application of DCD reduced N2O emissions from a urine patch by 27% in mid-summer and by 47% in mid-spring and in Australia [24]. DCD significantly inhibited the N2O emission from urine by 33%-72% at a dairy farm in South Otago [25]. In conclusion, our result was comported with these results. Meanwhile, increased DCD from 10 to 30 kg DCD ha−1 improved efficacy by significantly reducing N2O emission from 34% to 64% [26]. DCD application reduced N2O emissions by 40-50% from both forage species in southern Brazil [19]. DCD reduced the amount of N lost as N2O by 42% and 60% when applied with calcium ammonium nitrate and cattle slurry, respectively in Spain [27]. DCD significantly reduced cumulative N2O emissions by 47% and 70% at both Irish grasslands [6]. Average N2O emission rate in the DCD treatment significantly decreased by 50.7% in Gansu province, China [28]. Furthermore, some extreme inhibition reductions were introduced as following. Application of DCD inhibited the nitrification process, resulting in lower N2O emissions approximately 54%-78% from urine patches [29]. By treating with DCD, N2O emissions were mitigated by 76%, from 26.7 to 6.4 kg N2O-N ha-1 in the South Island of New Zealand [30]. Total N2O emissions were reduced from 46 to 8.5 kg N2O-N ha-1 with DCD, representing an 82% reduction [31]. In addition, reduction range of DCD was varied from 8% to 82% across these studies, and we quantitatively evaluated the effect size involving different measurement weights.
Fig. 2.
Forest plots of 133 effects size estimates for responses of nitrous oxide emission rates to DCD. The black dots indicated 95% confidence intervals. Red line and red dashed line meant effect size = 0, and averaged effect size = -0.784 in this study.
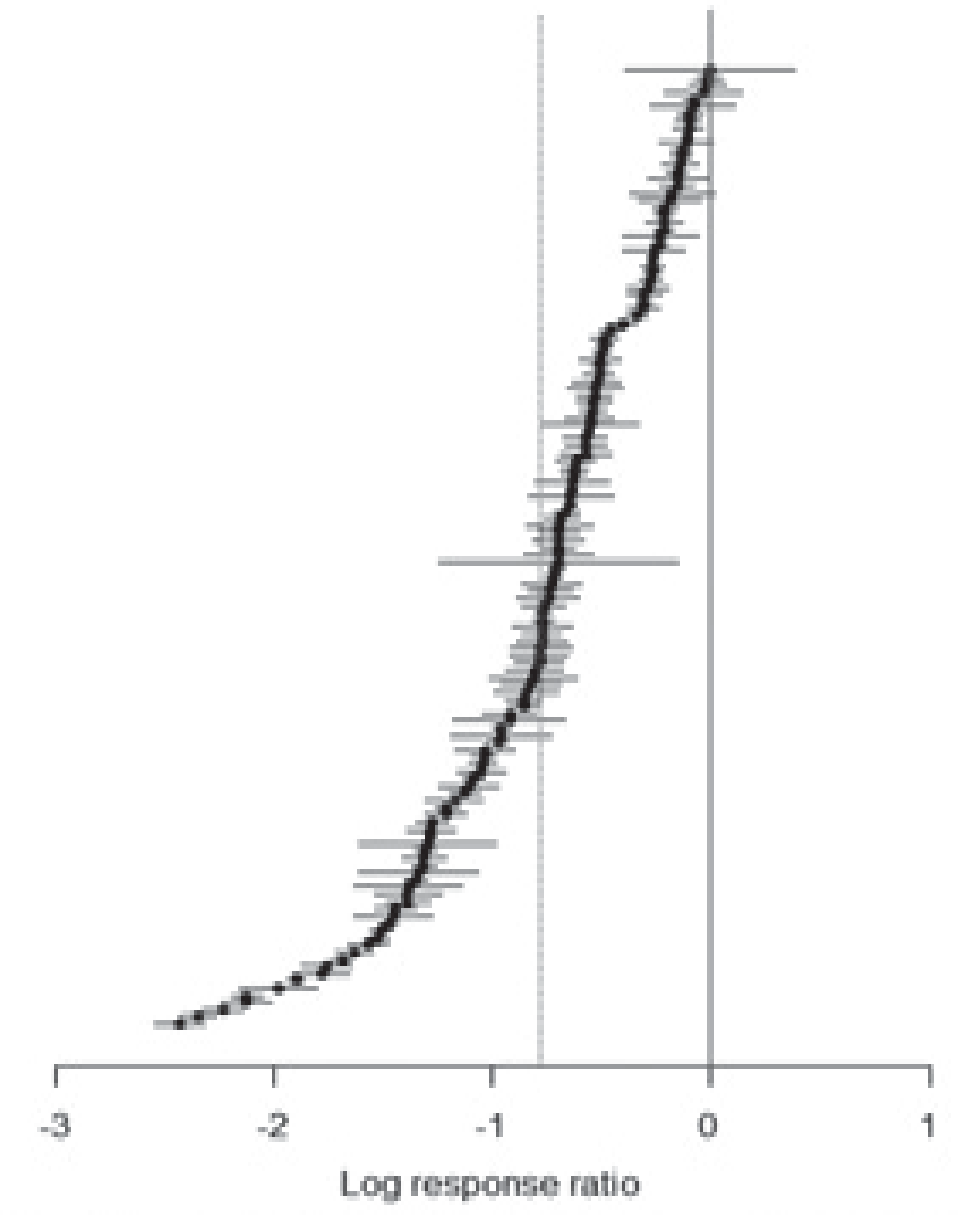
Table 3.
Analysis of air temperature and altitude and other factors on effect sizes.
In the present results, two reasons were taken into account for this reduction of DCD on grasslands N2O emission rates. Firstly, DCD had a significant impact in reducing the AOB amoA gene copy numbers especially in the high nitrogen application rates [12]. Secondly, DCD resulted effective in reducing the nitrification rate by 53% in the slurry application [5]. Thus, DCD application increased the length of time mineral nitrogen in the ammonium form and significantly reduced soil nitrate by 47%, which significantly reduced N2O emissions and leaching nitrogen losses [32].
In this study, we also discovered that precipitation, bulk density (P<0.01) and air temperature (P<0.05) significantly influenced effect size based on test of moderators. These three factors could explain 16.93%, 12.31% and 3.02% variations in effect size (Table 3). This was because all precipitation, bulk density and air temperature affected nitrification microbial abundance and activity, then controlled N2O emissions rates. This result was newly concluded under global grasslands ecosystem scale in this study. Previous studies revealed that soil moisture has a major influence on ammonia oxidizing and denitrifying microbial communities [33]. DCD decreased cumulative N2O emissions especially for the drier and sandier soil [22]. Meanwhile, we collected 90 sets of precipitation and divided into two groups (more or less than 800 mm). The effect sizes were -0.83±0.08 (n = 47) and -0.71±0.07 (n = 43) indicating 56.4% and 50.9% reduction when precipitation was over and lower than 800 mm.
The effect of DCD application on N2O emissions was not clear during the freeze-thaw event due to significant variation in soil moisture and temperature [34]. To reduce N2O emissions of both gases, livestock slurry should not be applied on wet soils [35]. Average air temperature ranged from -1.7 to 25.0 oC in this study, we divided these data into two groups (more or less than 13.4ºC). Both effect sizes were -0.77±0.07 (n = 51) and -0.81±0.10 (n = 43) indicating 53.7% and 55.5% reduction (n = 31). Warming helped to increase the effect of DCD application on inhibiting N2O emission. Soil bulk density affected grasslands aeration status and redox stat, which was driven factor in controlling N2O emissions rates [20]. In this study, soil bulks were divided into two groups based on 1.0 g cm-3. Effect sizes were -0.71±0.11 (n = 51) and -0.83±0.10 (n = 43), respectively, indicating 50.8% and 56.4% reduction (n = 31) when bulk was lower or higher than 1.0 g cm-3. In addition, DCD application was proved to be the robust mitigation of grazing grasslands N2O emission rates, and the reduction effects were better, when precipitation was over 800 mm, or air temperature and soil bulk were over 13.4ºC and 1.0 g cm-3.
Conclusion
In summary, this essay demonstrates that DCD application had a significantly reduction effect on N2O emission rates in the global grasslands. Effect sizes were showed significantly spatial heterogeneity. There was significant difference between different dose of nitrogen fertilization (P<0.05, Table 2). Effect sizes of light, moderate and high dose DCD were different and moderate DCD application has the best mitigation effect. Precipitation, bulk density and air temperature significantly influenced effect size based on test of moderators. Furthermore, soil bulk density and air temperature were positive with effect size, but the precipitation was negative with effect size of DCD. DCD application was the robust reduction strategy of grazed grasslands N2O emission.

