

Introduction
N and P nutrients in farmland enter downstream rivers and lakes through surface runoff, soil flow, farmland drainage, and underground leakage, forming agricultural non-point source pollution. Among them, agricultural non-point source pollution caused by farmland drainage is dominant [1, 2]. In the United States, 60% of water pollution is caused by non-point source pollution, with agricultural non-point source pollution accounting for about 75% [3]. In China, agricultural non-point source pollution sources account for 50% of the total emissions, indicating that controlling agricultural non-point source pollution is the key to achieving effective environmental protection [4, 5].
Irrigation areas are an important foundation for the development of modern agriculture and also a fundamental support for ecological environment protection [6]. Compared to rivers, although the size of drainage ditches and ponds is relatively small, they are widely distributed due to irrigation and drainage needs. In agricultural watersheds, the length of ditches accounts for up to 85% of the total length of streams [7, 8]. As a transitional zone between farmland and downstream water bodies, the drainage ditches and pond systems have dual functions of drainage and ecological wetlands that can reduce the content of N compounds entering downstream through a series of actions, such as soil and plant adsorption and biodegradation, effectively controlling agricultural non-point source pollution. The main types of farmland drainage ditches are soil or concrete ditches. The main problem with soil ditches is that it is prone to soil erosion and overgrowth of weeds, both of which pollute the receiving water body [9, 10]. The main problem with concrete ditches is the rapid flow of water, the lack of plants and microorganisms, and the inability to absorb and degrade N and P in drainage [11, 12].
Therefore, in recent years, ecological ditches have been widely used in agricultural drainage, intercepting runoff and sediment through ditches, ponds, and their supporting buildings, retaining and absorbing N and P by plants to achieve the interception function of ecological barriers [13–15]. Xiong designed and constructed a rice ecological ditch wetland system, which reduced TN and TP losses by 87.8% and 70.4% compared to traditional drainage systems [16]. Wang found that the interception effect mainly depended on the influent concentration and hydraulic retention time, and the ecological channels had a nitrogen removal rate of 20%, which was significantly higher than that of concrete or soil ditches [17]. With the research on the scale effect of farmland irrigation and drainage, domestic and foreign scholars have constructed a new type of farmland water conservancy system, called farmland-drainage ditch-pond (wetland) system, which can significantly reduce N and P emissions by controlled drainage through fields and drainage ditches, as well as by absorbing and purifying of ponds (wetlands). Shan constructed an ecological digestion system by ecological drainage ditches and ponds (wetlands), with TN and TP removal rates of 33% to 67% and 23% to 82%, respectively [18].
Existing researches on the removal of agricultural non-point source pollution were mainly focused on single-scale ditches, while there are few studies that consider the overall layout of drainage systems, including different level ditches and ponds (wetlands), from the perspective of irrigation area scale [19, 20].
In this study, three kinds of drainage systems were set up in typical irrigation areas: (1) to analyze the spatiotemporal changes of N and P pollutants, (2) to clarify the influence mechanism of different drainage systems on the digestion ability of N and P pollutants, and (3) to analyze the impact of different hydraulic conditions on the removal of N and P pollutants in ditches and ponds systems.
The innovation of this study is to study the reduction capacity and impact mechanism of drainage systems on agricultural non-point source pollution, and the results will provide a scientific basis for optimizing irrigation and drainage management strategies, controlling farmland non-point source pollution, and improving water and fertilizer resource utilization efficiency from the perspective of improving soil and water environment quality.
Materials and Methods
Experimental Site
The study was carried out at a typical irrigation area of the Hangjiahu Plain River Network in Zhejiang Province (30°35′N, 120°57′E) from May to October in 2020 and 2021. The study area belongs to a monsoon climate zone. The average annual temperature is 15.7℃, the average annual sunshine hours are 2075 hours, the annual rainfall is 1252.4 mm, the average frost-free period is 224 days, and the soil is mainly composed of silty clay with a unit weight of 1.3–1.4 g/cm3. The irrigation area is 36.67 ha, with rice (conventional single-cropping rice Xiushui 12) as the planting crop. There is one irrigation pump station, a low-pressure irrigation pipeline of 5.11 km, a drainage soil ditch and U-shaped concrete ditch of 2.77 km, and an ecological drainage ditch of 0.52 km. A natural wetland system has been constructed by utilizing existing rivers and ponds near the main drainage outlet.
Experimental Design
This study was based on the scale of irrigation areas, taking farmland, drainage ditches, and ponds (wetlands) as a whole. Coupling water-saving irrigation and controlled drainage technology was adopted in farmland irrigation and drainage regulation, the core of which was to reduce the upper limit of irrigation and increase the upper limit of rainwater storage. The control standards for farmland irrigation and drainage are shown in Table 1. The N and P pollutants came from fertilization in rice fields, which was applied with base fertilizer, tillering fertilizer, and panicle fertilizer, and the fertilization time was before the tillering stage, during the tillering stage, and before the heading and flowering stage during the rice growth period, respectively. Fertilizer varieties and amounts are shown in Table 2.
Table 1.
Control standards for farmland irrigation and drainage (mm).
Table 2.
Fertilization methods and amount in the irrigation areas.
| Fertilizer variety | Amount |
|---|---|
| Base fertilizer: urea | 130 kg ha-1 urea |
| Tillering fertilizer: urea | 80kg ha-1 urea |
| Panicle fertilizer: urea | 50kg ha-1 urea |
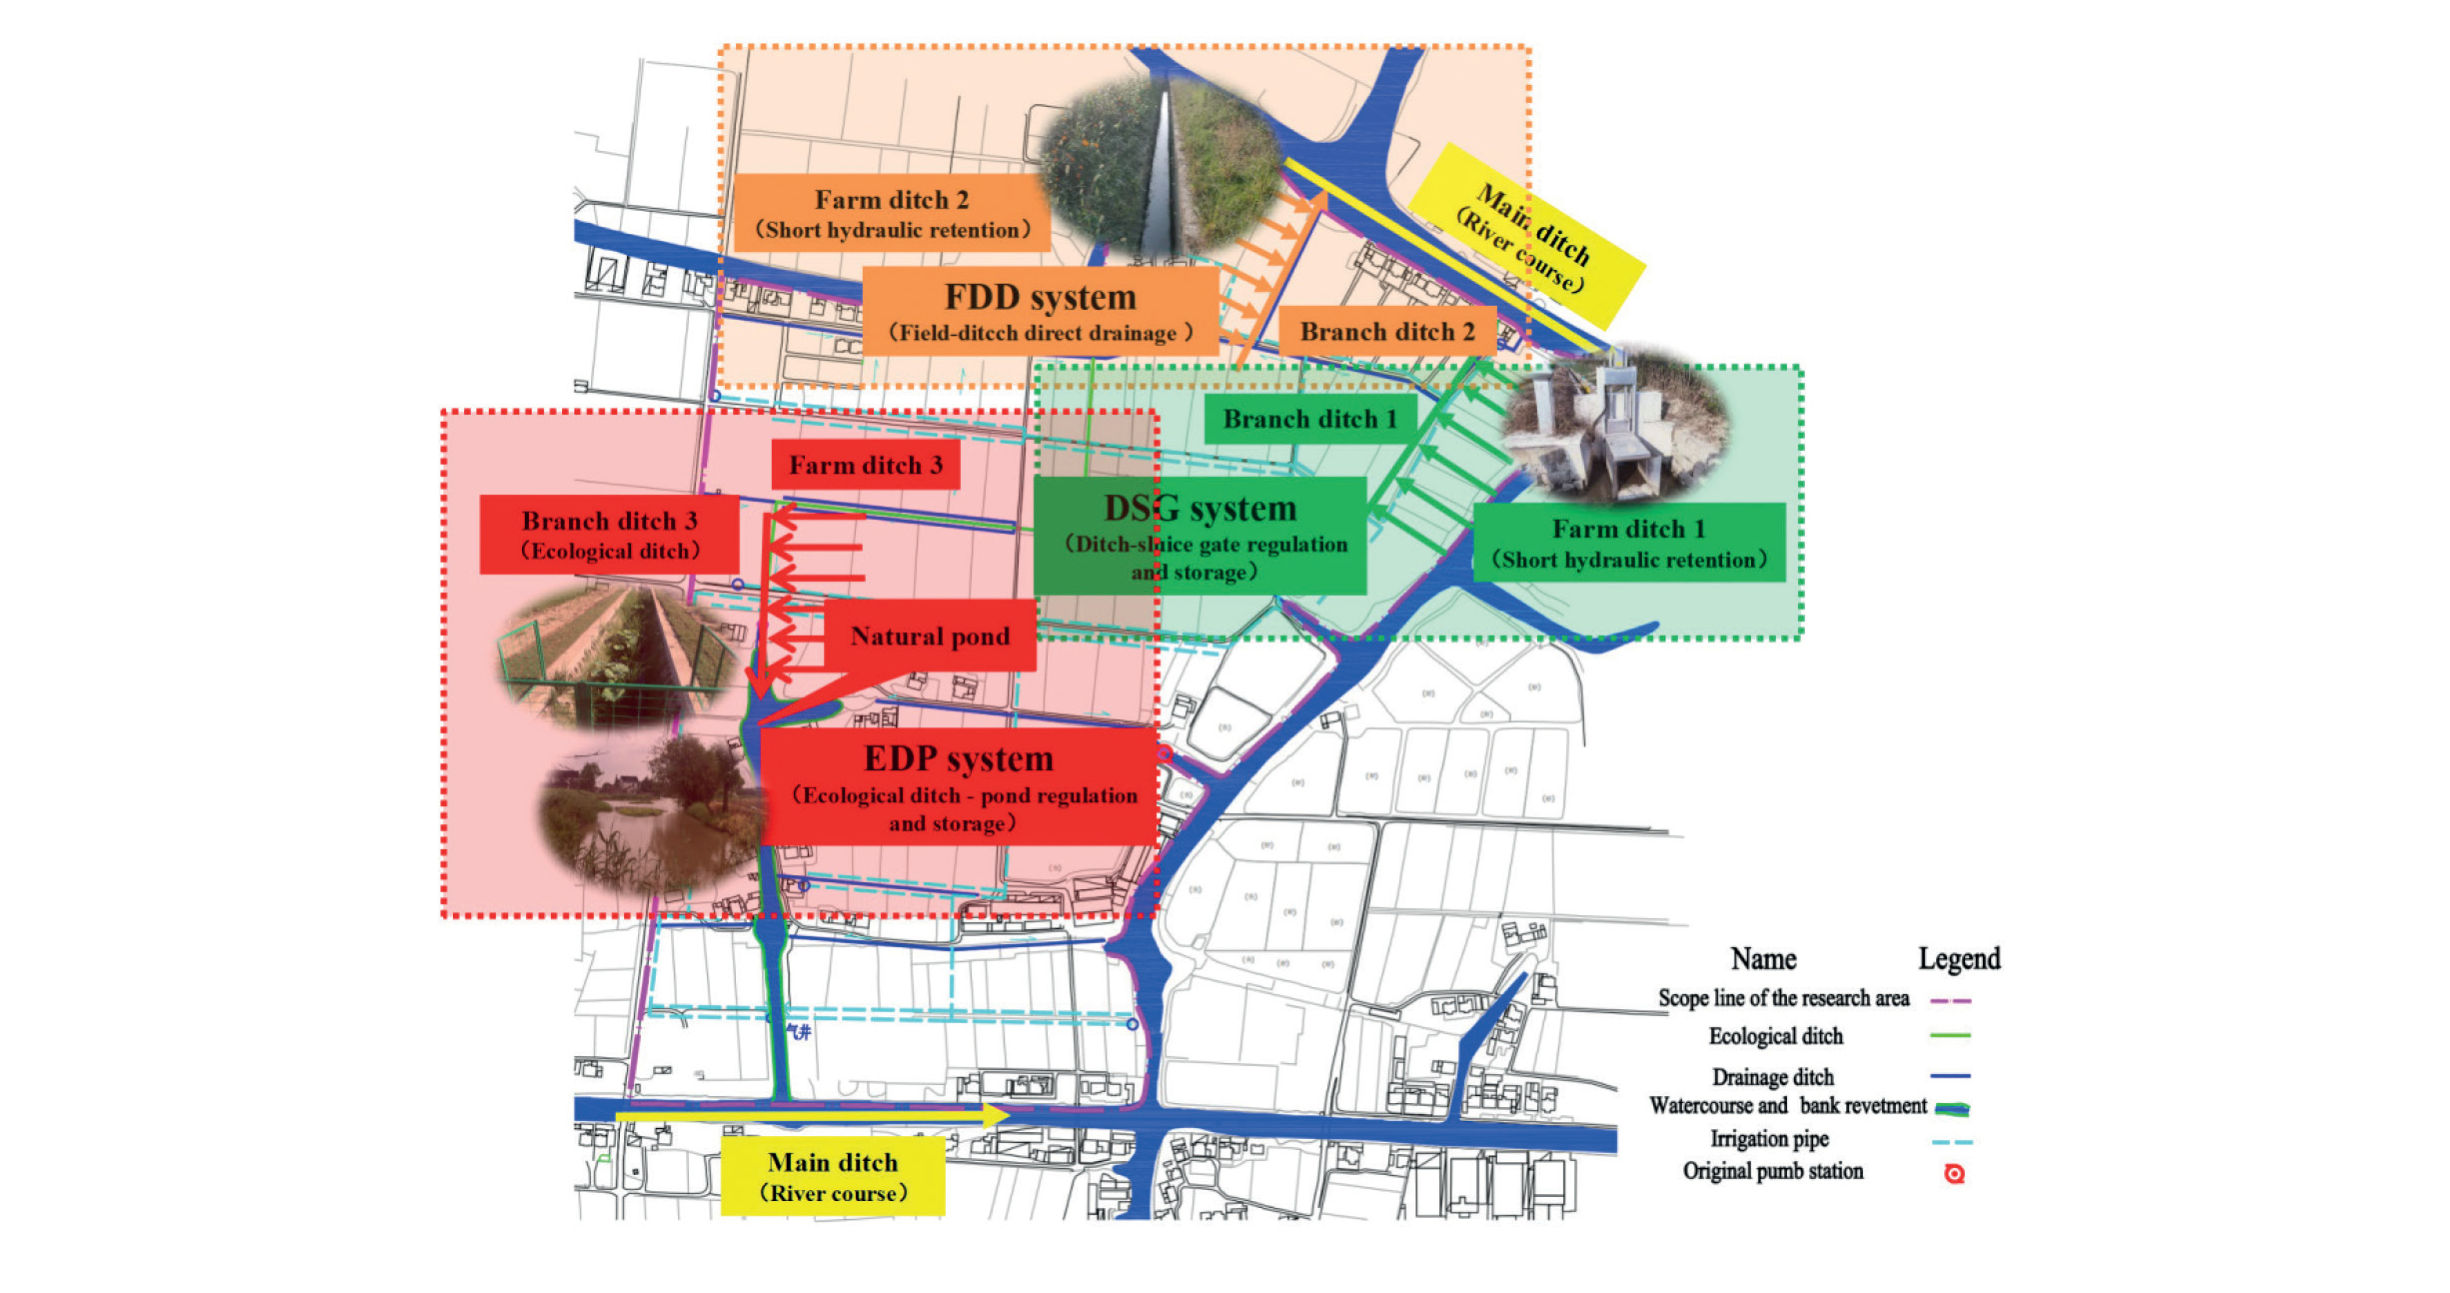
The drainage ditch was divided into three levels, they were farm ditches (soil ditches), branch ditches (U-shaped concrete ditches, ecological ditches), and main ditches (river channels). The farm ditches were distributed along the field with a spacing of 10 m, a width of 0.5 m, a depth of 0.8–1.0 m, and a daily drainage depth of 0.4 m. The width of the branch ditch was 1.0 m, the water depth was maintained at 1.0–1.5 m, and there was a regulating gate at the intersection with the river channel. The main ditches were regional river channels. In this study, three kinds of drainage systems were set up, namely ditch-sluice gate regulation and storage system (DSG system), field-ditch direct drainage system (FDD system), and ecological ditch-pond regulation and storage system (EDP system). On the basis of direct drainage in the irrigation area, the DSG system set up a gate at the outlet of the farm ditch to control the water level in the irrigation area; when the water level reached the upper limit in farm ditches, it would drain in 3–4 days later. FDD system adopted open channel drainage measures, which discharge excess surface water through a drainage system composed of excavated open channel channels, including a multi-level channel drainage system. The EDP system used both ecological ditches drainage and ditch-ponds (wetlands) for regulation and storage, which were arranged with aquatic plants. The upper limit of water storage was 20–50 cm below the lowest field elevation in the drainage range, the water storage reached the lowest field elevation in the drainage range after a rainstorm, and the suitable drainage period was 7–8 days. The layout of the drainage system in the study area is shown in Fig.1.
Indicators and Measurements
Water monitoring included irrigation water consumption monitoring and drainage monitoring. The irrigation water consumption monitoring was carried out in real-time by using flow meters and field water meters located at the head of the pump station and the inlet of typical fields. The drainage amount was monitored in real-time by a simple water measuring device located at the outlet of the end of the drainage ditch. Water quality sampling points were set up at the pump station inlet, fields, farm ditches (soil ditches), U-shaped concrete ditches, ecological ditches, and ponds (wetlands) to monitor the water quality changes. Water samples were taken every 7 days and on the 1st, 2nd, 3rd, 5th, and 7th days after heavy rainfall or fertilization. The monitoring indicators included Total nitrogen (TN), Total phosphorus (TP), NH4+-N, NO3--N. TN was measured using potassium persulfate oxidation and ultraviolet spectrophotometry. TP was measured in unfiltered samples using the indophenol blue method. NH4+-N was determined by the Nessler reagent spectrophotometry method, and NO3--N concentration was measured by the Ultraviolet spectrophotometry method. State of Environmental Protection Association (SEPA, 2002) was adopted for measurement methods of TN, TP, NO3--N, and NH4+-N.
Statistical Analysis
Removal Rate Calculation
The removal rate was calculated according to the following formula.
Where η represented the removal rate (%), qinflow/outflow represented the amount of material inflow and outflow (g/ha), Q represented the displacement (m3/ha), and C represented the concentration of pollutants (mg/L). A positive value indicated that the total inflow of substances was greater than the total outflow of substances, resulting in an increase in the total amount of pollutants. A negative value indicates that the total inflow of substances was less than the total outflow of substances, resulting in a decrease in the total amount of pollutants, and zero indicates no inflow (outflow).
Purification Effect Evaluation of Pollutants in the Drainage System
For situations where the hydraulic connection between ditches and ponds was not taken into account, simply counted all the water surfaces of ditches and ponds together and considered it as the ideal situation where the system can remove pollutants to the maximum extent possible when all ditches and ponds can function equally and efficiently. Considering all the ditches and ponds together, the concentration changes of pollutants in the ditches and pond water were described by the first-order reaction equation as follows.
Where c0 and cT represented the initial concentration and effluent concentration of drainage in the ditches and ponds (mg/L), r represented the overall degradation coefficient (d-1), and HRT represented the actual hydraulic retention time.
If the loss along the drainage period was ignored, the maximum possible reduction rate of pollutants (ηT) can be calculated according to the following formula.
When considering the detailed hydraulic connections between ditches and pond systems, it was possible to track the inflow and outflow processes of each ditch and pond unit’s drainage, as well as the changes in pollutant concentration. The hydraulic elements included water flow path, inflow, and ditch-pond distribution. The water flow network was generalized to include different branch systems of water flow paths. Agricultural drainage can enter the system from any point according to the actual situation. Assuming that each unit in the water flow network had the same flow and hydraulic characteristics, i represented the branch of the path, j represented the unit in the path, and the concentration change cij of pollutants within the calculation unit was calculated as follows.
Where c0(ij) represented the concentration of pollutants entering the calculation unit (mg/L).
Due to the possibility of water flow from upstream units in a unit, its initial concentration needed to be calculated from all upstream incoming water and farmland drainage.
Where qf represented the farmland drainage flow directly entering the calculation unit (m3/d), qk represented the upstream unit flow into the calculation unit (m3/d), ck represented the concentration of pollutants in the upstream unit of the calculation unit (mg/L), and N represented the number of upstream inflow ditches and ponds.
The formula for calculating the unit pollutant removal amount (mij) was as follows.
The formula for calculating the unit pollutant removal rate (mij) was as follows.
Where M0 represented the total amount of pollutants in the drainage inflow, which was the product of the drainage amount (Q) and the initial drainage concentration c0 (mg/d).
The formula for calculating the removal rate of pollutants in the entire system was as follows.
Assuming that hydraulic connections were not considered the ideal scenario, the actual implementation rate of the situation (ε) was calculated as follows.
Based on previous research, the removal efficiency of pollutants by a ditch-pond system with a degradation coefficient (r) within the range of 0.03~0.3 d-1 was discussed in this study.
Results
Temporal and Spatial Changes of N and P Pollutants in Different Drainage Systems
Ditch-Sluice Gate Regulation and Storage System
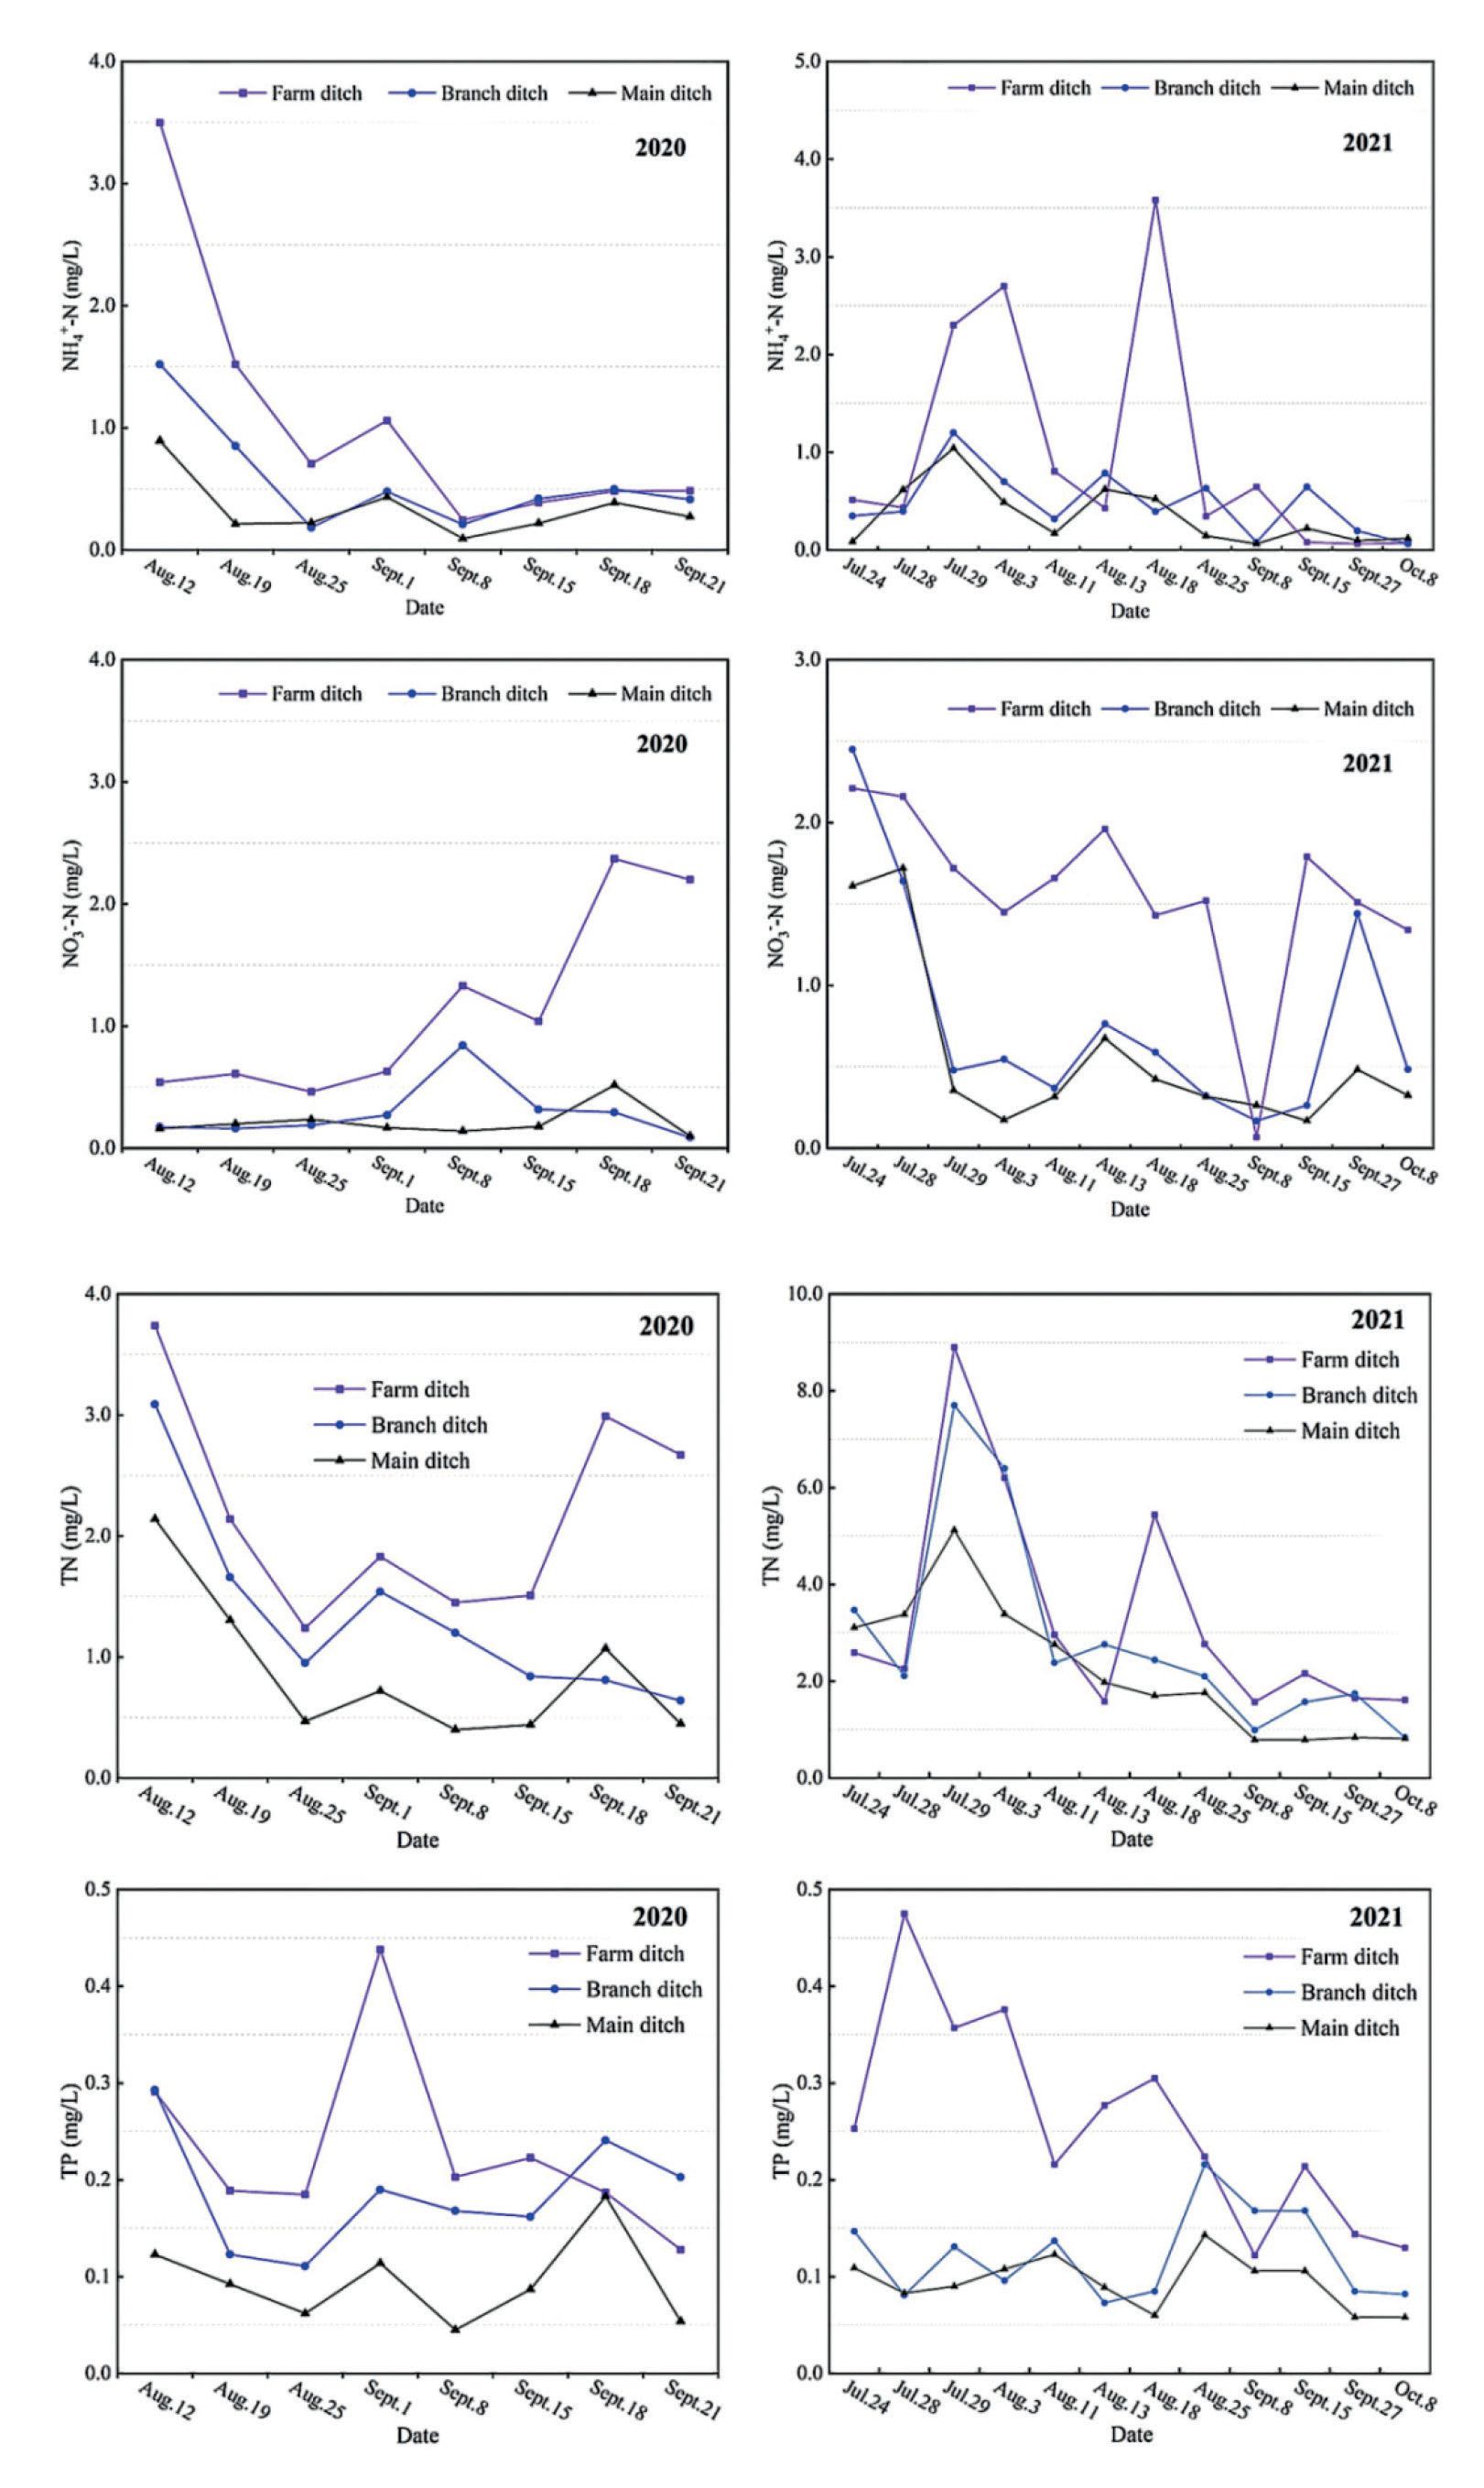
Changes in N and P pollutants concentrations in various levels of drainage ditches of DSG system are shown in Fig. 2. The concentration ranges of TN, NH4+-N, NO3--N and TP were 0.40–8.9 mg/L, 0.062–3.58 mg/L, 0.068–2.45 mg/L and 0.073–0.475 mg/L, and N and P pollutants concentrations were gradually decreased along farm ditches, branch ditches, and main ditches, that indicated that ditches had a gradual interception and absorption effect on N and P pollutants concentrations. The average concentrations of NH4+-N in all levels of ditches were decreased in 2021 compared to 2020. The NO3--N concentration in various levels of ditches had a relatively small change in 2020 but a larger change in 2021, and the fluctuation of NO3--N concentration was larger compared to NH4+-N concentration, resulting from that NO3- N was prone to entering drainage ditches and continuously migrating under leaching. The average concentration of NO3--N in farm ditches was much higher than that in branch ditches and main ditches. For the change of TN, in 2020, the TN concentration in ditches at all levels was higher on August 12th, showing a downward trend as a whole. It suddenly increased in main ditches and farm ditches on September 15th, mainly due to the rainstorm, which increased the suspended solids in paddy fields and ditches, resulting in the sudden increase of TN in drainage ditches. In 2021, the TN concentration in various levels of ditches fluctuated greatly and showed an overall downward trend, and the peak value in all levels of ditches appeared at the end of July when the paddy rice was in the seedling growth stage. Compared to 2020, the decrease in TN concentration in the main ditches was greater, while the fluctuation of TN concentration in farm ditches was greater. The TP concentration in various levels of ditches showed a downward trend. The peak value appeared on September 1st, 2020, and on July 28th, 2021, occurring in agricultural ditches. The concentration of N and P pollutants in the farm ditches was much higher than that in branch and main ditches, resulting from the DSG system being equipped with a regulating gate at the end of the farm ditch, under the combined action of fertilizer migration and rainfall, the water flow rate was relatively slow, and the agricultural drainage stayed in farm ditches for a longer time, which was conducive to the physical settlement of pollutants and the full absorption and digestion of aquatic plants.
Field-Ditch Direct Drainage System
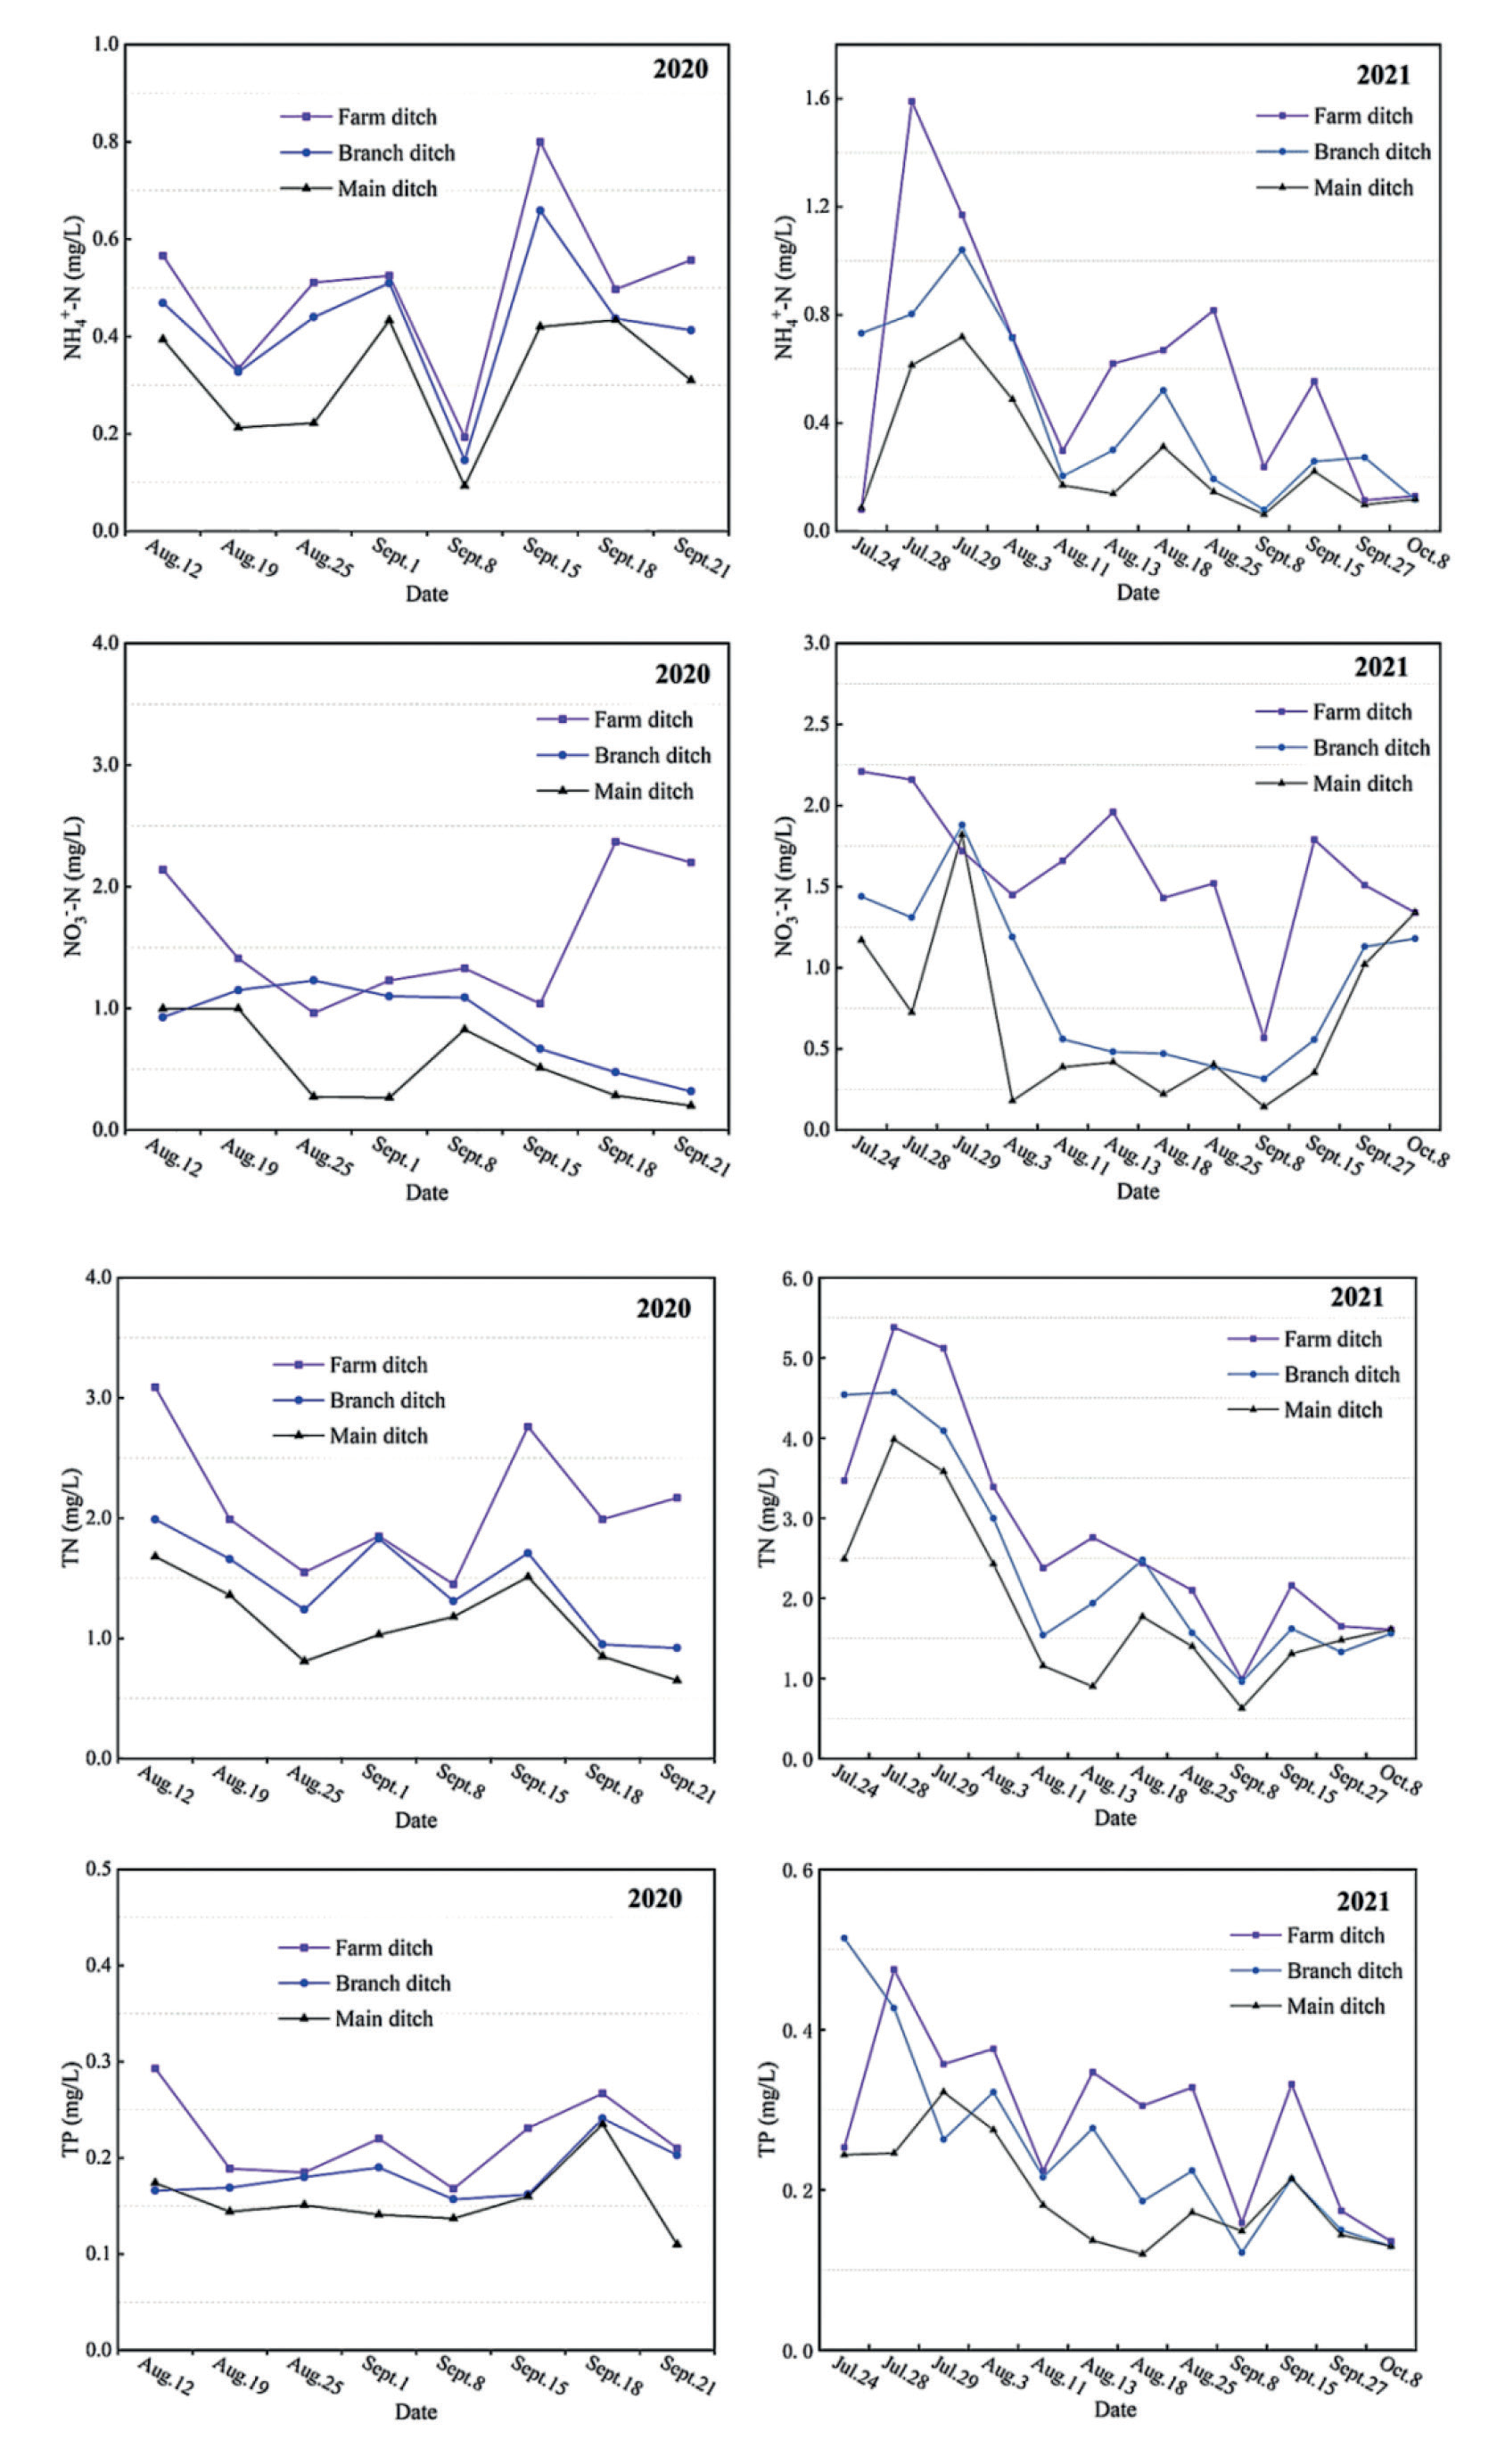
Changes in N and P pollutants concentrations in various levels of drainage ditches of FDD system are shown in Fig. 3. The concentration ranges of TN, NH4+-N, NO3--N and TP were 0.63–5.54 mg/L, 0.06–1.59 mg/L, 0.068–2.37 mg/L and 0.11–0.514 mg/L, and N and P pollutants concentrations were gradually decreased along farm ditches, branch ditches, and main ditches. The NH4+-N changes showed an overall downward trend in 2020 and 2021. The changes in NH4+-N concentration in various levels of ditches were similar in 2020, but in farm ditches, they were relatively large in 2021.
The NH4+-N concentration in each ditch generally increased in July and August due to fertilization and topdressing but showed a trend of first increasing and then decreasing in September, mainly due to the vigorous growth of crops, large nitrogen absorption and reduced pollutant load output from farmland. For the NO3--N changes, it showed an overall downward trend in 2020 and 2021, but it changed significantly in 2021.
The NO3--N concentration was relatively high from June to August in 2020 and 2021, which may be due to the favorable conditions for nitrification reaction under aerobic conditions, resulting in an increase in NO3--N concentration. For the TN changes, the decrease in TN concentration in 2021 was higher than that in 2020, and it fluctuated greatly in 2021. Different from the DSG system, the average concentrations of TN in branch ditches and farm ditches were similar in the FDD system. For the TP changes, it was the smallest pollutant compared to N pollutants, with little change in 2020 and a fluctuating downward trend in 2021. After heavy rainfall occurred in September 2020 and 2021, the TP concentration significantly increased because rainfall was the carrier of soil solutes and the driving force for phosphorus migration in paddy soil.
Ecological Ditch-Pond Regulation and Storage System
Changes in N and P pollutants concentrations in various levels of drainage ditches of EDP system are shown in Fig. 4. The concentration ranges of TN, NH4+-N, NO3--N and TP were 0.53–13.1 mg/L, 0.051–2.76 mg/L, 0.14–3.87 mg/L and 0.091–0.948 mg/L, and N and P pollutants concentrations were gradually decreased along farm ditches, branch ditches, and main ditches.
The trend of NH4+-N and TN changes had similar changes in 2020 and significant changes in 2021 at all levels of ditches. On September 1st, 2020, and August 3rd, 2021, the concentrations of TN and NH4+-N were relatively high. The main reason may be that a large amount of plant residues were decomposed under high temperatures, leading to secondary pollution in the water body. In 2021, the peak values of NH4+-N and TN concentrations were increased compared to those in 2020, and they all appeared in farm ditches. It can be seen that the concentrations of NH4+-N and TN were relatively high in the farm ditches, but they were significantly reduced in the main ditches, which is mainly due to the EDP system having played a role in interception and purification. For the NO3--N changes, in 2020, the NO3--N concentration in all levels of ditches was increased, while in 2021, the fluctuation was significant, but overall, it showed a downward trend. The NO3--N concentration was higher than the NH4+-N concentration due to the nitrification reaction under aerobic conditions in paddy water environment. For the TP changes, compared to nitrogen-containing pollutants, the amplitude of changes was smaller, and its annual variation in various levels of ditches was similar.
Absorption and Removal Capacity of N and P Pollutants in Different Drainage Systems
Changes in the Concentration of N and P Pollutants
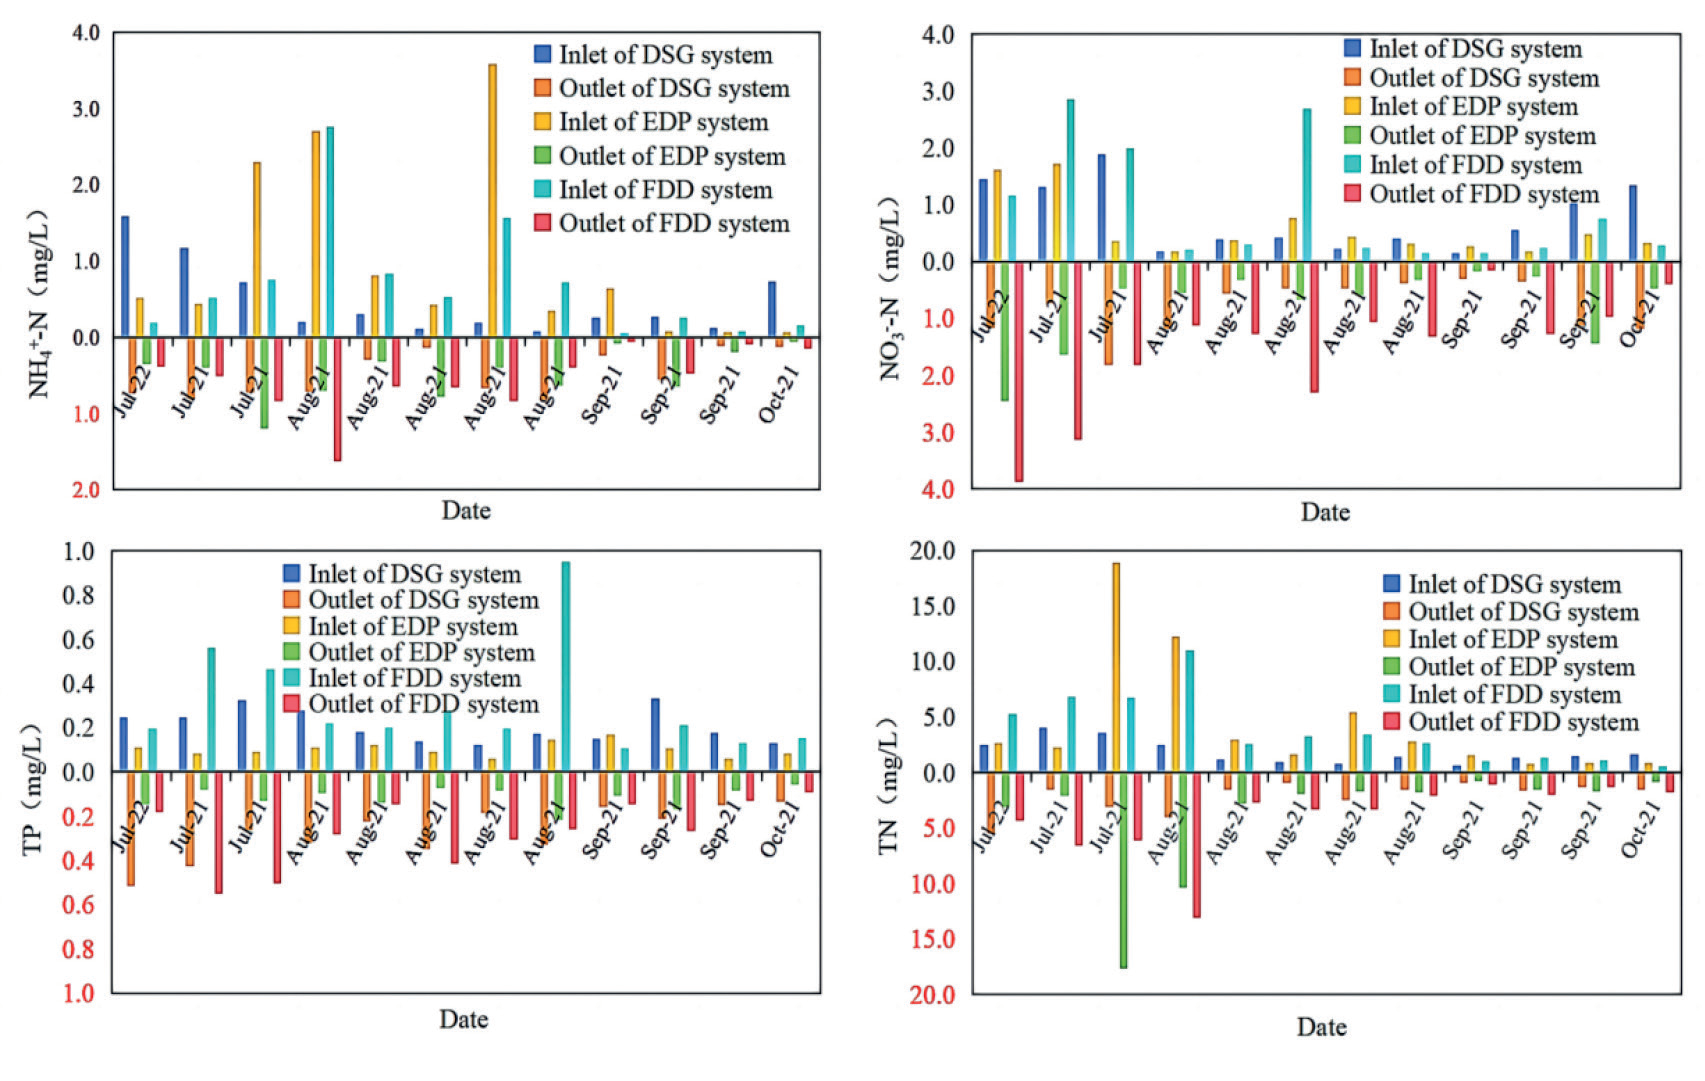
In this study, water quality in the primary ditch of each system was used as the inlet pollutant concentration, water quality in the main ditch was used as the outlet pollutant concentration, and the changes in N and P pollutants concentrations at the inlet and outlet in different drainage systems are shown in Fig. 5. For the NH4+-N, changes in the outlet of the DSG system, FDD system, and EDP system were decreased by -3.2%, 20.7%, and 51.9% compared to that in the inlet, respectively. For the NO3—N, changes in the outlet of the DSG system, FDD system, and EDP system were increased by 5.2%, 71.1%, and 34.3% compared to that in the inlet, respectively. For the TN, changes in the outlet of the DSG system, FDD system, and EDP system were decreased by -20.5%, -5.4%, and 11.9% compared to that in the inlet, respectively. For the TP, changes in the outlet of the DSG system, FDD system, and EDP system were decreased by -31.7%, 10.3%, and -13.5% compared to that in the inlet, respectively. On the whole, the content of various pollutants in the inlet of each system was higher from July to August and was lower from September to October due to the rice fertilization period in July and August. Each system had a certain removal effect on pollutants, among which EDP system had the best removal effect on N and P pollutants, followed by DSG system, and FDD system had the weakest removal effect. Agricultural drainage experienced physical settlement in the DSG system due to the prolonged residence of the gate installed in the farm ditch, resulting in a lower concentration of pollutants at the outlet compared to that in the FDD system without gates in the farm ditch. In the EDP system, under the combined action of irrigation water and rainfall runoff, the N and P pollutants generated by fertilization were prone to suffer from physical sedimentation due to the water flow rate slowing down, and the agricultural drainage stayed in the ecological drainage ditch for a longer time. This led to a significantly higher concentration of N and P pollutants in the inlet of the EDP system than that of the DSG system and FDD system. Additionally, in the EDP system, farmland drainage passed through ecological ditches and wetlands, where abundant aquatic plants allowed N and P pollutants to be fully absorbed and utilized. Therefore, the EDP system had a stronger ability to digest N and P pollutants, and its pollutant concentration in the outlet was lower than that of the other two systems.
Removal Effect of N and P Pollutants
The inflow, outflow, and removal rate of pollutants under different drainage systems are shown in Table 3. It showed that the DSG system had the highest removal rate of TP, which was 59.5% and 8.0% higher than the FDD system and EDP system. The removal rate of TN in the EDP system was the highest, with an increase of 35% compared to the DSG system and FDD system. The EDP system had the highest removal rate of NO3--N, which was significantly improved compared to the other systems, while the DSG system had the lowest removal rate. The removal rate of NH4+-N in the EDP system was the highest, followed by the DSG system. Overall, each drainage system had a certain retention and purification effect on N and P, and its purification capacity from priority to inferiority was in the order of the EDP system, DSG system, and FDD system. The better removal efficiency of the DSG system was mainly due to the equipped control gate in the farm ditch, which was longer than that of the FDD system. The farmland drainage was retained in the farm ditch for a longer time, and the flow rate was reduced, which was conducive to the physical settlement and filtration of pollutants. In the EDP system, the application of fertilizer in the field resulted in a higher content of nutrients such as N and P that had not been fully utilized, leading to a higher concentration of N and P pollutants flowing into the system. However, the farmland drainage passed through the ditches and ponds, and there was a longer drainage ditches system that provided plants and microorganisms with sufficient interception and digestion of the water body, resulting in better purification of the water body. Additionally, due to the vigorous growth of aquatic plants, developed root systems, and high temperatures within the EDP system, microbial metabolic activities were strengthened, which was conducive to the full absorption and utilization of aquatic plants and microorganisms and the reduction and purification effect of N and P pollutants was significant, resulting in a higher pollutant removal rate and better retention and purification effect. Meanwhile, compared to N, the P removal rate was higher, which may be influenced by aquatic plants and substrate conditions.
Fig. 4.
Changes in N and P pollutants concentrations in various levels of drainage ditches of EDP system.
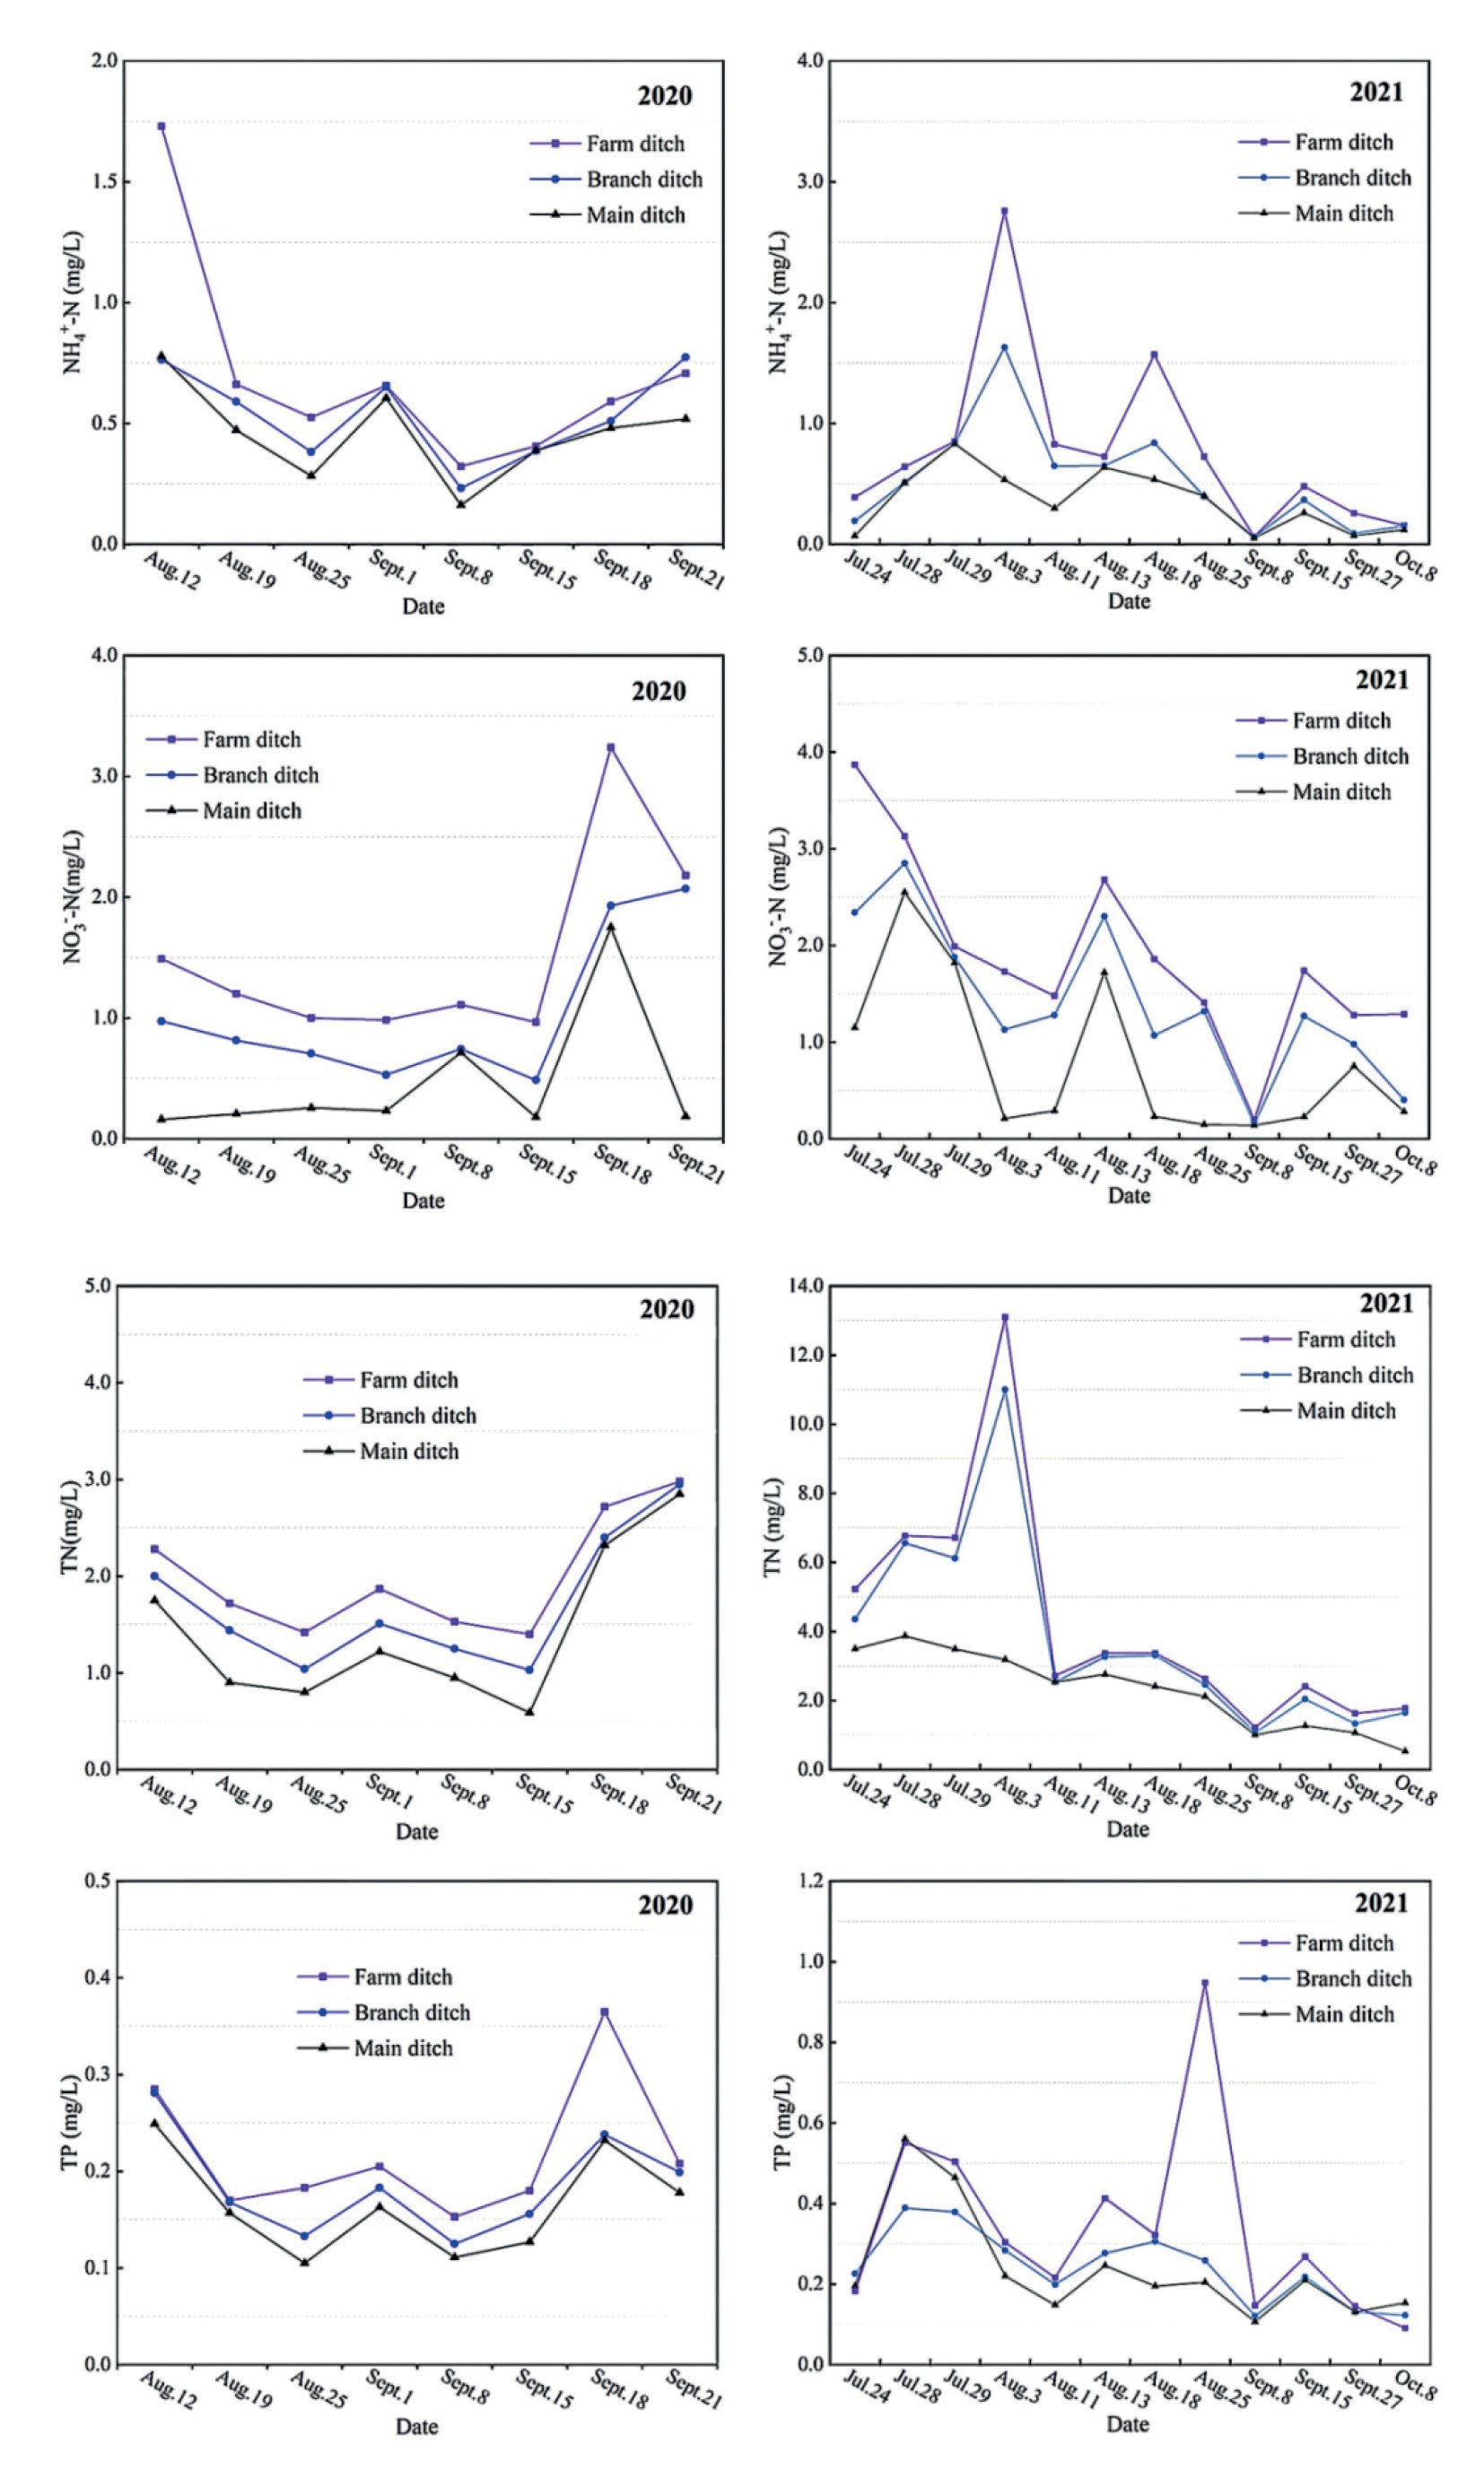
Table 3.
Inflow, outflow, and removal rate of pollutants under different drainage systems.
Effect of Hydraulic Conditions on the Removal of N and P Pollutants in Ditch-Pond Systems
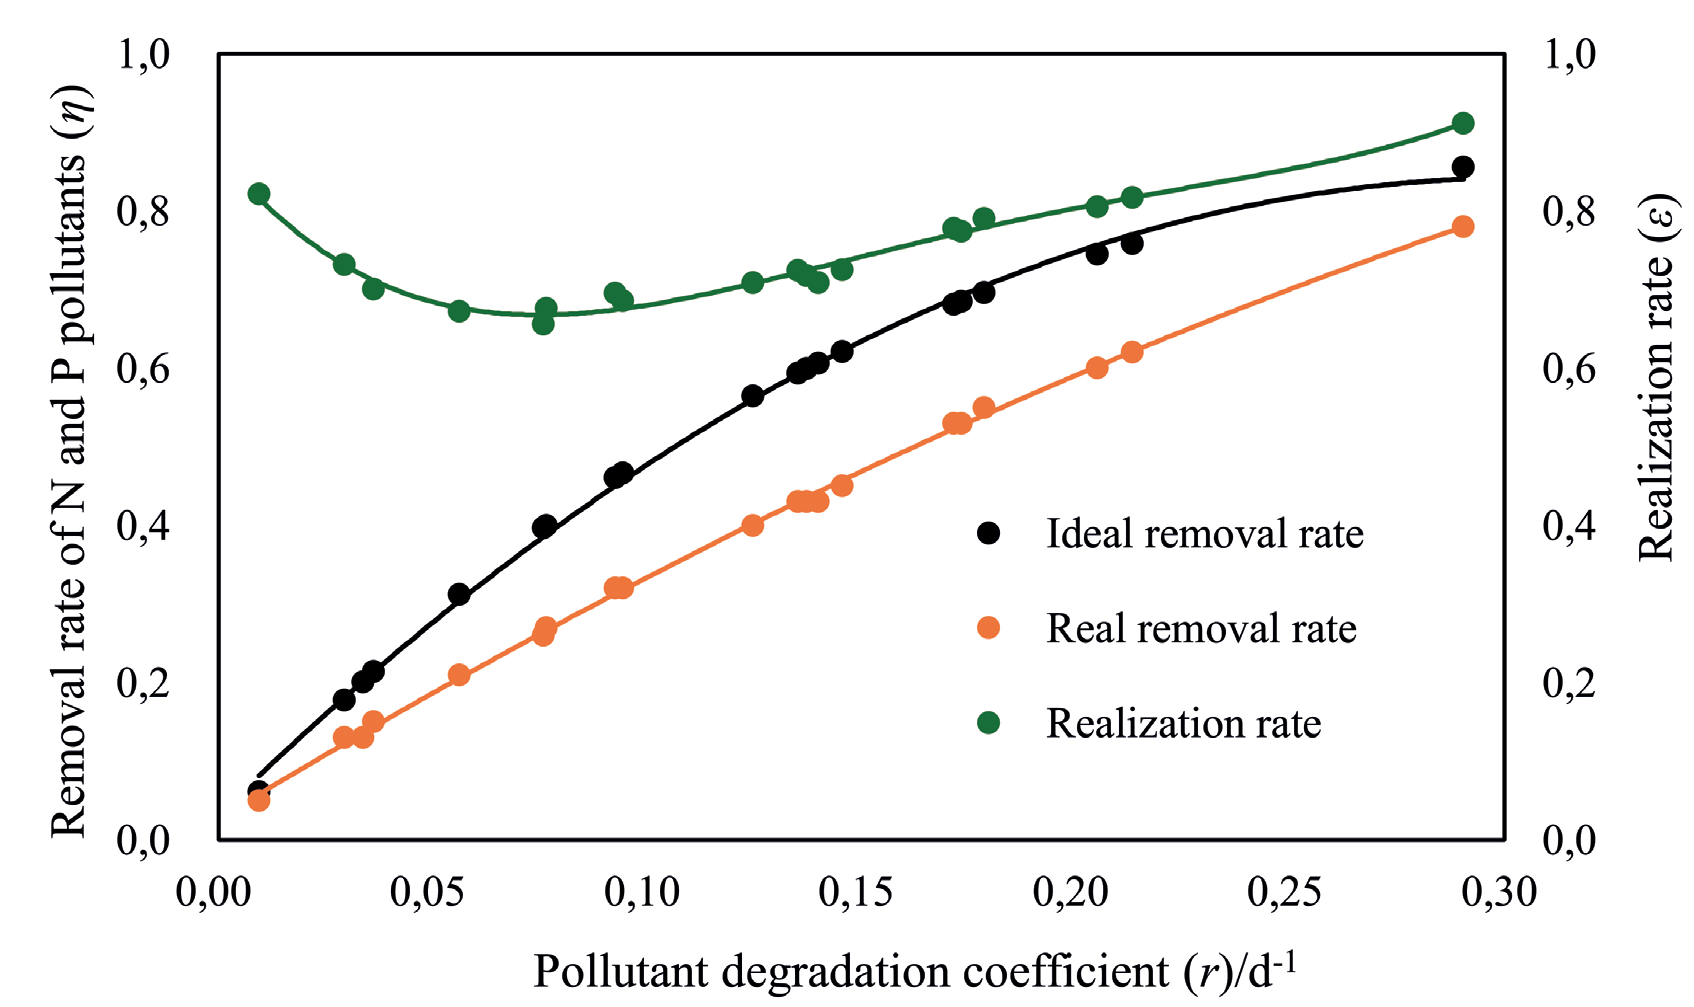
Variations of pollutant removal rates with degradation coefficient in ditches and ponds under different hydraulic conditions are shown in Fig. 6. The ideal removal rate and actual removal rate both increased with the increase of pollutant degradation coefficient, and the pollutant removal rate of the ditch-pond system under actual agricultural hydraulic conditions was only equivalent to the overall consideration of 65.6~91.1%. The implementation rate showed a flat U-shaped trend with the increase of pollutant degradation coefficient when the degradation coefficient was very small (0.01 d-1), ε was about 0.75 when the degradation coefficient increased to 0.07 d-1, ε decreased to the minimum value of 0.66, and then slowly increased with the increase of degradation coefficient, when the degradation coefficient increased to 0.30 d-1, ε slowly increased to 0.8. In addition, when the degradation coefficient was small, improving the hydraulic connection of the ditch-pond system had little effect on pollutant removal. However, as the degradation coefficient increased, the impact of hydraulic connection on pollutant removal efficiency gradually increased. Therefore, improving the purification effect of drainage water quality can be approached from the perspective of increasing the degradation coefficient of pollutants. Correspondingly, under the calculation conditions, the actual removal rate of pollutants was also greatly affected. When the degradation coefficient was very small (0.01 d-1), the pollutant removal rate obtained by considering hydraulic connections was 5%, while the ideal situation was 6% when the degradation coefficient increased to 0.1 d-1, the pollutant removal rate obtained by considering hydraulic connections was 32%, and the ideal maximum value was 46%, and when the degradation coefficient increased to 0.3 d-1, the actual removal rate of pollution was only 78%, while the ideal removal rate was 86%. Within the range of degradation coefficients proposed in existing research, if calculated according to ideal conditions, pollutants would be significantly reduced, while after considering specific hydraulic connections, the pollutant removal rate would decrease. Therefore, the pollutant removal rate of ditches and ponds in their natural state was significantly lower than that after optimization, indicating that improving hydraulic connections were crucial for enhancing the pollutant degradation capacity of ditches and ponds.
Discussion
Factors Affecting the Removal of N and P Pollutants in Different Drainage Systems
In the agricultural drainage ditch system, N and P nutrients are mainly intercepted and purified through sediment adsorption, absorption by aquatic plants, and microbial metabolism, reducing the amount of pollutants entering rivers and lakes [21]. This paper studied the spatiotemporal changes of N and P pollutants in different drainage systems, including main ditches, branch ditches, and farm ditches. It was found that the pollutant concentration in various levels of ditches would fluctuate significantly under different periods and meteorological conditions. On the whole, the concentration of N and P pollutants showed a consistent change, with higher concentrations in July, greater fluctuations in August, and the lowest in September and October The result was consistent with the research of Gao [22]. However, Fang found that the concentrations of NH4+-N, TN, and TP in fall and winter were significantly higher than those in other periods, which might be related to differences in meteorological conditions in the study area [23].
There are significant differences in the variation of non-point source pollutants at different levels of drainage systems, as agricultural drainage ditches at different scales had different structural dimensions, internal environmental characteristics, and differences in the concentration of incoming pollutants [24]. For the DGS system, the peak concentration of various pollutants occurred in the farm ditches, while the concentrations of pollutants in branch ditches and main ditches were relatively low. It was because there was a regulating gate at the end of the farm ditch. Under the combined effect of fertilizer migration and rainfall, the water flow rate was slow, and the discharge water from farmland stayed in the ditch for a longer time, which was conducive to the physical settlement of pollutants and the full absorption and digestion of aquatic plants. For the FDD system, the average content of TP gradually increased, that was because the phosphorus fertilizer was easy to fix after entering the soil, and it was generally fixed in the topsoil layer, so it was difficult to enter the deep soil during the irrigation season, the soil turbulence was small, and the TP concentration was changed little, but after the rainstorm, the soil was hit, so the TP in the topsoil entered into the water and moved to drainage ditches, and at the same time, the water flow in the ditches was increased, and the continuous erosion of the rain made the phosphorus element difficult to transform. For the EDP system, NH4+-N and TN concentrations were higher in farm ditches but significantly lower in the main ditches; that was because the EDP system played an important role in interception and purification under the absorption of plants, microorganisms, and other effects, and it had strong resistance to impact loads.
This study mainly considered the effects of rainfall and fertilization on the spatiotemporal changes of surface source pollutants at various levels of the system. However, Wang found that factors such as hydraulic retention time, plant species, biomass, temperature, hydraulic load, and wet-dry alternation were also influencing factors in reducing non-point source pollutants in farmland [25]. Currently, there is relatively little research on the impact analysis of relevant factors on the reduction effect of N and P pollutants in farmland. Attention still needs to be paid to the mechanism of hydrological and environmental factors on the removal effect of N and P pollutants in drainage ditches in order to obtain more theoretical support.
Impact of Drainage Systems on the Digestion ability of N and P Pollutants
This study found that during the monitoring period, the removal rates of N and P pollutants by the drainage systems were all positive. Among them, the EDP system had the best effect, while the FDD system had a relatively poor impact. It was because agricultural non-point source pollution mainly came from the use of fertilizers and pesticides, and N and P pollutants that were not absorbed and utilized by crops would be directly discharged into the river channel, which would have a significant impact on the surrounding water quality [26]. The EDP system had the highest removal rate of NO3--N, followed by TN. Ecological ditches, as a special wetland system, had numerous aquatic plants such as Acorus calamus, reed, and water celery growing in the drainage ditches. The plants grew rapidly and absorbed a large amount of N and P pollutants to achieve the effect of dissolving and removing pollutants. At the same time, plant roots, sediment, and humus formed by the decay of aquatic plant epidermal cells had a strong adsorption effect on pollutants, especially organic matter, to achieve the effect of intercepting and purifying pollutants. The removal efficiency of TN and TP in the EDP system had been significantly improved through wetland ditches and ponds. Therefore, the combination of ecological ditches and wetland ponds had a significant effect on N and P removal [27]. Wang found that plankton in ecological ditch storage systems also had assimilation and absorption effects on N and P elements [28]. In addition, for agricultural drainage, multiple ecological defense lines, such as rice paddies, drainage ditches, and wetlands, can be used to absorb and reduce N and P nutrients in order to reduce the discharge of non-point source pollution. At the same time, the types of aquatic plants in the ecological ditch should be enriched, and aquatic plants should be chosen that are less prone to decay in winter to reduce the probability of secondary pollution caused by aquatic plants to the water body. In terms of the structural form of ecological ditches, it was possible to combine local conditions and adopt structural types that were suitable for the surrounding environment in order to maximize the reduction of non-point source pollutants.
Efficient Technology for Removing N and P Pollutants at the Scale of a Ditch-Pond (Wetland) System
Surface drainage is an important way for N and P from rice fields to enter the receiving water body. The water discharged from farmland through drainage ditches, ponds, and wetlands could further regulate and store some water and effectively reduce N and P nutrients. Therefore, the collaborative regulation field-ditch-pond is adopted to connect the rice field, drainage ditch, and pond as a whole [29]. Rainfall is initially intercepted by the farmland, and the drainage ditch and pond (wetland) system intercept the farmland drainage twice or multiple times, fully exerting the wetland effect of field ditch-pond to reduce N and P concentration, forming a regulation model of the paddy field-ditch-pond (wetland) system (Fig. 7). This regulation mode can be divided into three stages, among which stage one is field controlled drainage, that is, during the growth period of rice with strong resistance to waterlogging stress, the maximum water storage depth after rain can be controlled to 150–200 mm, rice fields do not actively drain water, when the waterlogging occurred in the rice field exceeds 5 days, it should be drained, and during fertilization and pest control, the waterlogging can be extended to 7 days before being discharged [30]. The second stage is farm ditch storage and drainage, where the upper limit of farm ditch water storage is the elevation of the gate top, which is the elevation of the field surface. After the water storage in the farm ditch reaches the upper limit, it will be emptied 3–4 days later, and when there is moderate to heavy rain or fertilization, the farm ditch will be emptied in advance [31, 32]. The last stage is pond (wetland) storage and drainage. The upper limit of pond (wetland) storage is 20–50 cm below the lowest field surface elevation in the range of bearing and discharging. When a rainstorm occurs, it would be stored to the lowest field surface elevation in the range of bearing and discharging, and when the upper limit is reached, it will be necessary to accommodate the drainage of water from upstream again, the suitable drainage period is 7–8 days, and it will be discharged to the same level as the downstream [33].
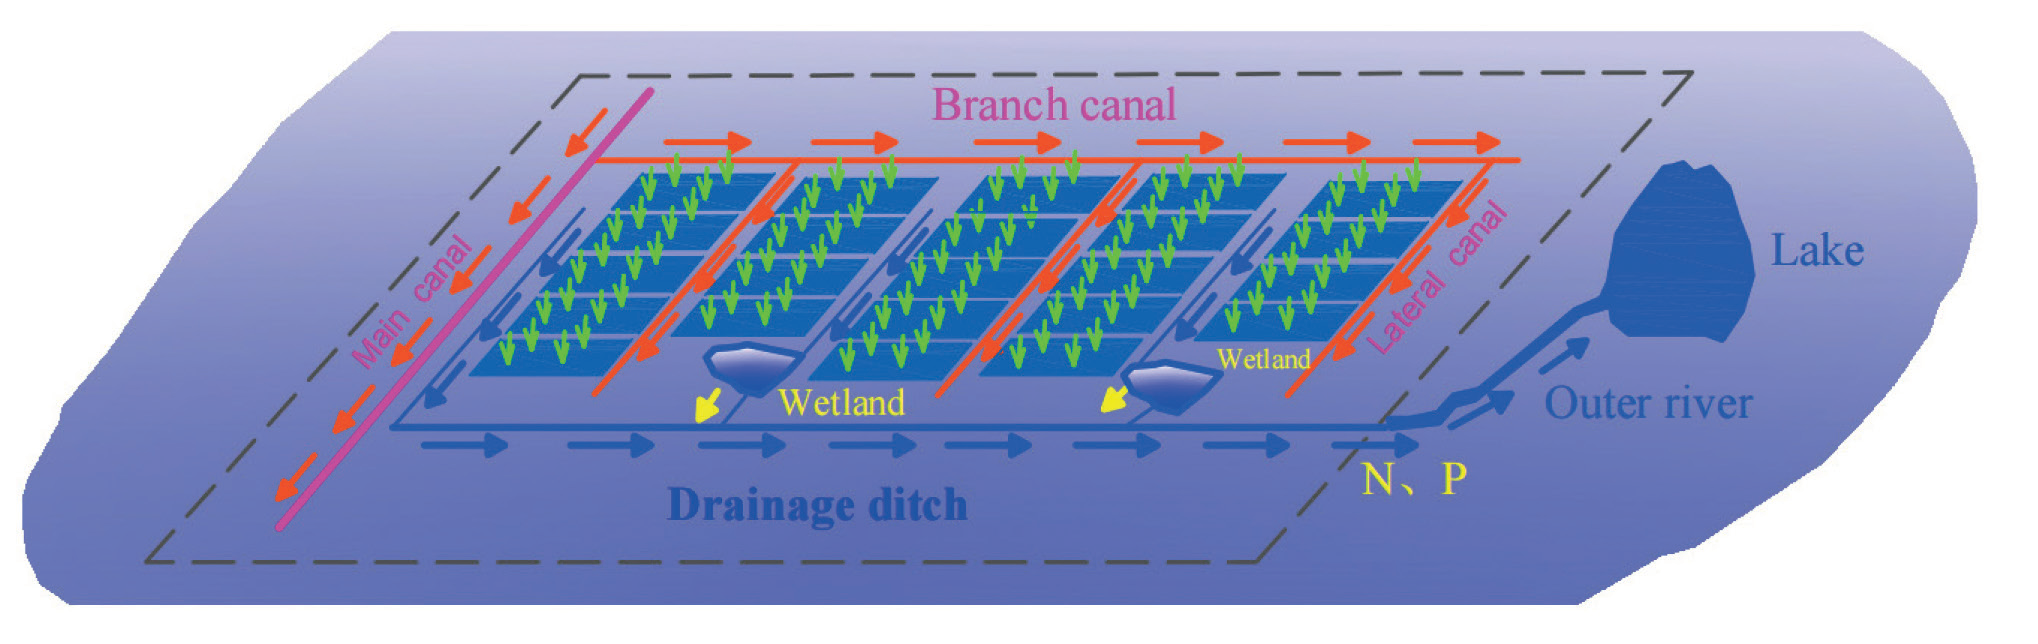
In summary, in actual production, on the one hand, it is necessary to improve the construction of drainage ditches at all levels in irrigation areas. On the other hand, irrigation areas should retain a certain amount of pond water surface (or wetland) and regularly carry out dredging to ensure the rational utilization of rainwater resources and efficient removal of non-point source pollution from farmland.
Conclusions
This study quantitatively studied the ability of different drainage systems to reduce N and P pollutants and their impact mechanism. The main conclusions were as follows.
(1) The concentration of N and P pollutants in various levels of drainage ditches was higher in July, with a larger fluctuation range in August and the lowest in September and October, and it was significantly higher at the inlet, while was significantly lower at the outlet of EDP system than that of DSG and FDD systems.
(2) The removal rates of TN, NO3--N, NH4+-N, and TP were 14.2–36.2%, 1.9–93.9%, 4.5–15.8%, and 0.4–24.2%, respectively, that showed drainage systems had a certain effect on interception and purification of N and P, and the EDP system had the highest removal capacity, followed by the DSG system.
(3) The ideal and actual removal rates of pollutants increased with the increase of pollutant degradation coefficient, and the implementation rate showed a flat U-shaped trend with the increase of pollutant degradation coefficient. When the degradation coefficient was at 0.01 d-1, the hydraulic connection had little effect on the pollutant removal. As it increased, the influence of the hydraulic connection gradually increased.
(4) The DSG system was equipped with a regulating gate at the end of the farm ditch, to increase the hydraulic retention time. The EDP system intercepts and purifies through the joint action of plants, microorganisms, and hydraulic retention time. Researches need to focus on the impact of hydrological and ecological environmental factors on the removal efficiency of pollutants.
(5) Integrating farmland, drainage ditches, and ponds (wetlands) as a whole can fully utilize the interception and purification effect on pollutants. It is recommended that a certain amount of pond water surface (wetland) be retained in the irrigation area to ensure the rational utilization of rainwater resources and efficient removal of non-point source pollution in farmland.

