

Introduction
Emulsion is a common auxiliary agent used in industrial fields, such as machinery and metals, mainly for lubrication, cooling, and anticorrosion measures during processing [1]. Emulsion is often used as a working medium for hydraulic transmission or cooling lubrication in mines owing to its cost effectiveness, safety, and good viscosity and temperature characteristics [2]. Therefore, emulsions play a crucial role in mining. However, during practical applications, severe emulsion leakage may occur. Emulsions are severely polluted and prone to issues such as mold growth, decay, and odor. In our country, during mining, a large amount of mechanical equipment is used, which produces mine water rich in emulsions.
Emulsions in mine water easily contaminate the surrounding groundwater. The pollution of water bodies caused by emulsions is mainly because of organic matter pollution. Furthermore, emulsions may enter the human body through the food chain, adversely affecting human health. With the updating and upgrading of coal mining equipment, the required emulsifier performance needs to be gradually improved. Notably, because of the patent protection of several emulsifiers, their chemical compositions are often not detailed. Emulsions exhibit different migration and transformation characteristics under different environmental conditions, which renders their processing remarkably difficult. Recently, the intensification of pollution due to emulsions has emerged as a severe concern. Understanding the composition of emulsions as well as their migration and transformation in mine water is of considerable significance for treating soil and mine water contaminated by emulsions.
Recent studies in this field have mainly focused on the treatment of emulsified mine water [3-14]. Hou et al. [15] used an electrochemical oxidation process utilizing a boron-doped diamond electrode to treat waste emulsified liquid from automobile-part factories, reducing the effluent concentrations of chemical oxygen demand (COD), ammonia nitrogen, and petroleum to values below 300, 30, and 20 mg/L, respectively. The removal rates of COD and petroleum were >99%, and the effluent water quality met the “comprehensive wastewater discharge standard” (GB 8978-1996). Wang et al. [16] used PAFC and PAM as flocculant and coagulant aids at concentrations of 200 and 1 mg/L, respectively, for treating emulsion wastewater. The dosing concentrations of PAFC and PAM were adjusted to achieve a CODCr removal rate of 93.7% during emulsion treatment.
Emulsions possess a considerably complex composition. Currently, studies on the migration and transformation of emulsion components after entering mine water are lacking. Wang et al. [17] revealed the migration and transformation mechanisms of typical petroleum organic pollutants in groundwater and soil using indoor static tests and seepage column simulation tests. They constructed a solute transport model of typical petroleum organic pollutants in groundwater and achieved prediction of typical petroleum organic pollutants. Gan et al. [18] studied the catalytic redox, adsorption-desorption, and biodegradation processes and associated mechanisms of typical heavy metals and organic pollutants at multiple interfaces, such as those between soil, minerals, water, and microorganisms. These studies focused on the properties, molecular structure, and environmental behavior of heavy metals and organic pollutants, as well as their migration and transformation patterns in soil.
Herein, emulsions and mine water were collected from the Daliuta mining area. The content and composition of the emulsions in mine water were analyzed via nuclear magnetic resonance (NMR) spectroscopy, Fourier transform infrared (FTIR) spectroscopy, X-ray fluorescence (XRF) spectroscopy, gas chromatography–mass spectrometry (GC–MS), and MS. The typical pollutants in the emulsions were identified. A dynamic migration and transformation environment for the emulsions in mine water was simulated. The main components of the emulsions were sampled and measured at regular intervals, and their migration and transformation in mine water were studied. Furthermore, the causes of their migration and transformation were analyzed, and health risk assessments were conducted using mine water containing different concentrations of emulsions, providing valuable reference for the treatment and monitoring of emulsions in mine water.
Material and Methods
Composition Analysis Experiment
The original emulsion is a water-based system, and its indicators, such as moisture and solid contents (nonvolatile matter), can aid in the selection of testing methods and the determination of components. Therefore, before testing the emulsion and dried emulsion samples, physical and chemical experiments should be conducted to determine their moisture and solid contents.
The emulsion samples were tested via NMR, MS, XRF, and GC–MS analyses. For the dried emulsion sample, FTIR analysis was performed. Based on the test results, the composition and content of the sample components were determined.
Migration and Transformation Experiment
From the underground area of Daliuta, 1 L of mine water was extracted and loaded into 1 L beakers. Thereafter, 0, 1, 5, 10, and 20 mL of emulsion were measured using a pipette and separately added to the beakers. According to this design standard, an additional 10 L of mine water storage solution containing emulsion was prepared, and it flowed through the aeration zone of the water accumulation filtration device from the top. To study the adsorption and migration of mine water contaminated with emulsion in the underground aquifer, the water was covered with a black plastic film. The system was maintained without light exposure. Samples were extracted at regular intervals to determine their typical pollutant composition and analyze their adsorption and migration mechanisms.
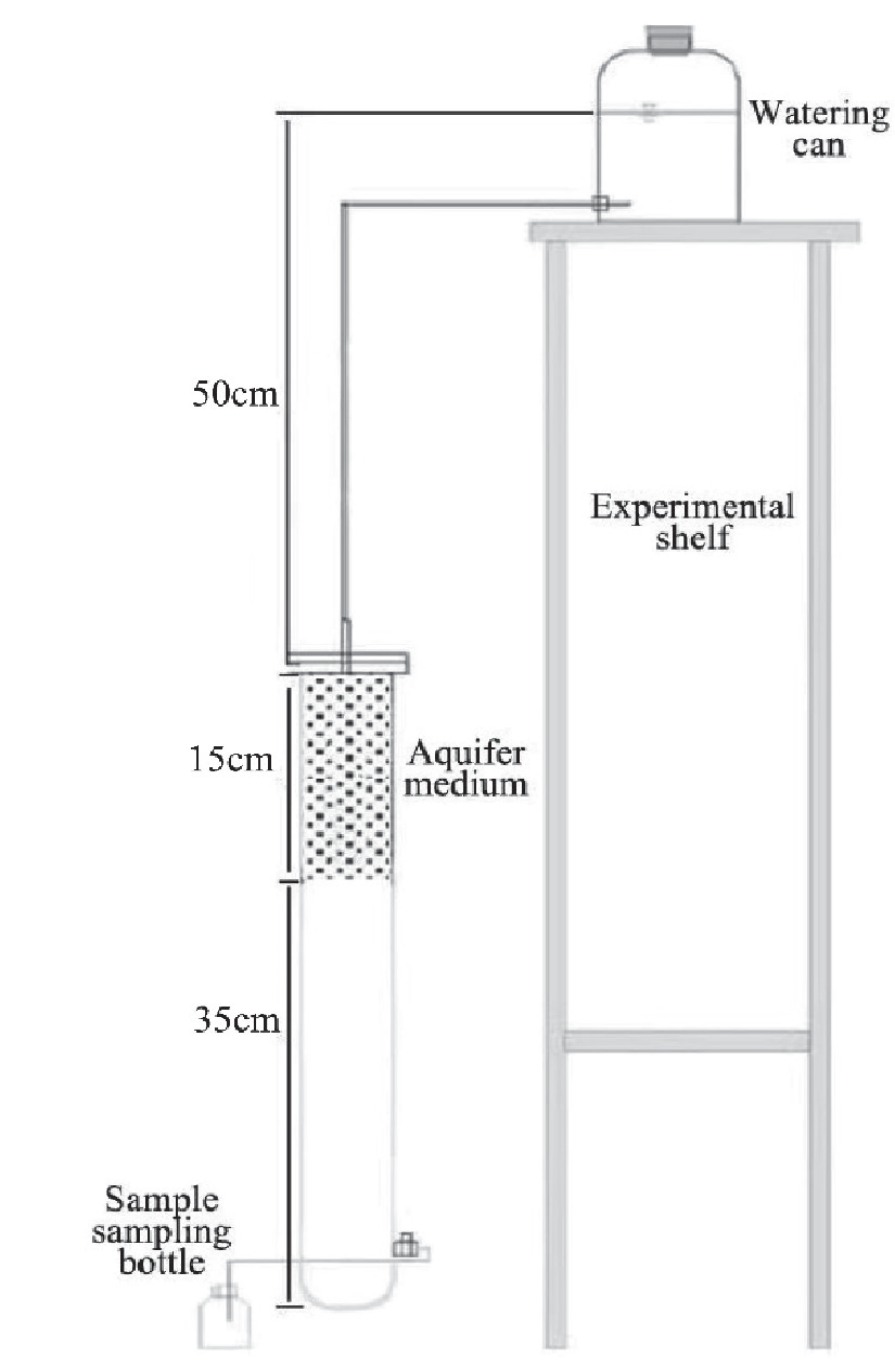
Experimental device: Five parallel experiments were conducted using seepage columns to simulate the aeration zone. The filling media were 4-8 mm sand, stone, 3-6 mm sand, coal, and fine sand. Its height was determined based on the thickness of the aeration layer, which is the deepest part in the center of the site, with a thickness of 15 cm and a seepage column diameter of 8 cm. After installing the soil column, its surface was covered with a layer of black plastic film to simulate a dark underground environment (Fig. 1).
Operation process: First, mine water was added to submerge the filling layer for 1 day to completely fill it with water. To simulate the infiltration of surface water on-site, the contaminated solution was regularly supplemented such that the water supply head of the five seepage columns remained the same as that of the on-site water and was stably maintained at approximately 15 cm. Samples were taken from the lower outlet for testing, including the analysis of the content of characteristic pollutants.
Health Risk Assessment
The exposure calculation method: By measuring or estimating the pathway, frequency, and intensity of human exposure to environmental pollutants as well as the physical and behavioral characteristics of the human body, the dose of carcinogens exposed to environmental pollutants was calculated, generally in mg/kg/day. The exposure can be calculated as follows:
Exposure index (EI) calculation method: The risk level of human exposure to environmental pollutants was calculated by comparing the dose of human exposure to environmental pollutants with the reference pollutant dose. The EI can be calculated using the following formula:
In the formula, E represents the exposure amount; EF is the exposure frequency; ED is the exposure time; and AT is the average time.
Hazard quotient (HQ) for noncarcinogenic effects:
In the formula, HQ is the hazard quotient (risk index); Di is the sum of the human exposure caused by the exposure route (mg/kg·d); and RfD is the reference dose for noncarcinogenic exposure pathways (mg/kg·d).
In the formula, ED is the daily intake of target pollutants via groundwater (mg/d); BW is the body weight (kg); IR is the daily water intake (L/d); and C is the concentration of the target pollutant (mg/L).
Results and Discussion
Emulsion Composition Analysis
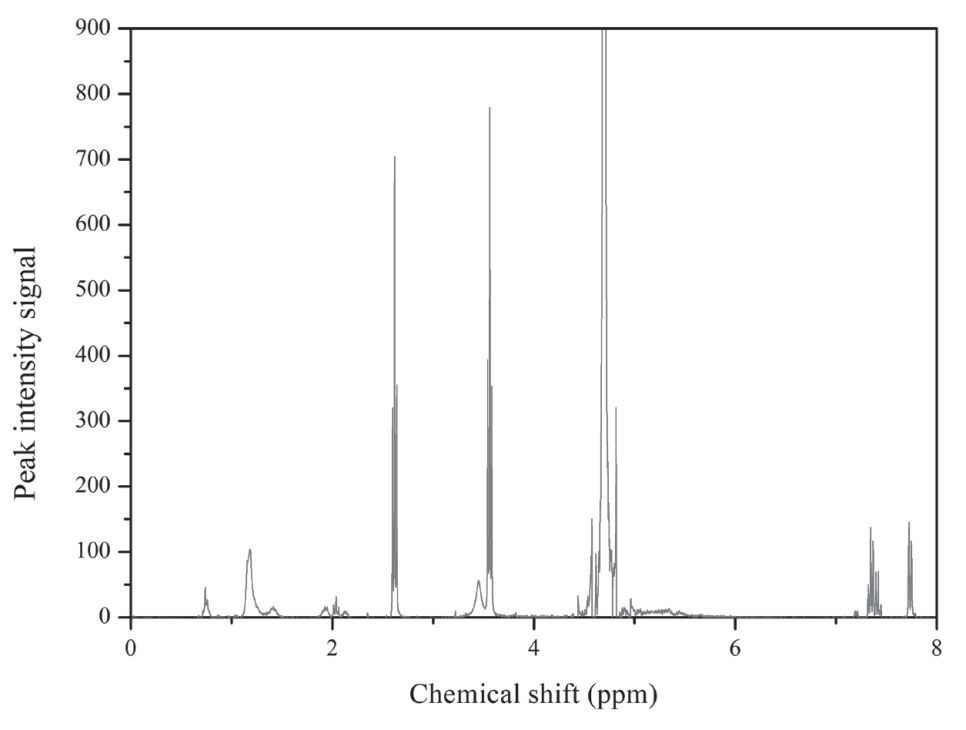
First, 0.1 g of the original test sample of the emulsified liquid was added to an Agilent vial. Thereafter, ~0.5 g of deuterium water was added, and the vial was sonicated using an ultrasound instrument for 30 min. When the sample was completely dissolved, 30 μL of the mixed bath solution was removed using a pipette and placed into a magnetic resonance imaging tube. Subsequently, 500 μL deuterium water was added, and the system was shaken evenly. The as-obtained sample was used for NMR analysis. The 1H NMR analysis results of the original emulsion sample are presented in Fig. 2.
NMR spectroscopy is a powerful analytical tool for studying the structure of substances. The basic principle of NMR spectroscopy is that under the action of a strong magnetic field, the magnetic force of certain elements and their atomic nuclear energy will split into two or more quantized energy levels. At an appropriate frequency, electromagnetic waves can be absorbed, resulting in transitions between magnetically induced energy levels. Under the action of a magnetic field, the molecules or atomic nuclei with nuclear magnetic properties will absorb energy equivalent to the energy difference between the two levels and transition from a low-energy state to a high-energy state, yielding a resonance spectrum. In the NMR spectrum, different absorption peaks appear under the action of different resonance magnetic fields based on the chemical environment of the H atomic nucleus. Accordingly, the sample components can be qualitatively and quantitatively determined.
The characteristic peaks in the 1H NMR spectrum of triethanolamine (TEOA) are attributed as follows: The peak at ~3.6 ppm corresponds to the hydrogen atom on the hydroxyl group of the ethanol group (–CH2CH2OH). The peak of the hydrogen atom on the carbon atom adjacent to the hydroxyl group is noted at ~3.4 ppm, whereas that of the hydrogen atom on the carbon atom connected to the nitrogen atom is observed at ~2.7 ppm. The peaks at 3.6 and 2.6 ppm in Fig. 2 are the characteristic peaks of TEOA.
The characteristic peaks in the 1H NMR spectrum of benzotriazole are assigned as follows: The hydrogen atom on the central benzene ring generally manifests as two triplet peaks, with a chemical shift of approximately 7.0-8.0 ppm for the two hydrogen atoms. The peak at ~8.3 ppm corresponds to a single hydrogen atom on the triazole ring. The peaks at 7.8 and 7.4 ppm in Fig. 2 are the characteristic peaks of benzotriazole.
The characteristic peaks in the 1H NMR spectrum of methylbenzotriazole are attributed as follows: The hydrogen atom on the central benzene ring generally manifests as two triplet peaks, with a chemical shift of approximately 7.0-8.0 ppm. The peak of one hydrogen atom on the triazole ring is observed at ~8.3 ppm, whereas that of the hydrogen atom on the methyl ring is observed at approximately 2.0-3.0 ppm. The peaks at 7.7, 7.3, 2.3, and 2.1 ppm in Fig. 2 are the characteristic peaks of methylbenzotriazole.
The characteristic peaks in the 1H NMR spectrum of hyponitrotriacetic acid are assigned as follows: The peak of the hydrogen atom on the hyponitro group is noted at ~4.5 ppm, whereas that of the hydrogen atom on the hydroxyl group appears at ~3.6 ppm. The peak of the hydrogen atom on the methyl group is observed at ~1.3 ppm. The peaks at 4.4, 3.6, and 1.2 ppm in Fig. 2 are the characteristic peaks of hyponitrotriacetic acid.
The 1H NMR spectrum of castor oleic acid generally exhibits distinct characteristic peaks in the range of 0-10 and 25-35 ppm. The methyl peak appears at 0.9-1.5 ppm, and the peak of the hydrogen atom in the alcohol group (–OH) is observed at ~3.6 ppm. The peak corresponding to the hydrogen atom near the double bond appears at ~5.5 ppm, whereas that of one hydrogen atom on the carboxyl group is noted at ~6.5 ppm. Peaks of the three hydrogen atoms on the methyl group next to the hydroxyl group are observed at ~2.3 ppm. The peaks at 5.3, 3.6, 2.3, 2.1, 2.0, 1.4, 1.2, and 0.8 ppm in Fig. 2 represent the characteristic peaks of castor oil acid.
Based on the characteristics of these component types, the peak positions were determined. Furthermore, in conjunction with their NMR peak intensities, the qualitative and quantitative analyses of these component types in the concentrated original emulsion sample were conducted. Noise errors and other offset or overlapping arrangements may affect the calculation of the peak area and consequently the integration results. Therefore, to ensure reliable, clear, and normal signal strengths, a common approach is to use concentrated samples.
For MS analysis, 1 g of the original emulsion sample was diluted 20 times with deionized water and then filtered using a filter membrane. Thereafter, it was placed in an Agilent vial. In MS analysis, high-energy electron beams are used to bombard sample molecules, destroying or generating electrons, which are then converted into charged molecular or fragment ions. The as-formed ions possess different masses; therefore, the time taken by these ions to reach the detector under the action of a magnetic field will vary. To qualitatively determine the sample components, the mass–charge ratios of these ions were recorded and analyzed using a mass spectrometer. Fig. 3 shows the MS-positive and -negative ion spectra of the original emulsion sample. The MS −1 characteristic peak of castor oil acid is observed at 297 m/z. The signals at 150 m/z and 172 m/z represent the MS +1 and MS +23 characteristic peaks of TEOA, respectively. The peak at 118 m/z is MS −1 characteristic peak of benzotriazole, whereas that at 132 m/z is the MS −1 characteristic peak of methylbenzotriazole. The MS −1 characteristic peak of benzoic acid is noted at 121 m/z.
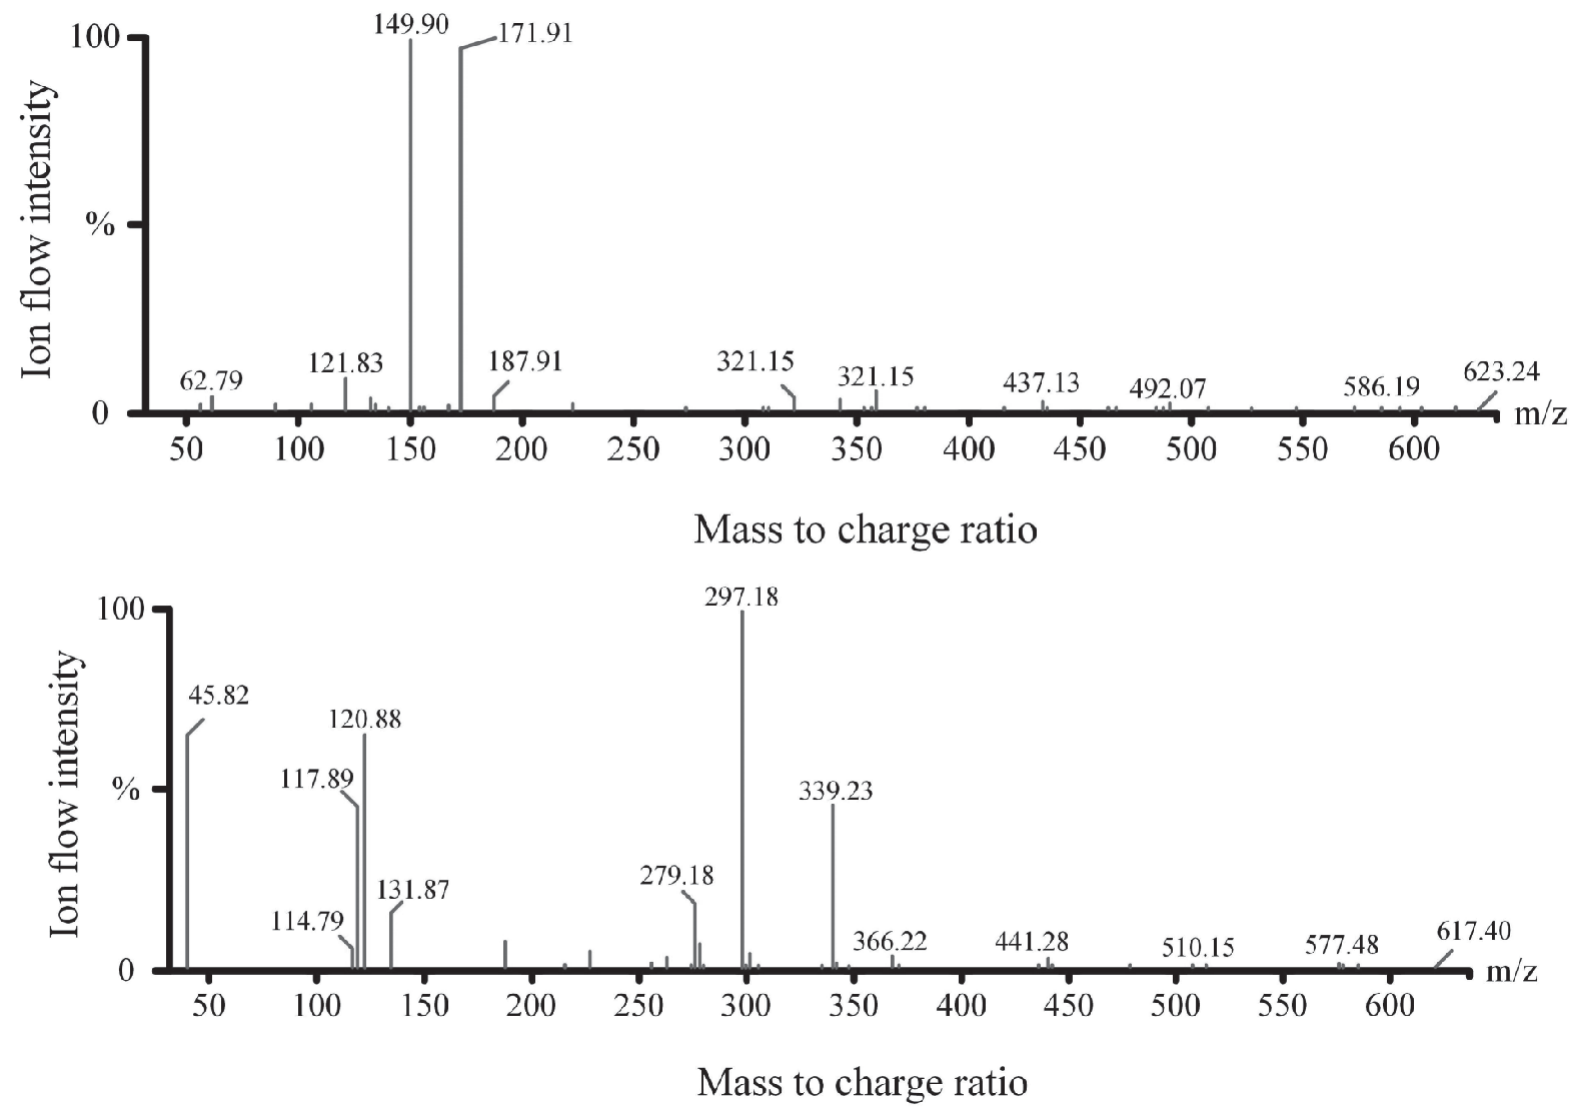
Among the observed peaks, MS±1 is the characteristic peak representing the addition or subtraction of H+; MS±18 indicates the addition or subtraction of NH4+; the MS±23 peak indicates the addition or subtraction of Na+; and MS±30 is the peak corresponding to the addition or subtraction of K+. The aforementioned peaks are the most commonly observed in MS analysis. Furthermore, peak information for categories such as 2M − 1, 3M + 1, and M/3 + 1 is available. Depending on the nature of the target sample and the product system, different peak modes may exist. Based on this information, the sample composition can be qualitatively analyzed. Additionally, by combining the intensity information of the peaks, the obtained findings can be verified using the NMR results.
Next, 1 g of the emulsified liquid was tested via XRF analysis using the compression method. XRF is the characteristic emission of radiation because of the energy released during the transition of electrons in the outer layer to holes in the inner layer. The characteristic XRF spectrum exhibits a one-to-one correspondence with the atomic coefficient. The elements in the sample can be qualitatively and quantitatively analyzed using the XRF spectrum. Table 1 lists the XRF analysis results for the original emulsion sample. The sample contains Na and K elements, along with small amounts of S and Cl. The contents of components with Na, K, S, and Cl elements are also presented in Table 1.
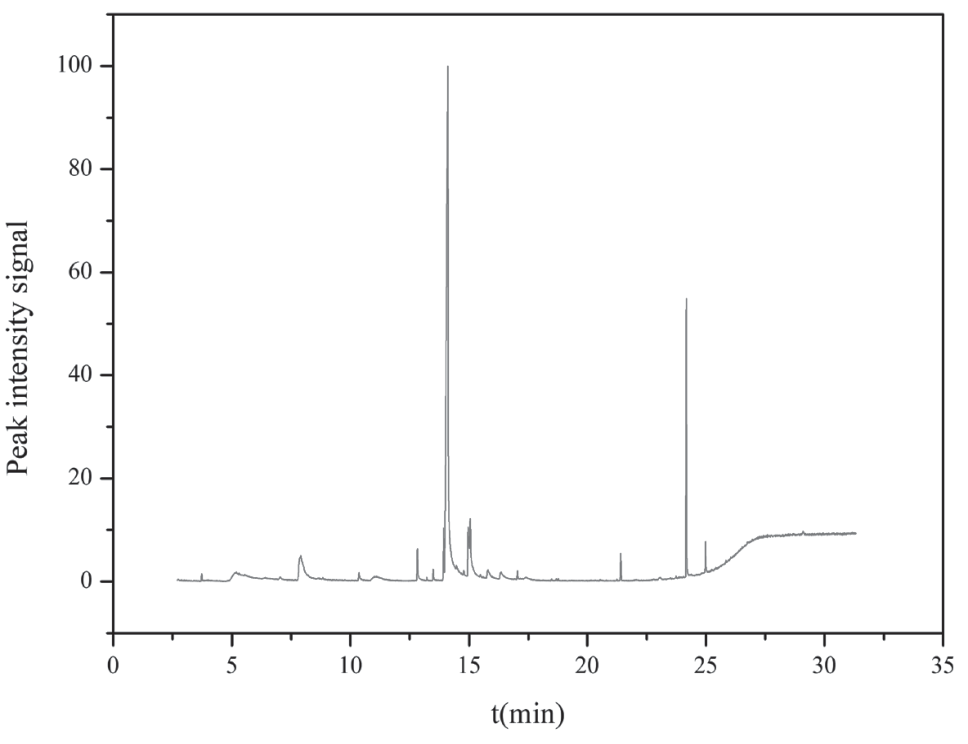
After extracting a certain amount of ethyl acetate from 1 g of the emulsified liquid sample using a separating funnel, the lower water sample was separated. The upper sample was dehydrated with anhydrous sodium sulfate, filtered through a nanofiltration membrane, and placed in an Agilent vial. The solvent method was used for GC–MS testing. In the GC–MS analysis, the sample is evaporated and then transferred to an adsorption column. Subsequently, the sample components are eluted through a carrier gas flow and then detected via MS to qualitatively analyze each component. This method can be used for the qualitative and quantitative analyses of components as well as for determining the structure of components in the sample. Fig. 4 shows the GC–MS spectrum of the emulsion after extraction with ethyl acetate. Spectral matching revealed that the original emulsion contained benzoic acid, TEOA, and TEOA borate.
Table 1.
XRF analysis results of the emulsion sample.
| Analyte | Calibration status | Compound formula | Concentration | Unit |
|---|---|---|---|---|
| Na | Calibrated | Na | 2.152 | % |
| Si | Calibrated | Si | 12.7 | ppm |
| S | Calibrated | S | 15.5 | ppm |
| Cl | Calibrated | Cl | 6.9 | ppm |
| K | Calibrated | K | 0.319 | % |
| <C> | C6H10O5 | 97.526 | % |
FTIR analysis was performed using 0.1 g of the dried original emulsion sample via the smear method. In FTIR spectroscopy, the vibration and deformation motion of the atoms of the molecules of different substances determine their absorption (transmittance) of light of different wavelengths. By adjusting the wavelength of the incident light and measuring the transmittance (or absorbance) at different wavelengths, absorption spectra can be obtained. During molecular vibrations, the vibrational frequencies of the same type of chemical bond are considerably equivalent, and they generally appear in a specific region. However, certain differences were observed between them. The main components of the dried original emulsion sample were qualitatively analyzed using the FTIR absorption spectrum obtained in the mid-infrared region (400–4000 cm−1). Fig. 5 displays the FTIR spectrum of the dried emulsion sample. The peak at 3353 cm−1 corresponds to –OH. The peaks at 2945, 2926, and 2851 cm−1 are the characteristic peaks of –CH2 and –CH3. The characteristic peaks of –COOH, aromatic C=C bond, C–N, O–H bending vibration, C–H bond on the benzene ring, and C–O stretching vibration are observed at 1607, 1574, 1402, 1321, 1231, and 1034 cm−1, respectively. The FTIR analysis results of the dried emulsion sample reveal the presence of benzene ring compounds, alcohols, and carboxylic acid components.
Based on the physical and chemical experimental data of the original emulsion sample, the NMR, MS, XRF, and GC–MS analysis results of the original emulsion sample, and the FTIR analysis results of the dried emulsion sample, the individual components in the original emulsion sample were qualitatively verified. Thereafter, each component was quantified. The underground emulsion sample comprises 10 components: TEOA, sodium benzoate, benzotriazole, methylbenzotriazole, sodium nitrite, sodium castor oleate, sodium hyponitrotriacetate, TEOA oleate polyoxyethylene ether, TEOA borate, and water. Table 2 lists the composition and content of the emulsion currently used in Daliuta.
Determination of Typical Pollutants
The emulsion used underground in the Daliuta mining area was sampled, and its chemical composition and the content of organic and inorganic components with a concentration of ≥0.1% were analyzed via different techniques. The analysis of various components as well as organic pollution and environmental impact assessments revealed that the main pollutants in the mine water contaminated by the emulsion are TEOA, sodium benzoate, sodium salt of nitrous triacetate, and sodium nitrite. The concentrations of the aforementioned components are relatively high. Although sodium benzoate is frequently used as a preservative and food additive, its long-term intake at high dosages may negatively affect physical health, leading to damage to the liver, kidneys, and nervous system. Additionally, several individuals may develop allergic reactions to sodium benzoate, which may cause skin irritation or respiratory issues. According to data from the World Health Organization, long-term exposure to high concentrations of sodium hyponitrotriacetate may cause skin irritation and allergic reactions, as well as adverse effects on the respiratory, digestive, and central nervous systems. Meanwhile, long-term, high-dose exposure to TEOA may also pose health hazards, including liver damage and reproductive toxicity. Based on the aforementioned information, TEOA, sodium benzoate, sodium hyponitrotriacetate, and sodium nitrite were selected as the typical pollutants for this study.
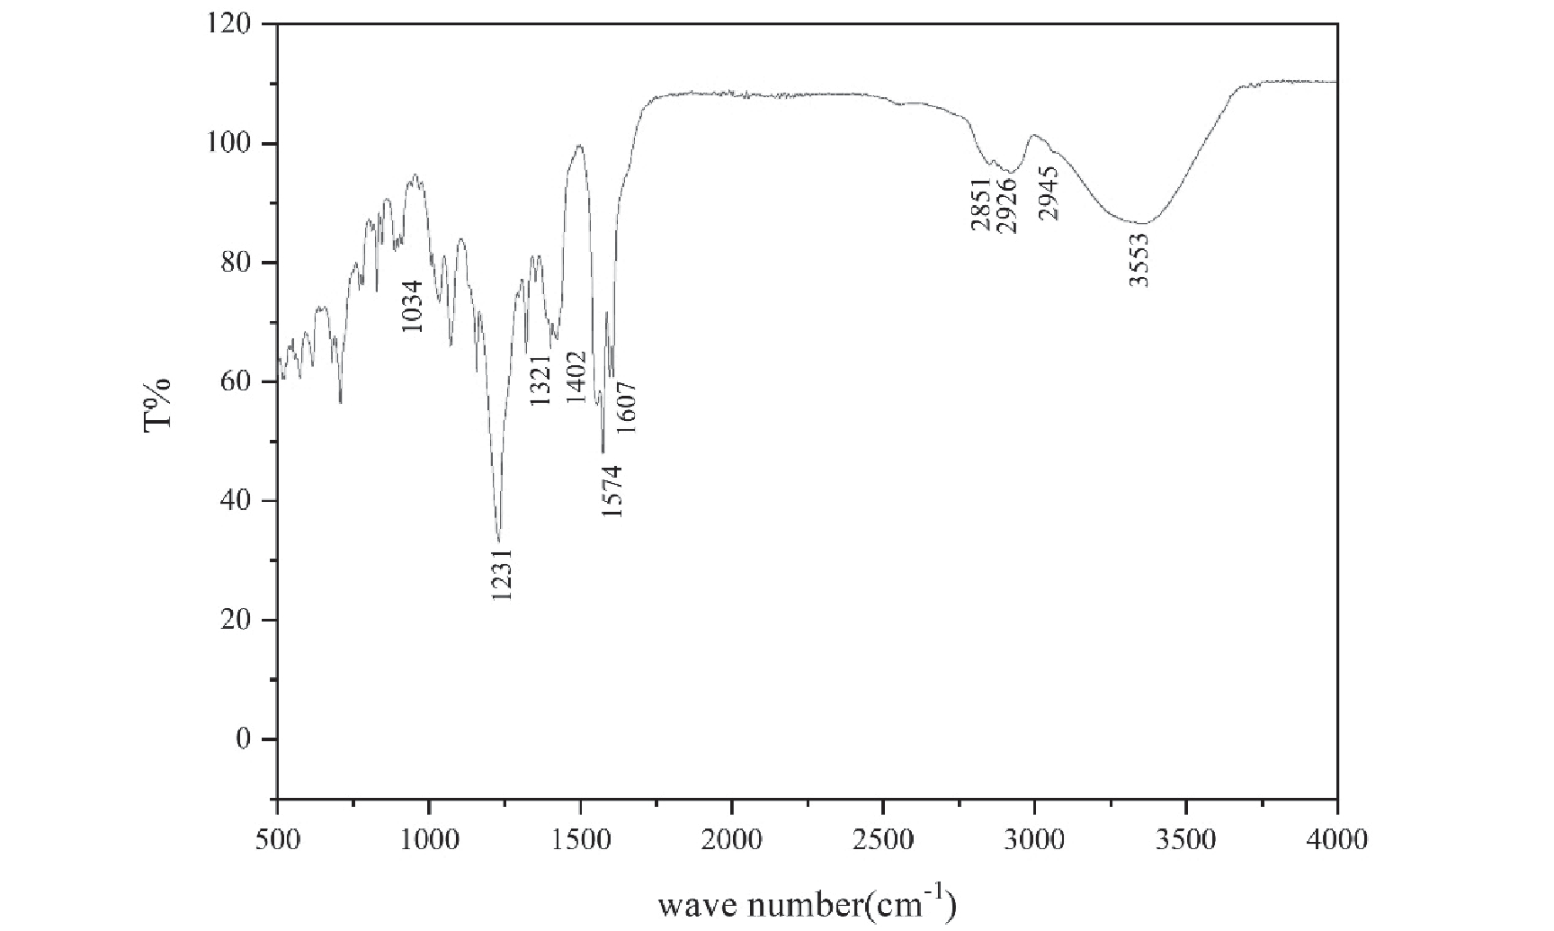
Table 2.
Composition and content of each component in the original emulsion sample.
To determine the content of hyponitrotriacetic acid, the testing liquid was first measured, filtered, and centrifuged. Thereafter, chloroform was added, followed by vortex mixing. Subsequently, the upper clear liquid was obtained, and a ferric chloride derivative was added to fix the volume. Afterward, the content of the sodium salt of hyponitrotriacetic acid was determined using an ultraviolet spectrophotometer. Next, to measure the TEOA content, the testing liquid was measured, filtered, and centrifuged. Next, methanol was added to the water sample, subjected to high-speed centrifugation, and mixed evenly. Subsequently, the mixture was passed through 0.22 μm. The TEOA content was measured via liquid chromatography-tandem MS using a membrane filter. To determine the presence of sodium nitrate, the testing solution was measured, filtered, and centrifuged. Thereafter, the aqueous solution was passed through 0.22 μm. Subsequently, the content of sodium benzoate was separated using a liquid chromatograph with a membrane filter. The presence of sodium nitrite was determined using diazo coupling spectrophotometry.
Analysis of Dynamic Migration Results of Typical Pollutants in Emulsion
The concentration change curve for the dynamic migration of typical pollutants is shown in Fig. 6. When the mine water containing the emulsion enters the dynamic aeration zone of the waterlogging leaching device, the concentration of various typical pollutants is significantly reduced. However, during dynamic experimental migration, microbial action and the adsorption effect of the aeration zone of the aquifer exist. Therefore, the concentration changes of typical pollutants during dynamic migration and transformation are mainly due to the combined action of microorganisms and adsorption. Notably, 5 days after the entry of the mine water containing the emulsion into the dynamic aeration zone of the water accumulation leaching device, the concentrations of sodium nitrite and sodium benzoate were almost completely depleted. On the 5th day, the TEOA pollutant in 1 L mine water mixed with 1 mL emulsion was completely depleted. The TEOA concentrations in 1 L mine water comprising 5, 10, and 20 mL emulsion decreased by 3.8, 25.2, and 22.1 mg/L, with decreases of 15.8%, 52.1%, and 23.1%, respectively. The sodium hyponitrotriacetate in 1 L mine water mixed with 1 mL emulsion was completely depleted on the 5th day. The concentrations of sodium hyponitrotriacetate in 1 L mine water mixed with 5, 10, and 20 mL emulsion decreased by 393.0, 575.5, and 864 mg/L, with decreases of 92.0%, 82.2%, and 81.1%, respectively.
When the porous adsorption medium in the seepage column comes into contact with mine water containing organic pollutants, such as oil, the solute in it will be separated via electrostatic or chemical forces and will attach to the surface or inside of the adsorbent in the porous medium. This process is called adsorption [19]. Based on the adsorption forces, adsorption can be divided into two types. Adsorption caused by electrostatic attraction and van der Waals force is termed physical adsorption, which is reversible. Adsorption due to the chemical bonding force between the adsorbent and adsorbent is known as chemical adsorption, which is irreversible [20]. However, the adsorption of pollutants by porous-structured adsorbents generally involves multiple adsorption processes. Furthermore, competitive adsorption is observed between pollutants [21]. Based on the aforementioned information, soil mainly relies on minerals and organic matter for adsorption. Mineral components mainly adsorb pollutants via physical adsorption. Owing to the polarity of the mineral surface, polar water molecules can bond with the mineral surface to form surface adsorption sites. Generally, organic matter in soil possesses a considerably complex molecular structure and rich surface functional groups, and it adsorbs pollutants in high proportions. Therefore, organic matter plays an important role in the adsorption of organic pollutants [22].
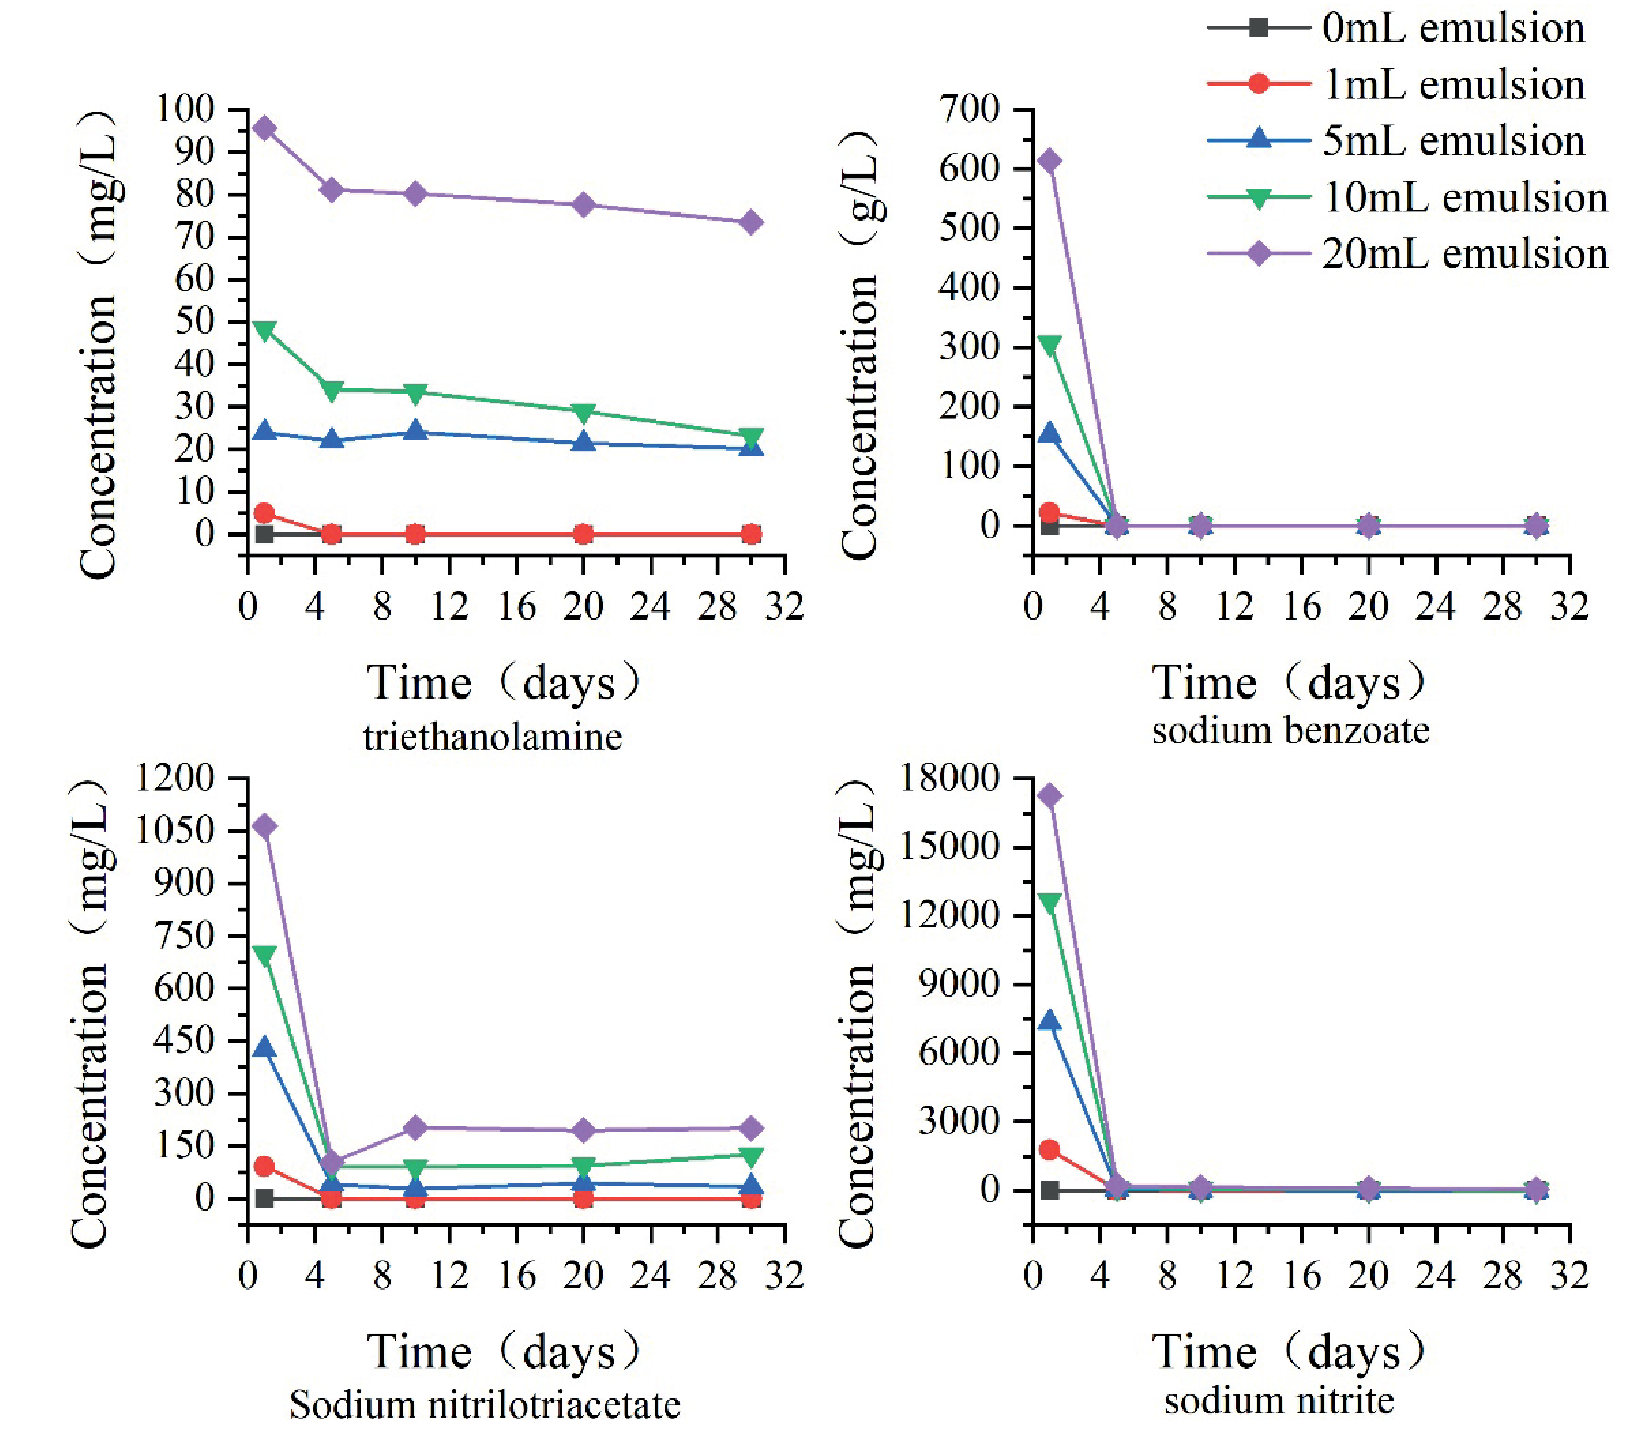
Fig. 7 shows the concentration change curve for the adsorption and migration of sodium benzoate. After the emulsified mine water enters the dynamic aeration zone of the water accumulation filtration device, significant adsorption occurs, resulting in a rapid decrease in the sodium benzoate concentration. Subsequently, owing to the limited adsorption capacity of the aeration zone of the water accumulation filtration device, the sodium benzoate concentration in the emulsified mine water increased with time. The curve for 1 L of mine water added with 1 mL of emulsion mainly indicates the complete degradation of microorganisms on the 5th day, resulting in ineffective adsorption. This result suggests that the peak concentration was reached on the 5th day. The sodium benzoate concentration in 1 L mine water added with 5 mL emulsion increased from 0.0 to 153.5 g/L, and the adsorption rate decreased from 100.0% to 0.0%. The sodium benzoate concentration in 1 L mine water mixed with 10 mL emulsion increased from 0.0 to 186.2 g/L, and the adsorption rate decreased from 100.0% to 39.4%. The sodium benzoate concentration in 1 L mine water added with 20 mL emulsion increased from 0.0 to 204.6 g/L, and the adsorption rate decreased from 100.0% to 66.7%.
Fig. 8 shows the concentration change curve for the adsorption and migration of sodium hyponitrotriacetate. After the emulsified mine water enters the dynamic aeration zone of the water accumulation leaching device, significant adsorption occurs, resulting in a rapid decrease in the sodium hyponitrotriacetate concentration. Subsequently, owing to the limited adsorption capacity of the aeration zone of the water accumulation leaching device, the sodium hyponitrotriacetate concentration in the emulsified mine water increased with time. The curve for 1 L of mine water added with 1 mL of emulsion mainly suggests the complete degradation of microorganisms on the 20th day, resulting in ineffective adsorption. This indicates that the peak concentration was reached on the 20th day, increasing from 0.0 to 91.5 mg/L. The sodium hyponitrotriacetate concentration in 1 L mine water mixed with 5 mL emulsion reached its maximum value on the 20th day, increasing from 0.0 to 277.0 mg/L, and the adsorption rate decreased from 100.0% to 35.1%. The sodium hyponitrotriacetate concentration in 1 L mine water comprising 10 mL emulsion increased from 0.0 to 439 mg/L, and the adsorption rate decreased from 100.0% to 37.3%. The sodium hyponitrotriacetate concentration in 1 L mine water added with 20 mL emulsion increased from 0.0 to 491.0 mg/L, and the adsorption rate decreased from 100.0% to 53.9%.
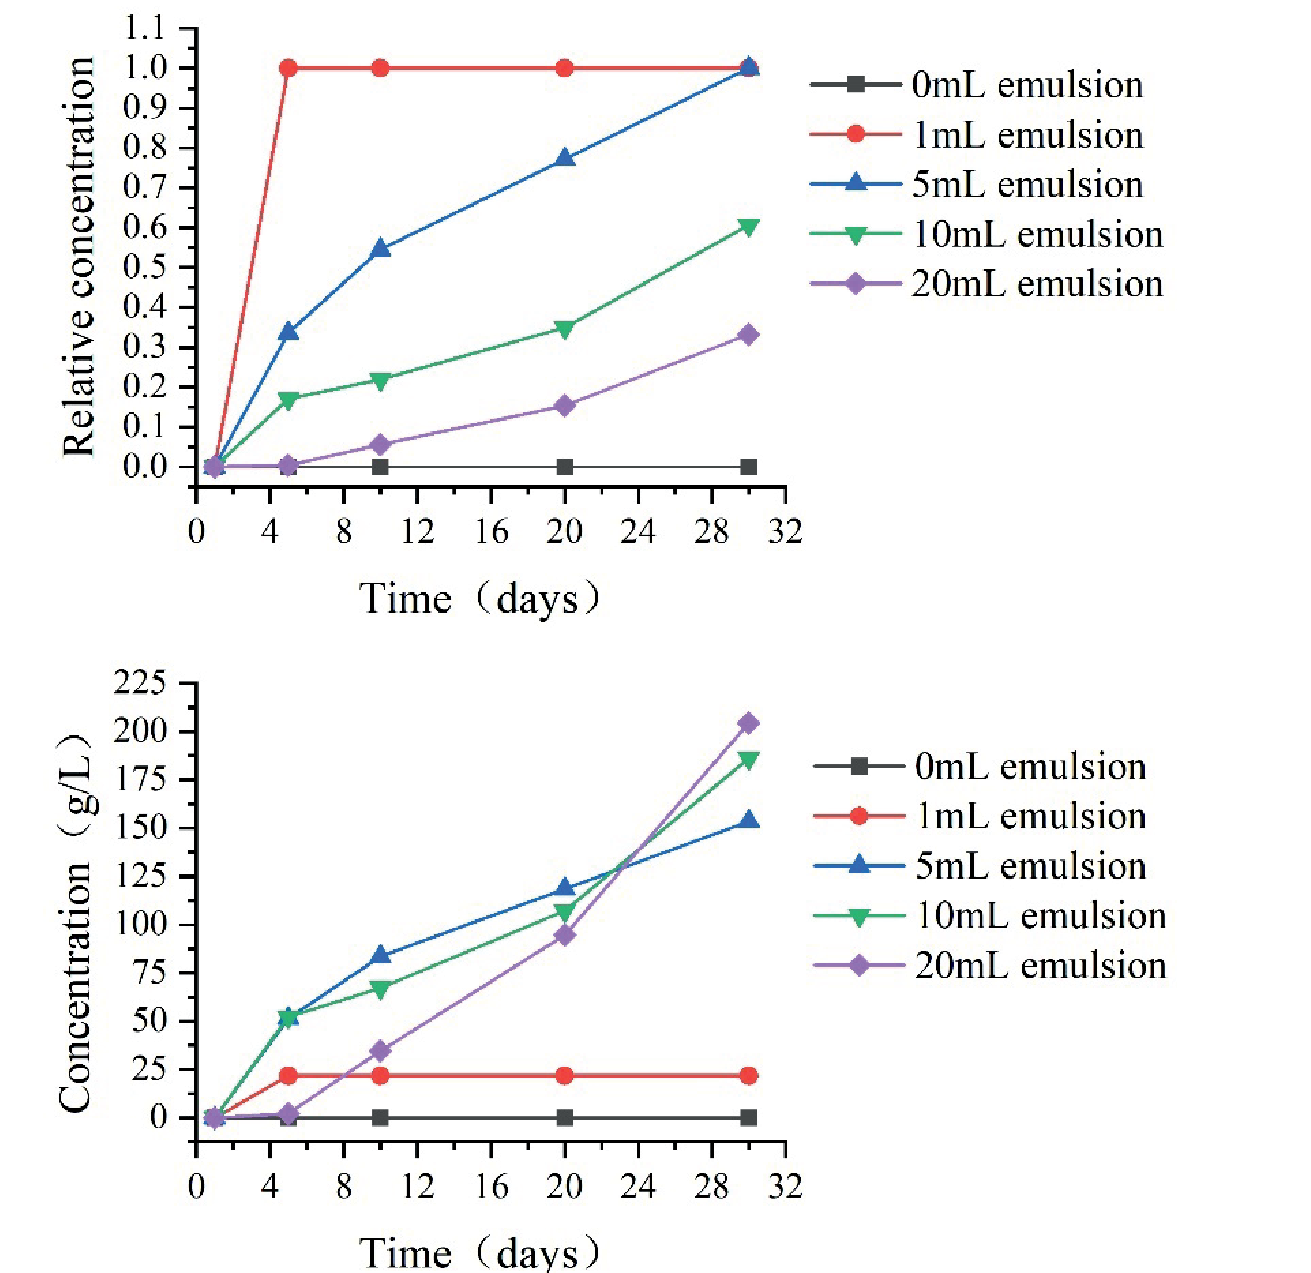
Fig. 9 shows the concentration change curve for the adsorption and migration of sodium nitrite. From Fig. 9, after the emulsion-containing mine water enters the dynamic aeration zone of the waterlogging leaching device, significant adsorption occurs, resulting in a rapid decrease in the sodium nitrite concentration. Subsequently, owing to the limited adsorption capacity of the aeration zone of the waterlogging leaching device, the sodium nitrite concentration in the emulsion-containing mine water increased with time. The curve for 1 L of mine water mixed with 1 mL of emulsion mainly suggests the complete degradation of microorganisms on the 20th day, resulting in ineffective adsorption. This indicates that the peak concentration was reached on the 20th day, increasing from 0.0 to 850.0 mg/L, and the adsorption rate decreased from 100.0% to 52.0%. The sodium nitrite concentration in 1 L mine water with 5 mL emulsion increased from 0.0 to 6,550 mg/L, and the adsorption rate decreased from 100.0% to 10.9%. The sodium nitrite concentration in 1 L mine water with 10 mL emulsion increased from 0.0 to 5007.8 mg/L, and the adsorption rate decreased from 100.0% to 32.1%. The sodium nitrite concentration in 1 L mine water with 20 mL emulsion increased from 0.0 to 2351.0 mg/L, and the adsorption rate decreased from 100.0% to 86.4%.
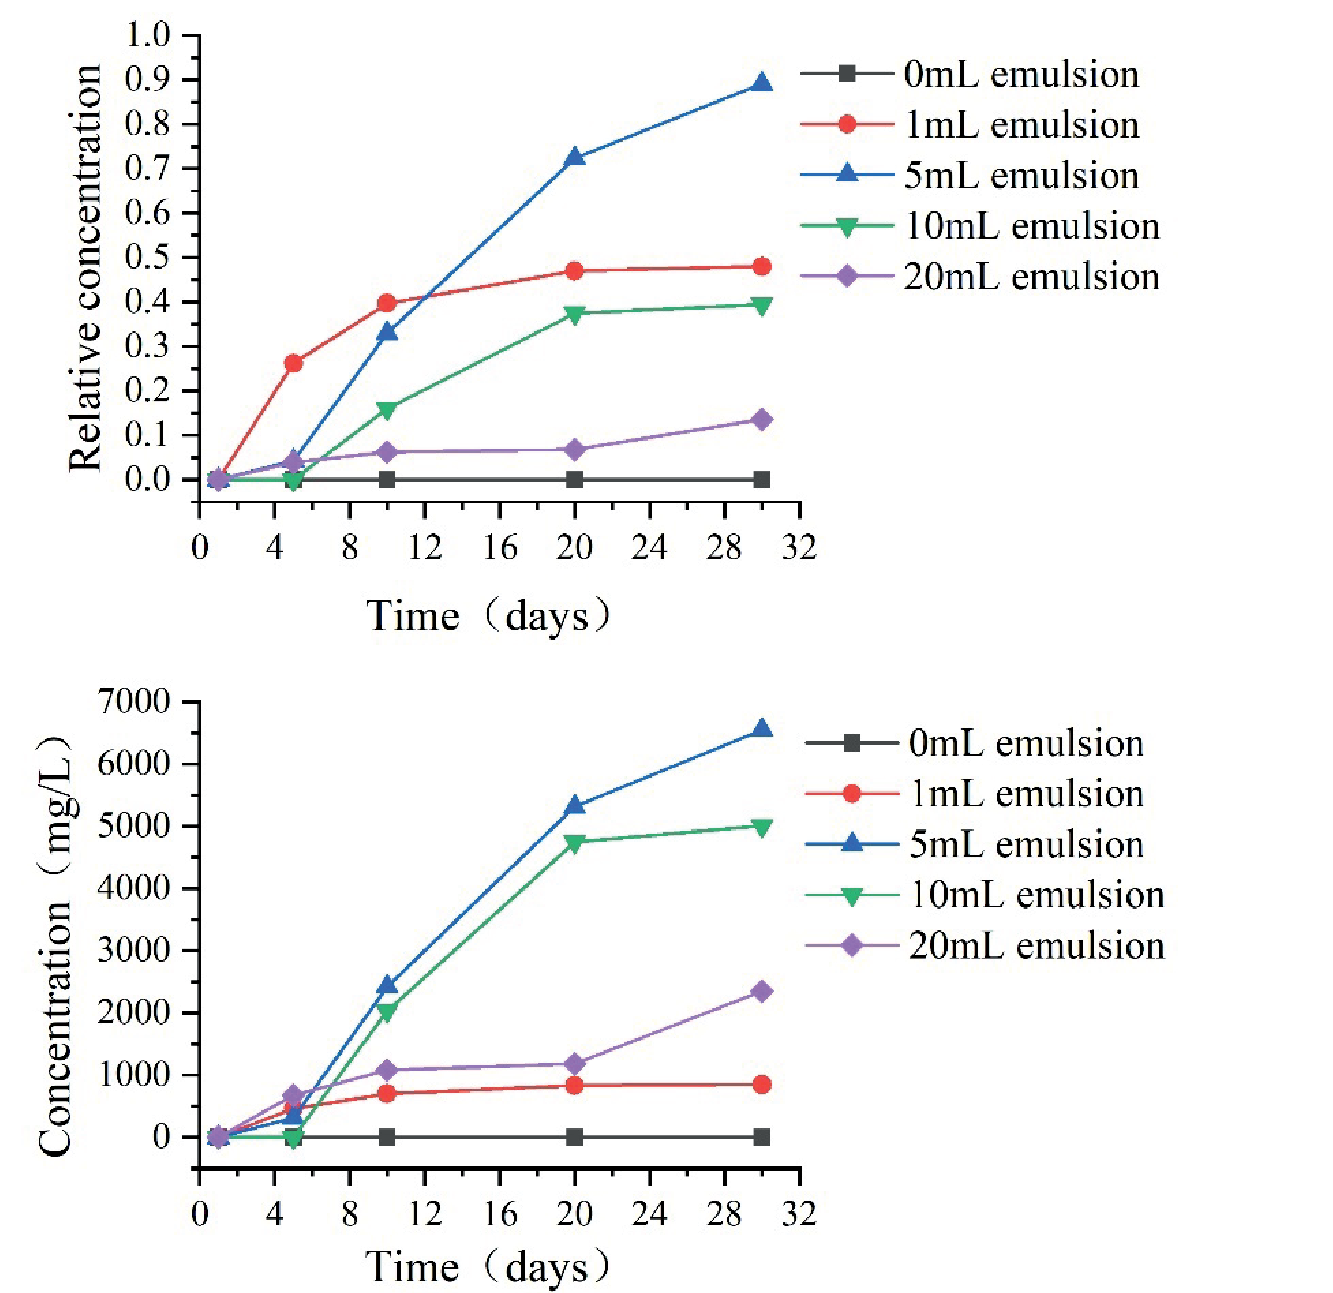
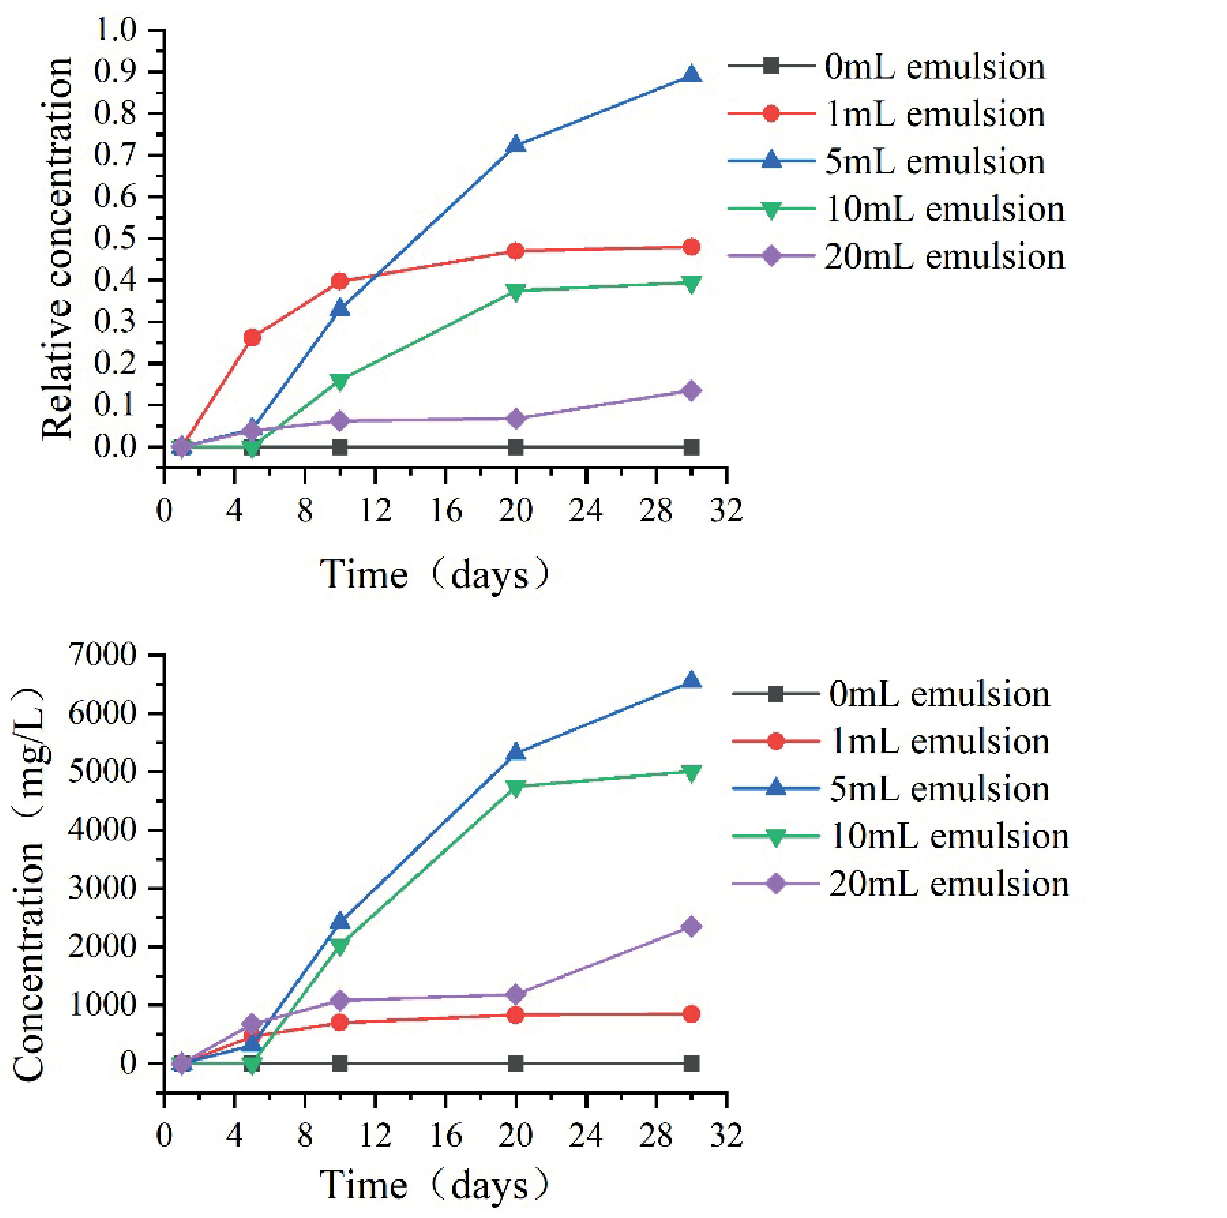
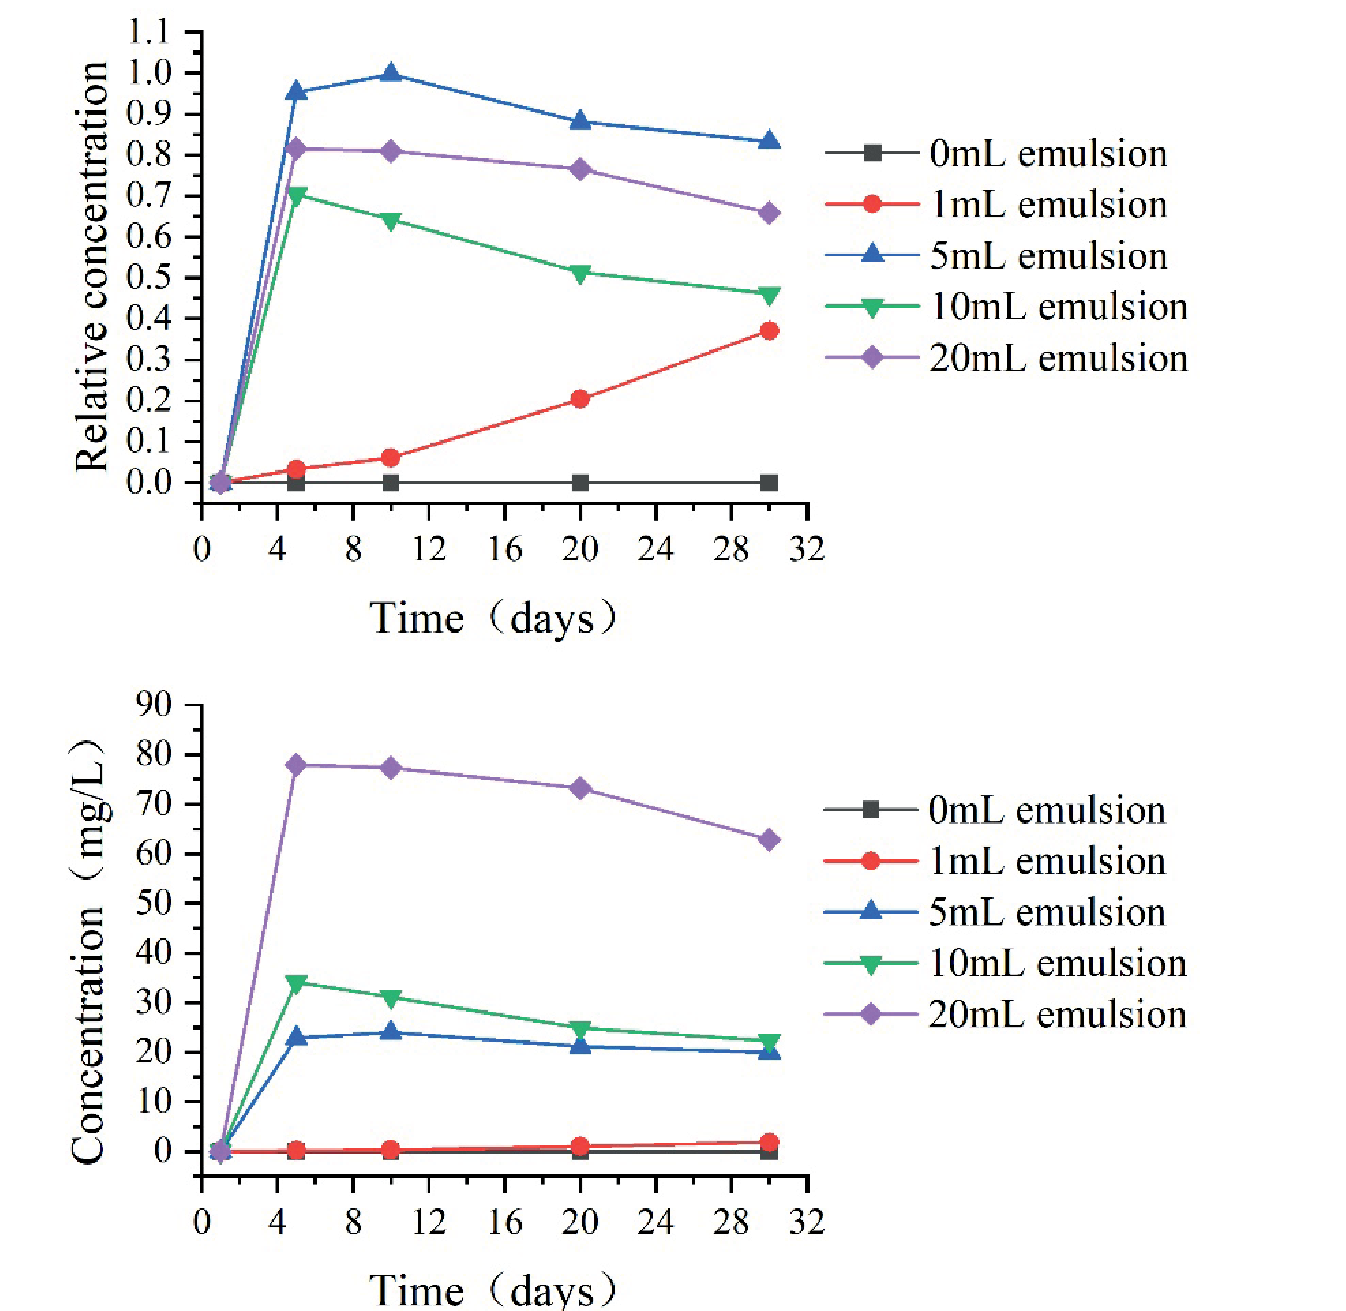
Fig. 10 shows the concentration change curve for the adsorption, migration, and transformation of TEOA. From Fig. 10, after the emulsified mine water enters the dynamic aeration zone of the water accumulation leaching device, significant adsorption occurs, resulting in a rapid decrease in TEOA concentration. Subsequently, owing to the limited adsorption capacity of the aeration zone of the water accumulation leaching device, the TEOA concentration in the emulsified mine water increased with time. For 1 L mine water with 1 mL emulsion, the TEOA concentration was 1.8 mg/L on the 30th day, and the adsorption rate was 62.9%. This is mainly because of the decrease in the TEOA concentration caused by static microbial degradation. Therefore, after removing microbial effects, the concentration of TEOA increased. For 1 L mine water mixed with 5 mL emulsion, the TEOA concentration increased to 24.0 mg/L on the 10th day and then decreased to 20.0 mg/L on the 30th day; the adsorption rate decreased from 100.0% to 0.3% and then increased to 14.7%. The TEOA concentration in 1 L mine water with 10 mL emulsion increased to 34.1 mg/L on the 5th day and then decreased to 22.3 mg/L. The adsorption rate decreased from 100.0% to 29.6% and then increased to 53.9%. The TEOA concentration in 1 L mine water added with 20 mL emulsion increased to 77.9 mg/L on the 5th day and then decreased to 62.9 mg/L. The adsorption rate decreased from 100.0% to 18.5% and then increased to 34.2%. This is mainly due to the hydrolysis of TEOA borate ester during the static migration and conversion process, which produces TEOA, increasing its concentration and adsorption.
Health Risk Assessment
Human health risk assessment is a process of analyzing the effects of environmental pollutants on human health. It can be used to quantitatively determine the potential health risks due to pollution in the human body. Humans are exposed to pollutants through various means, including ingestion (drinking water), inhalation (breathing), and skin contact (cleaning and washing) [23, 24]. Various models have been widely used for health risk assessment [25]. Based on the investigation of the Daliuta mining area, exploring the water safety issues in the area and analyzing the health risks due to pollutants to the population are necessary. The as-obtained results can provide a theoretical basis for the treatment, utilization, and monitoring of emulsified mine water.
According to the United States Environmental Protection Agency (USEPA), the reference dose (RfD) values for the noncarcinogenic exposure pathways of nitrite, TEOA, sodium benzoate, and sodium hyponitrotriacetate are 0.1, 0.05, 5, and 0.05 mg/kg·d [26], respectively. For individuals ingesting surface water and groundwater pollutants through their mouths, the exposure frequency, exposure time, and average time are 330 d/a, 58 a, and 25550 d, respectively. When HQ>1, the typical pollutant may pose a potential noncarcinogenic risk, and when HQ<1, the pollutant does not pose a chronic noncarcinogenic risk [27]. When EI>1, human exposure to the typical environmental pollutant may pose health risks, and when EI<1, human exposure to this environmental pollutant may not pose health risks.
Considering the significant differences in health risks among different age groups, the population was divided into the following four groups: babies (0-0.5 years old), children (0.5-10 years old), youths (10-18 years old), adult men (18-70 years old males), and adult women (18-70 years old females). Table 3 lists the values of each parameter [28, 29].
Based on the calculation results obtained using the USEPA noncarcinogenic health risk assessment model, the simulated mine water containing emulsion possesses an HQ of >1 for sodium nitrite, sodium benzoate, and TEOA for different recipient populations. The noncarcinogenic health risk of water samples containing sodium nitrite, sodium benzoate, and TEOA for different recipient populations is at an unacceptable level. For mine water without emulsion, the HQ of sodium nitrite, sodium benzoate, and TEOA for different recipient populations is <1, indicating an acceptable level of noncarcinogenic health risk. The EI of water samples containing sodium hyponitrotriacetate for different receptor populations was >1, suggesting that human exposure to this environmental pollutant may pose health risks. The main reason for this may be that the amount of emulsion in the simulated mine water in our experiment is substantially high. However, its actual concentration may not be as high as this value, and consequently, the concentrations of sodium nitrite, sodium benzoate, TEOA, and sodium hyponitrotriacetate in the water sample significantly exceed the normal range.
Table 3.
Parameter values of health risk assessment.
Table 4.
Reference concentration of pollutants in mine water when HQ = 1.
Table 5.
Reference concentration of pollutants in mine water when EI = 1.
| EI (exposure index) | Sodium hyponitrotriacetate (mg/L) |
|---|---|
| EI (baby) = 1 | 1.60 |
| EI (children) = 1 | 0.89 |
| EI (youth) = 1 | 2.12 |
| EI (adult men) = 1 | 1.67 |
| EI (adult women) = 1 | 2.00 |
Therefore, the reference concentrations of sodium nitrite and sodium benzoate under the condition of HQ = 1, as well as the reference concentrations of TEOA and sodium hyponitrotriacetate under the condition of EI = 1, should be calculated for different recipient populations (Tables 4 and 5) to provide a corresponding assessment basis for mine water monitoring.
Conclusions
This study analyzed the components of an original emulsion sample, finding a total of 10 components in the emulsion used under the Daliuta mine. Typical pollutant components, such as TEOA, sodium benzoate, sodium nitrite, and sodium hyponitrotriacetate, were selected for the subsequent study, and the migration and transformation of these components in mine water were analyzed. The results revealed that after the emulsified mine water entered the dynamic aeration zone of the water accumulation leaching device, the concentration of various typical pollutants significantly decreasedreduced, indicating significant adsorption and migration effects. Subsequently, the adsorption effect was significantly reduced. The adsorption rates of sodium benzoate in 1 L mine water with 1, 5, 10, and 20 mL emulsions on the 30th day were 0%, 0%, 39.4%, and 66.7%, respectively. The adsorption rates of sodium hyponitrotriacetate in 1 L mine water with 1, 5, 10, and 20 mL emulsions were 0%, 35.1%, 32.1%, and 53.9% on the 30th day, respectively. Thus, the adsorption rates of sodium benzoate and sodium hyponitrotriacetate increased with an increase in the emulsion concentration on the 30th day. The adsorption rates of sodium nitrite in 1 L mine water with 1, 5, 10, and 20 mL emulsions on the 30th day were 52.0%, 10.9%, 60.5%, and 86.4%, respectively. The adsorption rates of TEOA in 1 L mine water with 1, 5, 10, and 20 mL emulsions on the 30th day were 62.9%, 14.7%, 53.1%, and 34.2%, respectively. Finally, the USEPA non-carcinogenic health risk assessment model and carcinogen EI calculation method were used to evaluate and predict health risks for different age groups, providing theoretical support for the subsequent treatment and monitoring of emulsified mine water.

