

Introduction
With the rapid development of human society and the level of the economy, which brings with it a number of other factors, the volume of waste generated by the population and by various branches of industry has increased dramatically. The volume of household waste in Europe has increased year by year, most relevantly evidenced by the change in the amount of waste per capita. According to European statistics, in 1995, 467 kg of household waste was generated per person, a value that has increased to 527 kg of household waste per person in 2021 [1]. This is why, at the European level, a series of directives and programs are being implemented to reduce the amount of waste generated by the population or to recover as many types of waste generated by the population as possible [2].
Public satisfaction with solid waste management services (SWMS) is an effective indicator that aims to assess the efficiency or performance of services provided by certain operators about consumer satisfaction [3, 4] and allows a comprehensive assessment of efficiency, responsiveness, and effectiveness of services within the framework of limited human, material, and financial resources [5]. This type of evaluation can provide feedback and different specific development directions for policymakers and operators to improve policy and implementation approaches [6].
In addition to analyzing the structure of the waste generated [7-16] by the population or municipal solid waste management policy [17-24], many studies have been carried out focusing on identifying public satisfaction regarding the household solid waste management system. These studies generally focus on carrying out such analysis at the local or regional level [23, 25-34] due to the diversity of management policy implementation methodologies [6, 35-38].
The factors that are analyzed to determine public satisfaction with the municipal waste management service, according to the literature, take into account many elements [39-43]. Different methods were used to determine the level of satisfaction of the population: structural equation model, service quality model (SERVQUAL), and descriptive analysis methods [39, 44, 45]. Some of these studies also involved interviewing the population on the waste management system at the local or regional level, with the conclusions leading to changes in waste management implementation [46, 47].
At the Romanian level, a series of studies have also been carried out with the main objective of analyzing the structure of waste generated by the population [48, 49], implementing the concept of sustainability [50-55] or circular economy [56] under this system. There are few studies involving the use of surveys to obtain information on public perceptions of the waste management system [57-59].
This work aimed to obtain a series of information from the population to identify their perception of the household waste collection system and selectively collected waste in the municipality of Bacau. For this purpose, a survey was carried out and distributed online, and some of the data obtained are presented in this article.
Methodology
Studies on public satisfaction with specific operations carried out by different commercial or state-owned organizations or companies are made feasible by the advancement of software systems and the options presented by contemporary technology advancements. Because of this, studies on specific population segments may be completed more quickly and inexpensively, providing a variety of options for organizing, interpreting, and statistically analyzing data.
The current study involved developing a 20-item online survey using the Google platform. The quantity of items was selected to ensure that all the required features of the study were covered.
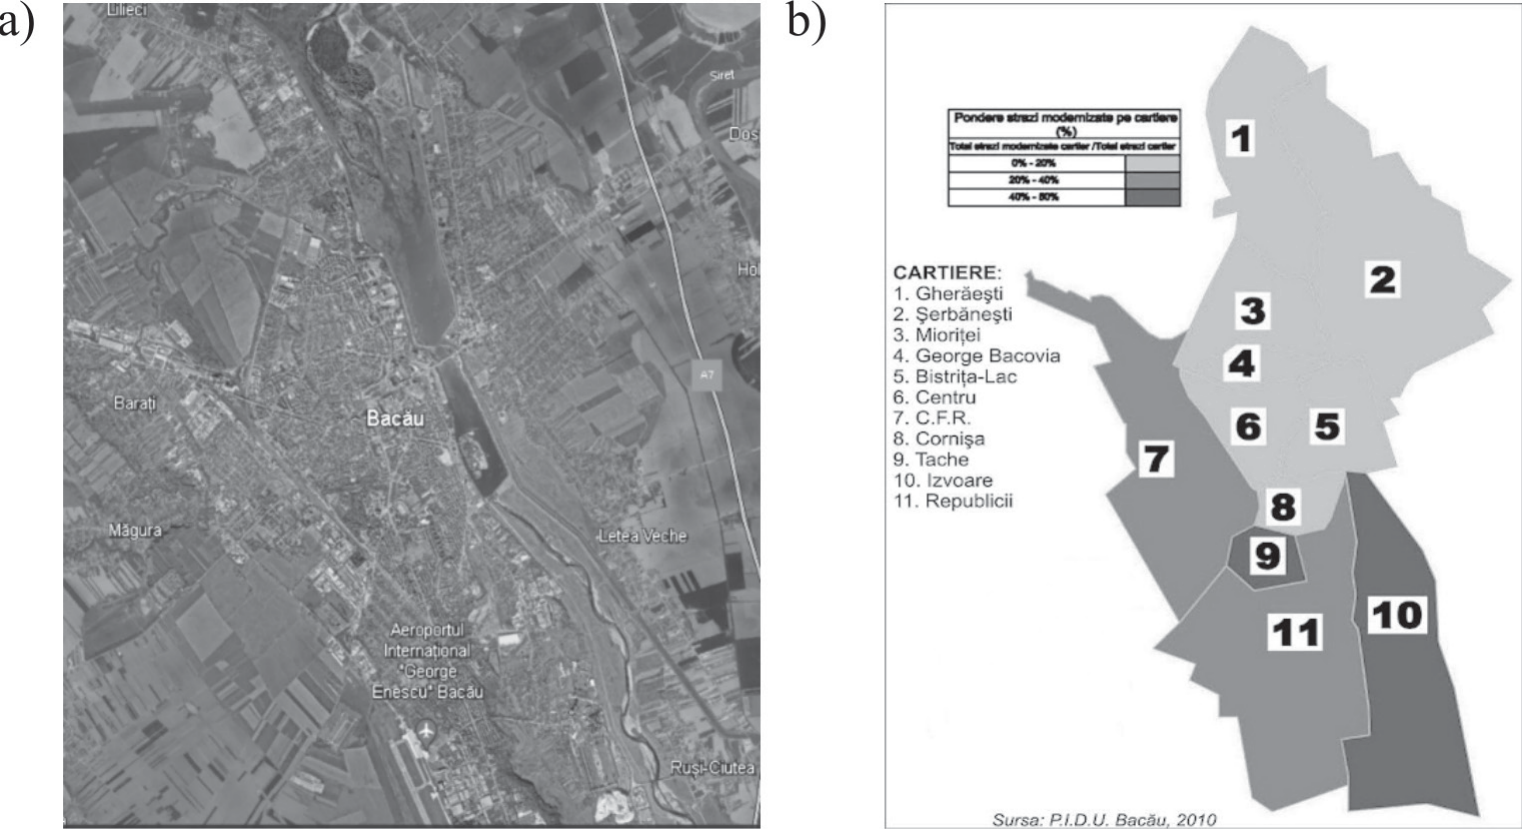
The results of the survey were collected between December 12, 2022, and January 14, 2023, and it was distributed online. Given that the survey was designed only for a single area, dissemination took place with respondent consent throughout the garbage pickup procedure. Since Serbănești, the area under study, is characterized by individual homes (houses), door-to-door garbage collection is necessary. Serbănești is located in the northeastern region of Bacau (Fig. 1). It should be mentioned that because of how the waste is collected, neighborhood residents are required to abide by the waste collection schedule, which specifies separate collection days for mixed household and recyclable waste.
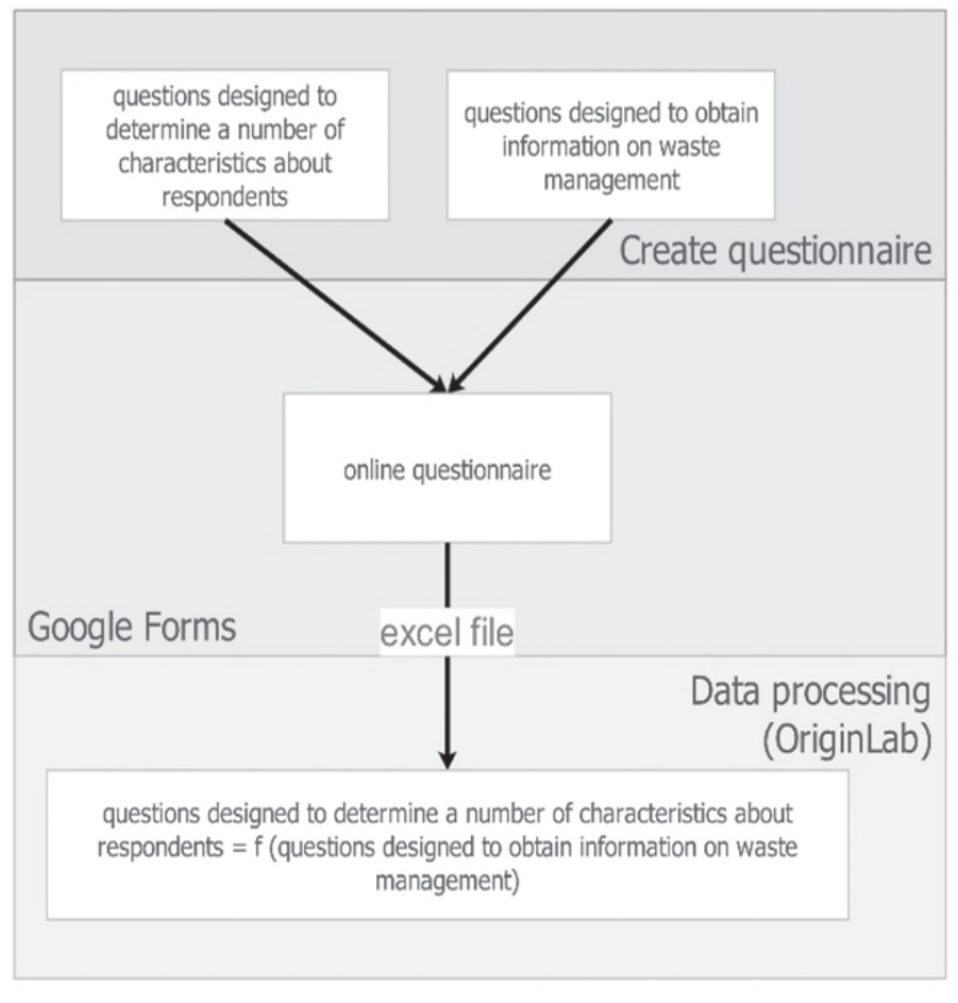
As previously mentioned, OriginLab software was used to analyze the data gathered from the survey used to analyze the waste-collecting system. Fig. 2 displays the working methods utilized for collecting the data and analyzing them.
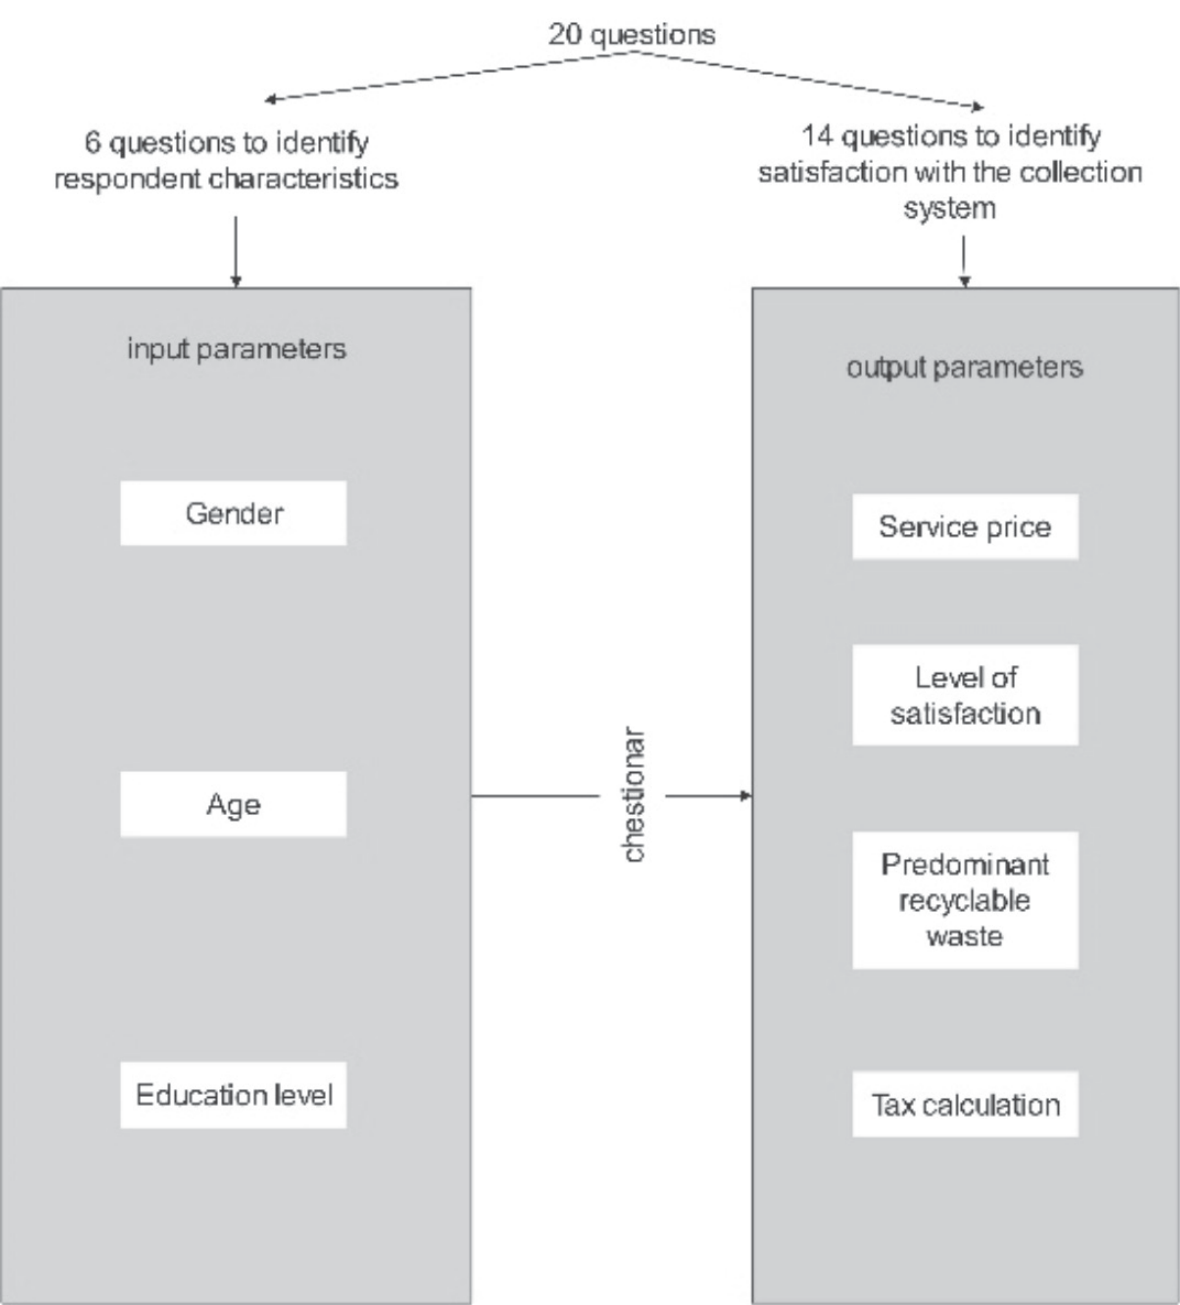
As mentioned above, the initial survey contains 20 questions structured as follows:
– 6 questions aimed at identifying certain characteristics about respondents;
– 14 questions aimed at analyzing the household and recyclable waste collection system.
Not all questions from the survey are analyzed in this article, as indicated in Fig. 3.
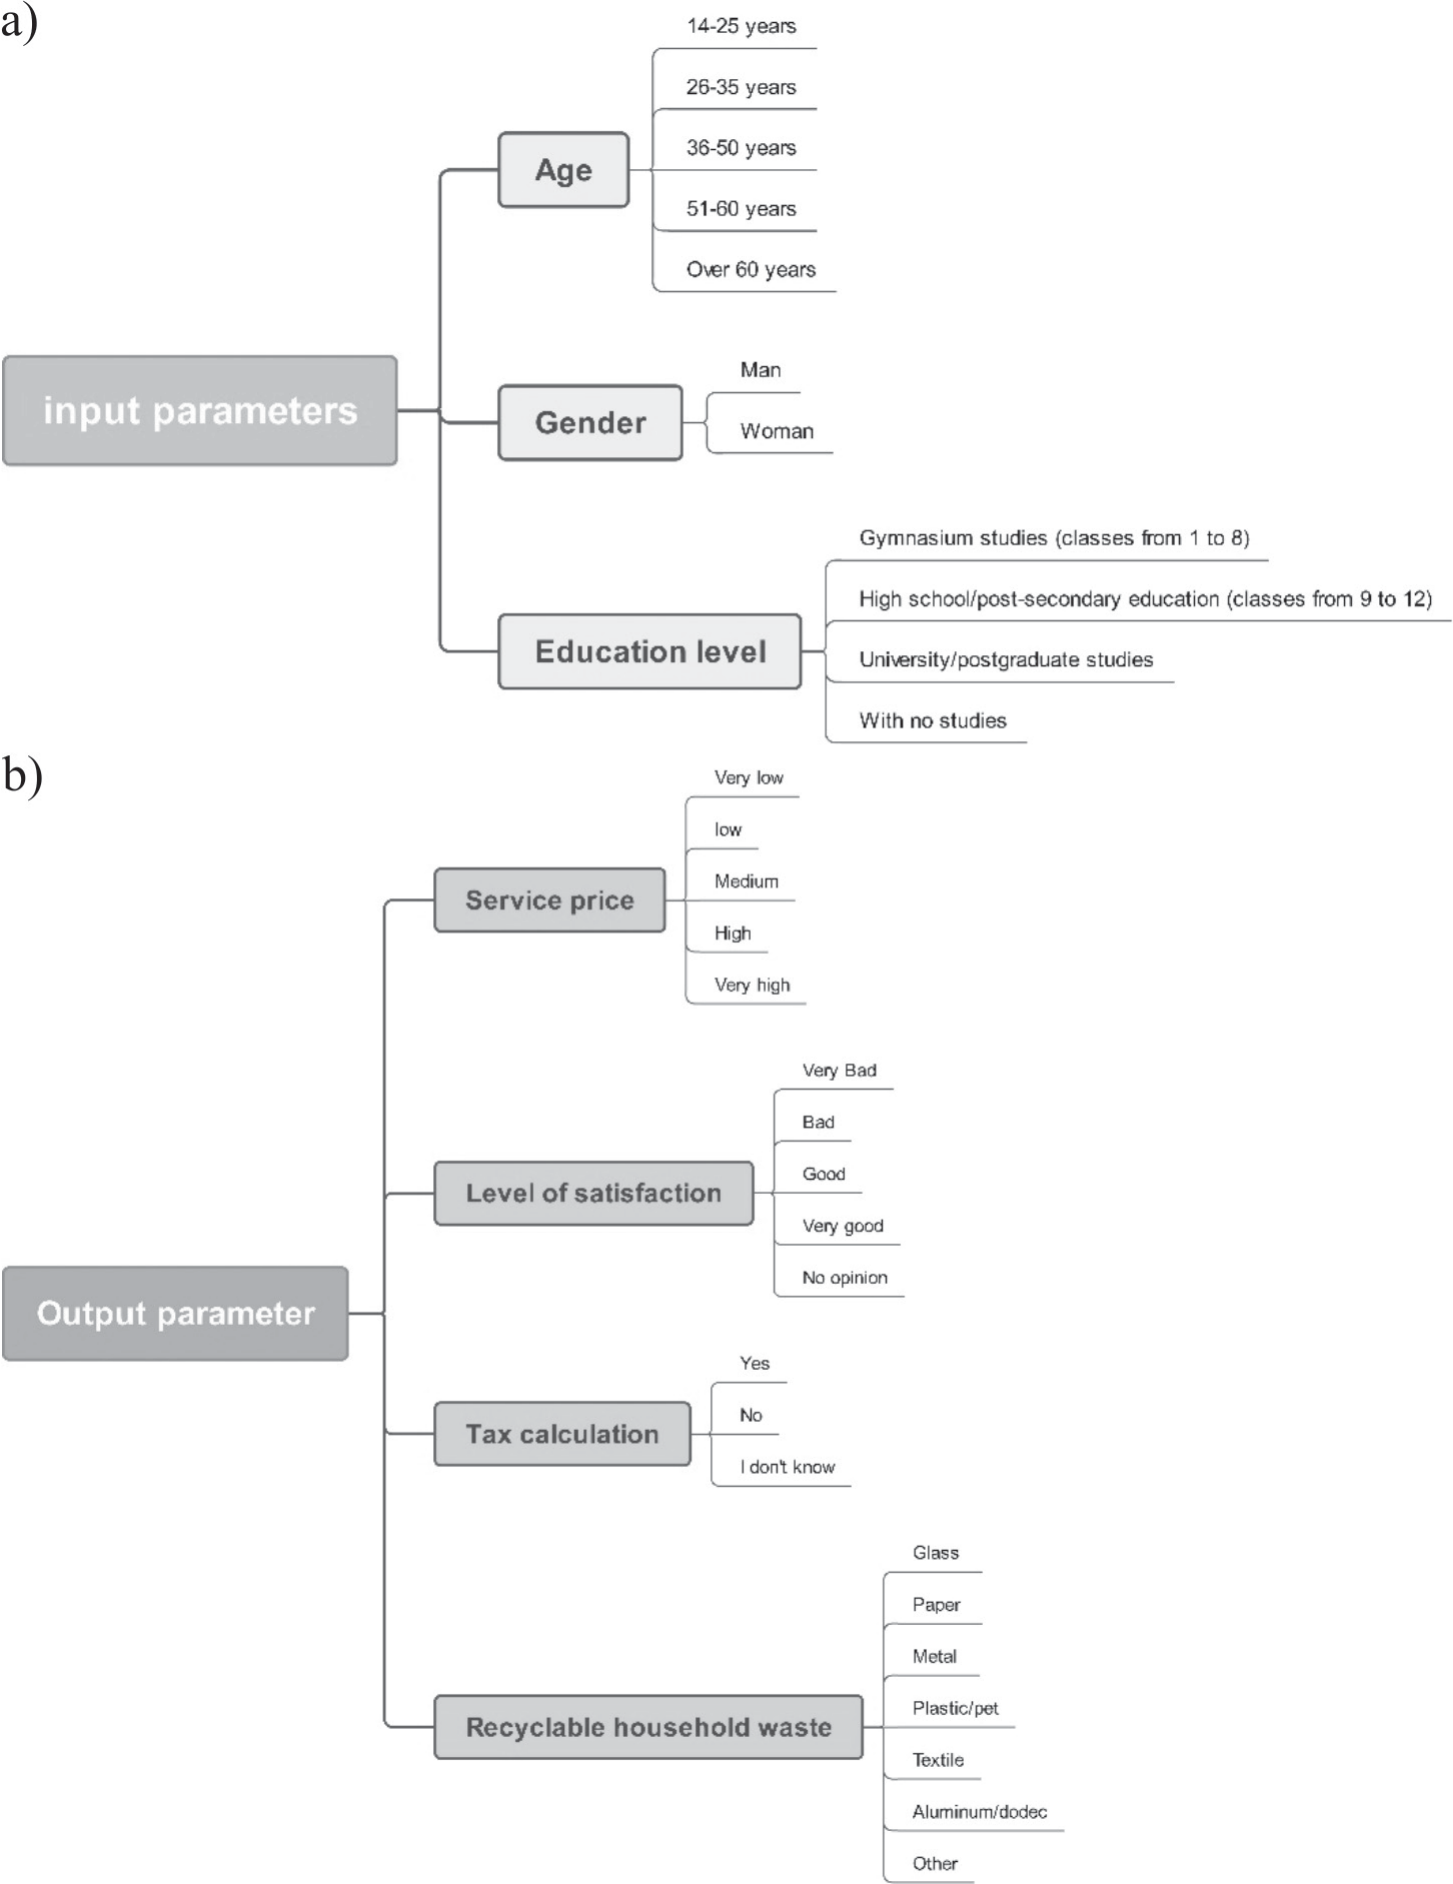
These questions were classified as input parameters (they provide information about the respondents who participated in the questionnaire) (Fig. 4a) and output parameters (they provide information about the perception of the population of the neighborhood under analysis on the waste collection system) (Fig. 4b) of the study conducted.
Results and Discussion
This article analyzes some of the results obtained from a population survey, which focuses on the education level of the 191 respondents participating in the study.
Knowing that the area under study is home to around 2252 households (the questionnaire was made so that just one family representative answered the questions) [62] and taking into account the completed questionnaires (191 surveys) results in an error of 6.7% with 95% probability [63, 64].
The data analysis results are as follows:
– Individual data analysis (Table 1):
a) Table 1 shows the share of respondents by gender. This figure shows that a large number of male respondents took part in the survey, 19 more than female respondents;
b) Analyzing the distribution of respondents by age shows that 23 respondents are over 60 years old, and 54 respondents are between 36-50 years old. The other age groups have a share of 16.7% and 21.5%;
c) Taking into account the level of education of the respondents, it was found that the largest share is represented by those who have a high school education (49.74%), followed by those who have a university education (30.89%). The percentage of those who are uneducated or only completed secondary school is 19.37% of all respondents;
d) Analyzing the respondents’ perception of the current price of waste collection services, it can be seen that 37.7% of the respondents consider it to be of acceptable value, but about 51.83% of the respondents consider the price to be high and very high for this service. Only 10.47% of the respondents consider the price to be small or very small for this service. Here it should be mentioned that the amount of the sanitation tax for the population in 2022 was 15 lei/person/month (this means about 3 Euro/person/month) [65], and the minimum salary was 2550 lei (about 510 Euro) [66];
e) Concerning the level of satisfaction of the population with waste collection, more than 58% of the respondents have a good and very good opinion, and only 33.5% have a bad and very bad opinion;
f) 58.64% of respondents approve of calculating the sanitation tax according to the amount of waste collected, and only 61 respondents disagree, wishing to keep the current calculation method;
– Data analysis by interest groups:
This analysis aims to identify certain correlations between the input and output parameters identified in the study.
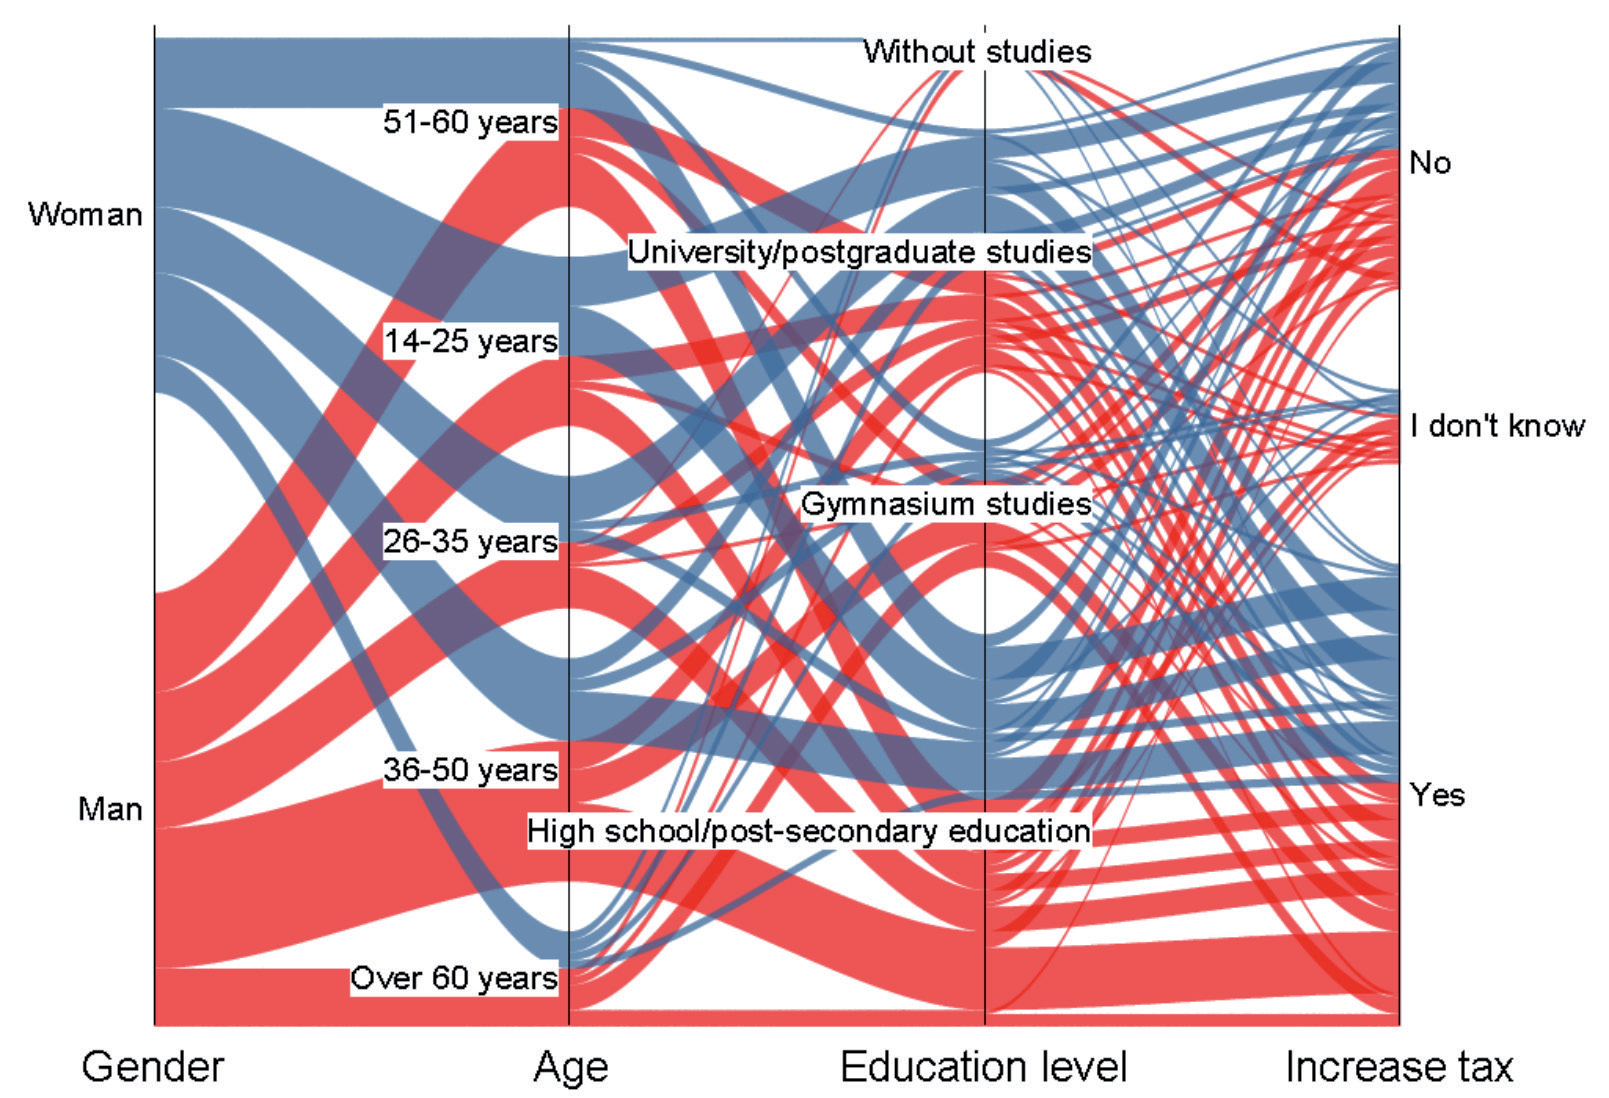
a) Gender-age-education level of respondents. (Fig. 5)
As a result of the analysis, it is found that:
i. For male respondents:
- 18% are between 36 and 50 years old and have a high school education;
- 38% are between 51 and 60 years of age and are based on secondary education;
- 9.5% of people are between the ages of 51 and 60 and have completed secondary school;
- 8.6% are between the ages of 51 and 60 and have finished high school;
- 7.6% of people have completed secondary school and are between the ages of 51 and 60;
For female survey respondents:
- 13.95% of respondents between 14-25 and 36-50 years of educational background are secondary school graduates;
- 13.95% are university graduates and are between the ages of 36 and 50;
- 12.79% of the individuals between the ages of 51 and 60 who had completed high school;
- 12.79% of respondents are aged between 14 and 25 years and 51 and 60 years, with university education as their background;
ii. The highest proportion of men who participated in the questionnaire (Fig. 6a) were those aged 36-50, followed by those aged 51-60. The other age groups have a combined share of 44.76%;
iii. Regarding the proportion of women who took part in the questionnaire (Fig. 6b), it can be seen that the highest proportion is accounted for by women aged 14-25, i.e., 27.9%, followed by those aged 36-50, with a proportion of 23.25%. The other age groups individually have a proportion of less than 20%;
iv. Regarding the level of education (Fig. 6a), it is observed that 55 male respondents have only high school, followed by those who have a university education, 26 respondents, 21 respondents have only secondary school, and 3 respondents with no education;
v. The distribution (percentage) of educational attainment for male and female respondents is the same, with the distribution by number of respondents differing according to the same type of study (Fig. 6b);
This group (Gender-age-education level - considered Input) in the input parameters is included in the following analyses.
b) Input-Service Price: From the analysis of the graphical representation of Fig. 7 (the data also included in Table 2 – this overlapping of data is intended to present as clearly as possible the mode of analysis), the following conclusions can be drawn:
i. Regarding male respondents, 14 respondents aged between 36 and 50 years think that the price of the service is acceptable (out of which 9 respondents have a high school education), and 10 respondents consider that the value of the service is big (from which 3 respondents have a high school education, 3 respondents have a university education and 8 respondents have gymnasium studies). Also, 12 respondents aged between 51 and 60 consider the price of the service acceptable (7 of them have a high school education). Overall, 45.7% of the respondents in this category think that the price of the service is high and very high, and only 13.3% think that the price of the service is low and very low;
ii. Of female respondents more than 50% (more precisely, 59.3%) think that the price paid for this service is high and very high, and only 6.9% think that the price is low and very low. Analyzing by age group structure, we can distinguish the category of 36-50 years who consider the price to be high (with 9 respondents, 5 of whom have a high school education), followed by the group of 14-25 years old, where out of the 24 respondents in this category, 8 consider the price to be very high (5 respondents with a university degree), and 7 consider it acceptable (4 respondents with a high school education and 3 with a university degree). Also, 8 respondents, but in the age group 26-35, consider the price paid for this service acceptable, of which 6 are university graduates;
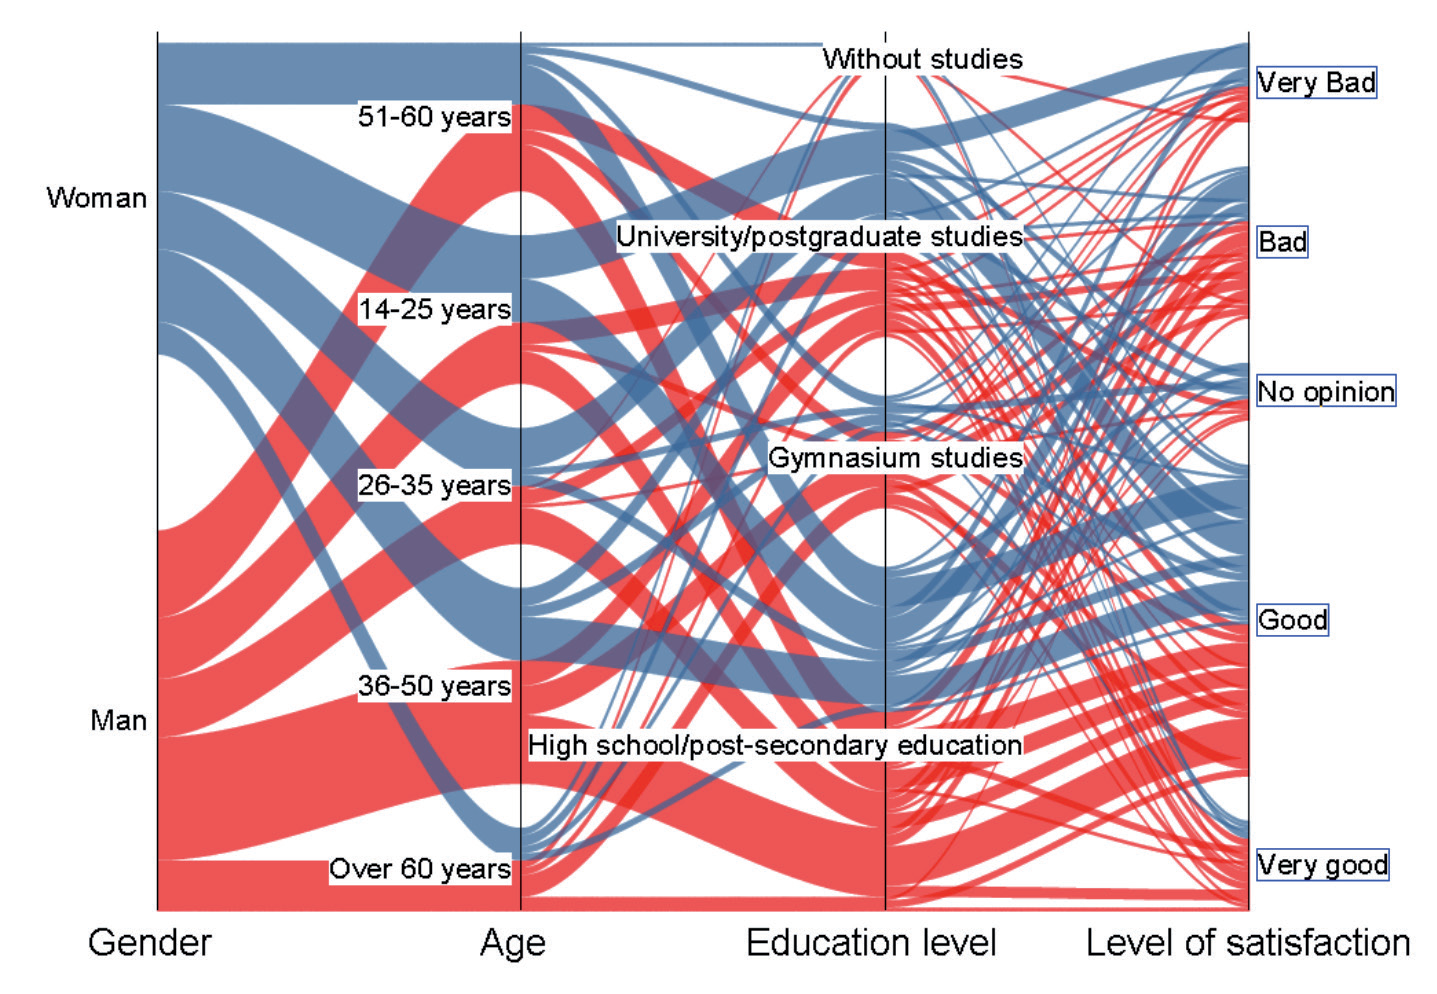
c) Input-Level of Satisfaction: From the analysis of the graphical representation in Fig. 8, the following conclusions can be drawn:
i. Regardless of gender or education, 58% of respondents have a good opinion of the waste collection system, and only 33.4% have a bad opinion;
ii. The distribution of the two principal groups (men and women) shows that:
- 40% of men consider that the existing system satisfies their requirements, of which 44.11% are men in the 36-50 age segment (most of them with high school education, 11 respondents), and 45% of respondents in the 51-60 age segment (more than half of them with high school education). From the category of those who have a very good opinion of the current system, the 25% of respondents who belong to the age category of 36-50 years old stand out, being structured in terms of educational level as follows: 2 respondents have a secondary school education, 3 have a high school education, and 3 have a university education;
- Concerning the female respondents, 56.9% of them have a good or very good opinion of the waste collection system. Analyzing the distribution by age structure, the age groups 26-35 years, 36-50 years, and 51-60 years stand out, with each group having 12 respondents with a good opinion. In the age groups 36-50 and 51-60, the majority have a high school education, and in the age group 26-35, the majority have a higher education;
d) Input-Tax Calculation – According to this kind of data, 58.6% of respondents support this kind of pricing differential. 56.2% of men and 61.6% of women, according to analysis by gender group, have this attitude (Fig. 9);
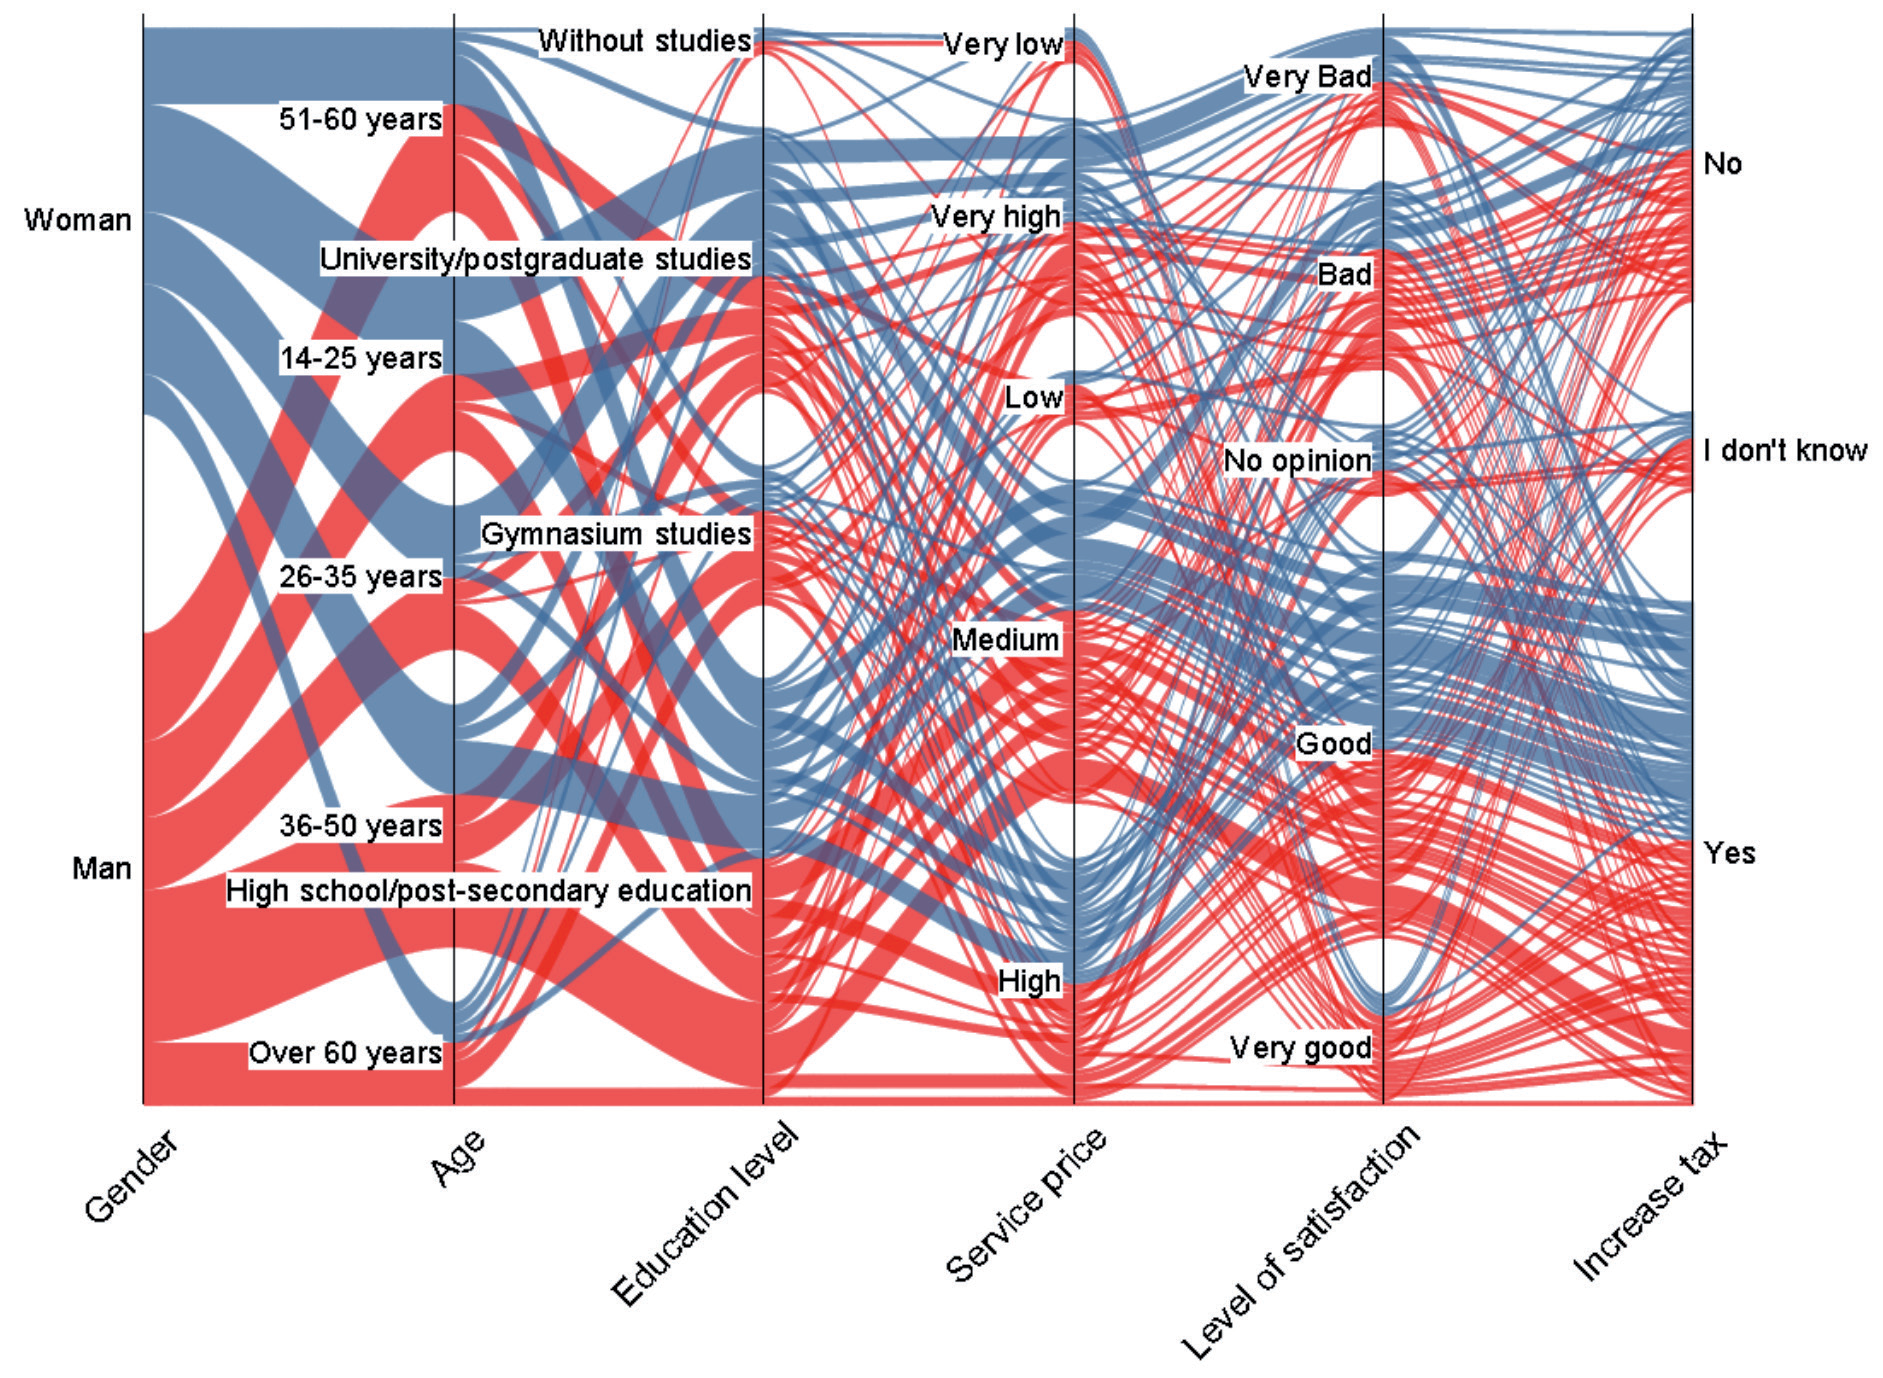
e) General analysis of the data obtained (including data corresponding to input and output parameters) (Fig. 10). Since it is very difficult to describe the data due to the huge number of factors, only those distinguishable groupings will be highlighted below:
- In the group of women aged 14-25 with higher education, 4 respondents considered the price of the service to be very high, with a very bad level of satisfaction, but agreed that payment for the service should be preferred;
- In the case of women aged 26-35 with university education, five respondents were identified who believe that the price of the service for the collection of household and recyclable waste is acceptable, and although they have a good level of satisfaction, they want to pay for the preferential service;
- Two groups of women, both having a high school education but with varying viewpoints, were found in the 36–50 age range. These groups were:
1. one group of 4 respondents find the price of the service acceptable and of a good standard but wish to pay for the preferred service;
2. one group of three respondents considers that although the price of the service is high, they have a bad level of satisfaction, which is why they do not want to pay for the preferential service;
- Within the 51-60 age group, two groups of three female respondents with the same education (high school) were identified as wanting to pay for preferential service, although they considered it to be good. The difference between the two groups is that there are different opinions about the price paid for this service; one group considers it acceptable, and the other considers it high;
- Only one such group – five respondents, aged 36 to 50, with a high school education – was found among the male respondents. They believe the service is good and that the price is reasonable, but they still want to pay for the preferred service.
Table 1.
General values obtained from data analysis.
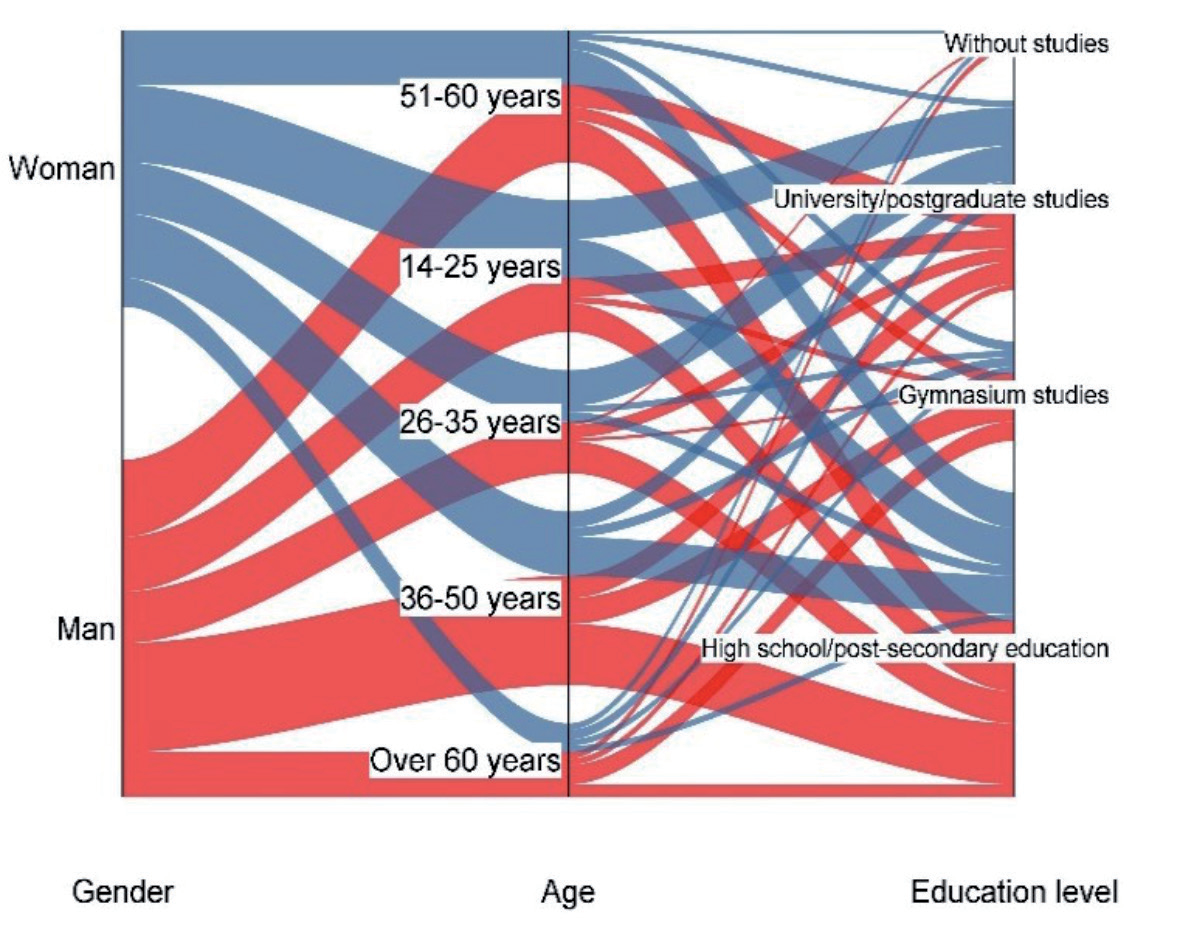
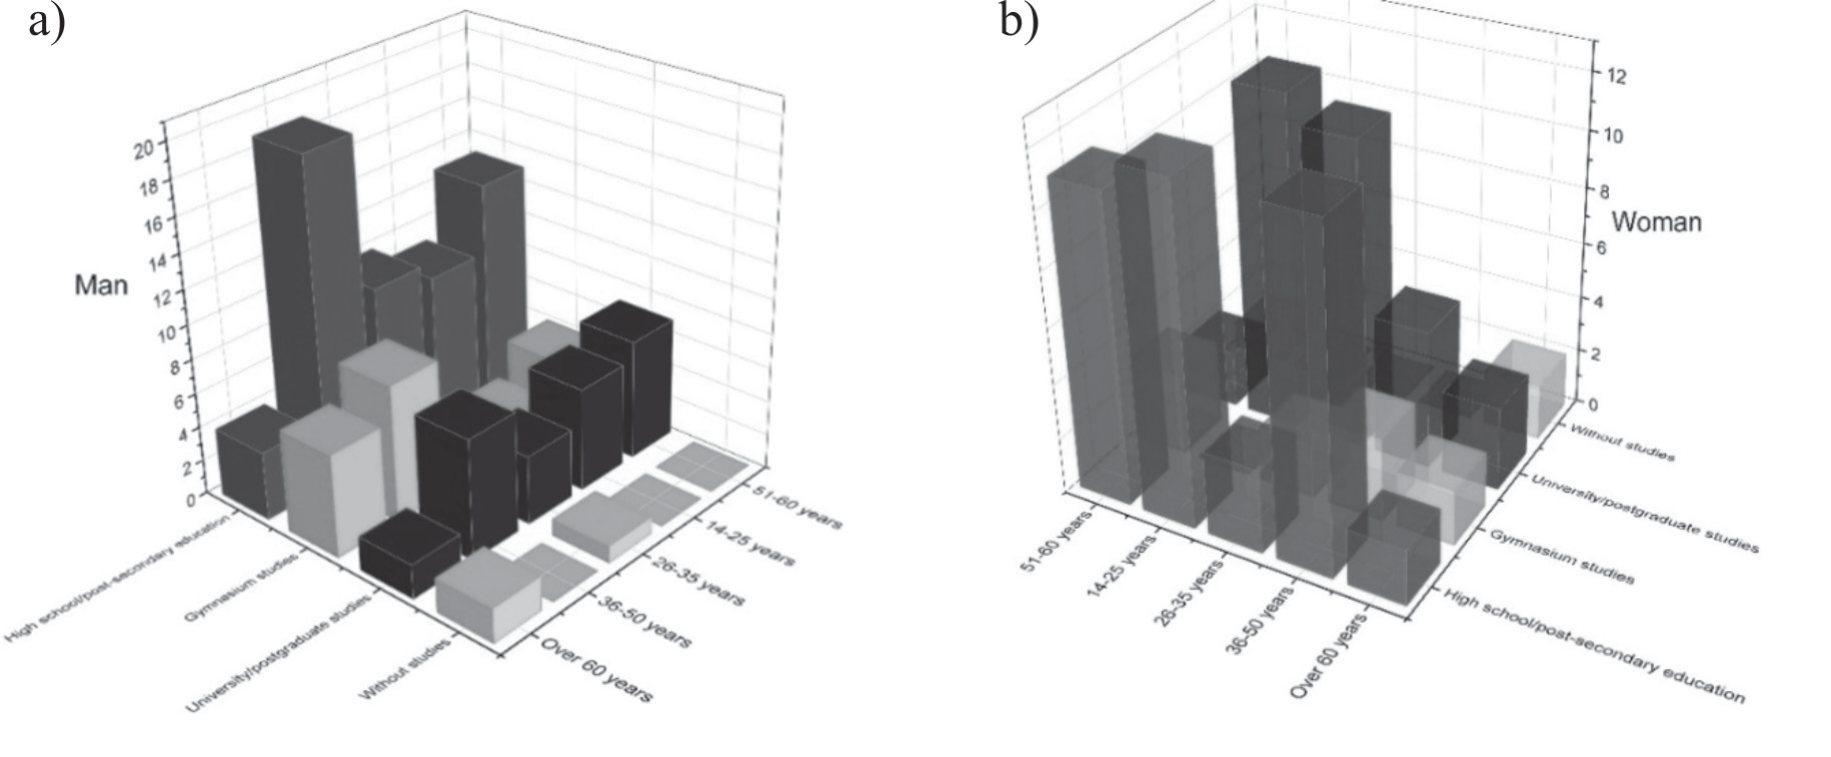
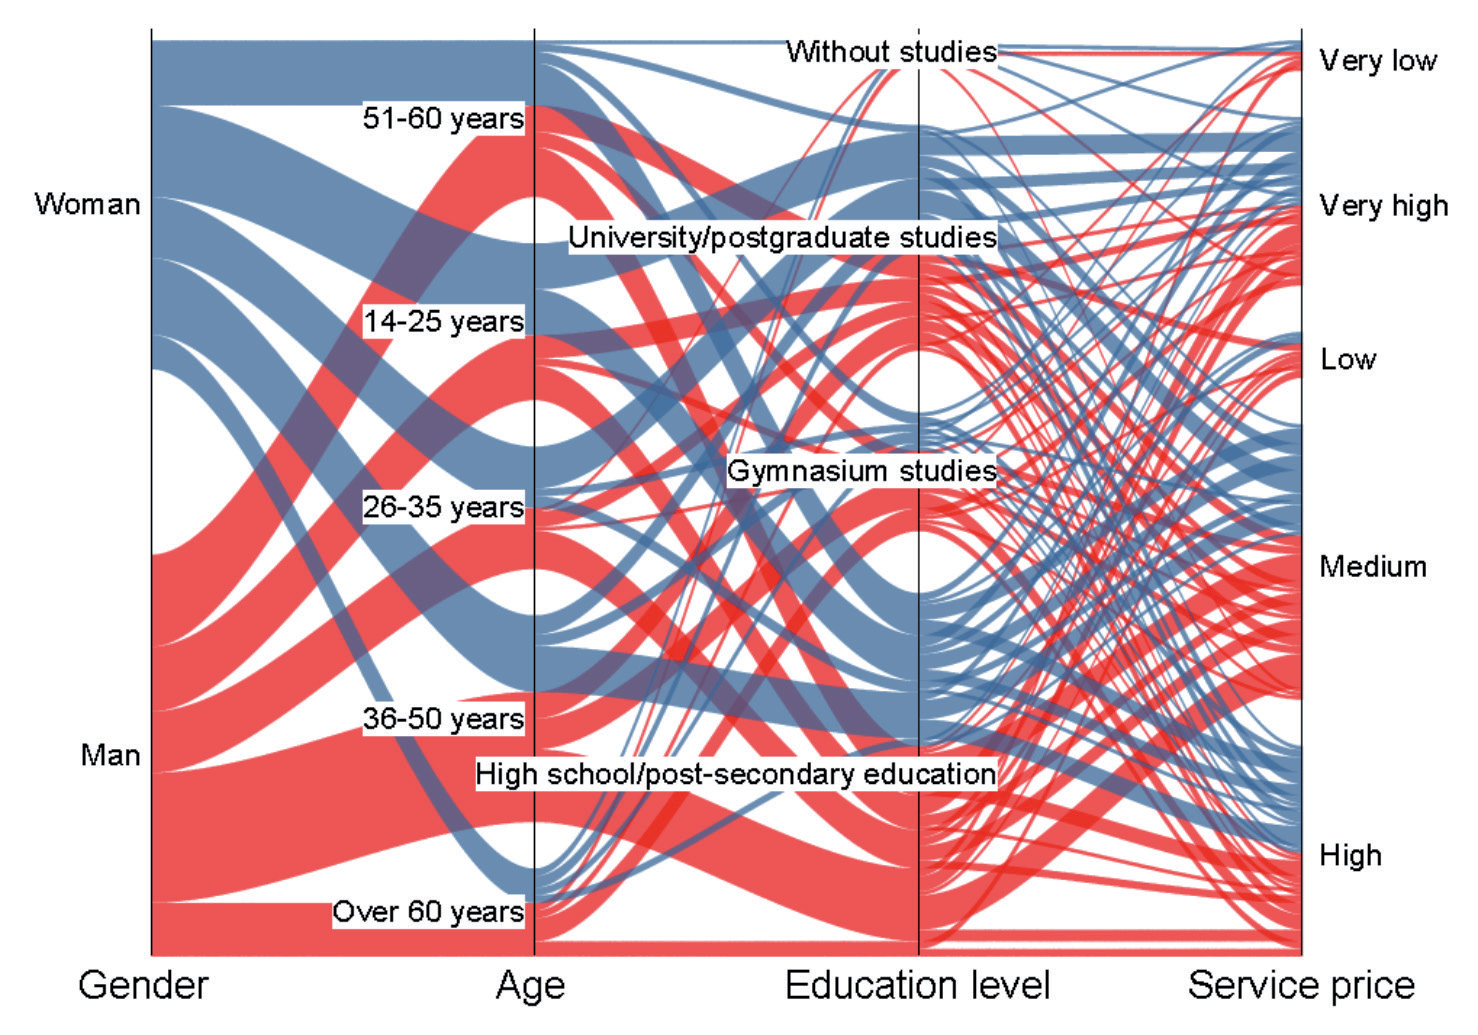
Table 2.
Distribution of results by service price (dates used in Fig. 7).
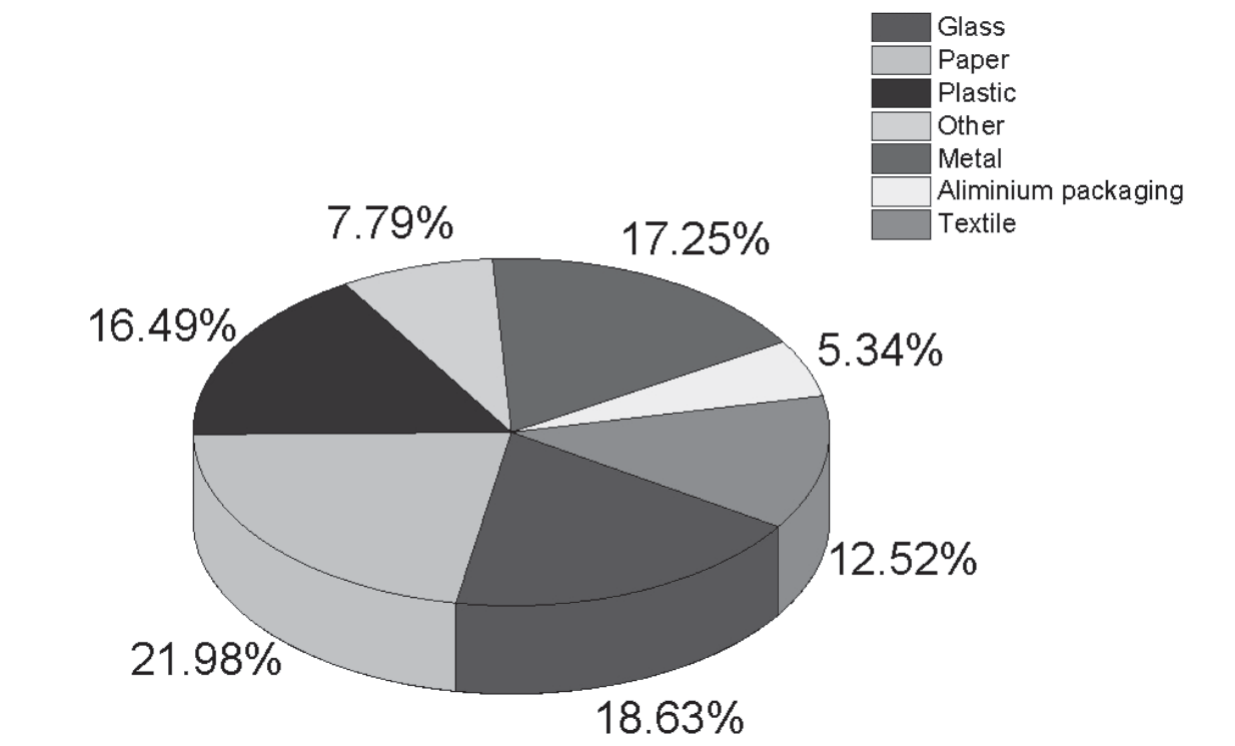
After interviewing the respondents on the predominant types of waste generated, the results obtained were centralized, as shown in the graphical representation in Fig. 11.
Although the collection of recyclable waste is carried out in common (there is no container corresponding to each type of waste; they are put in the same container and collected on specific days), it was desired to know the distribution of the weight of these types of waste, and the following was established:
Statistical Analysis
Several statistical tests were performed, and the results are shown below to determine which correlations existed between the input and output characteristics:
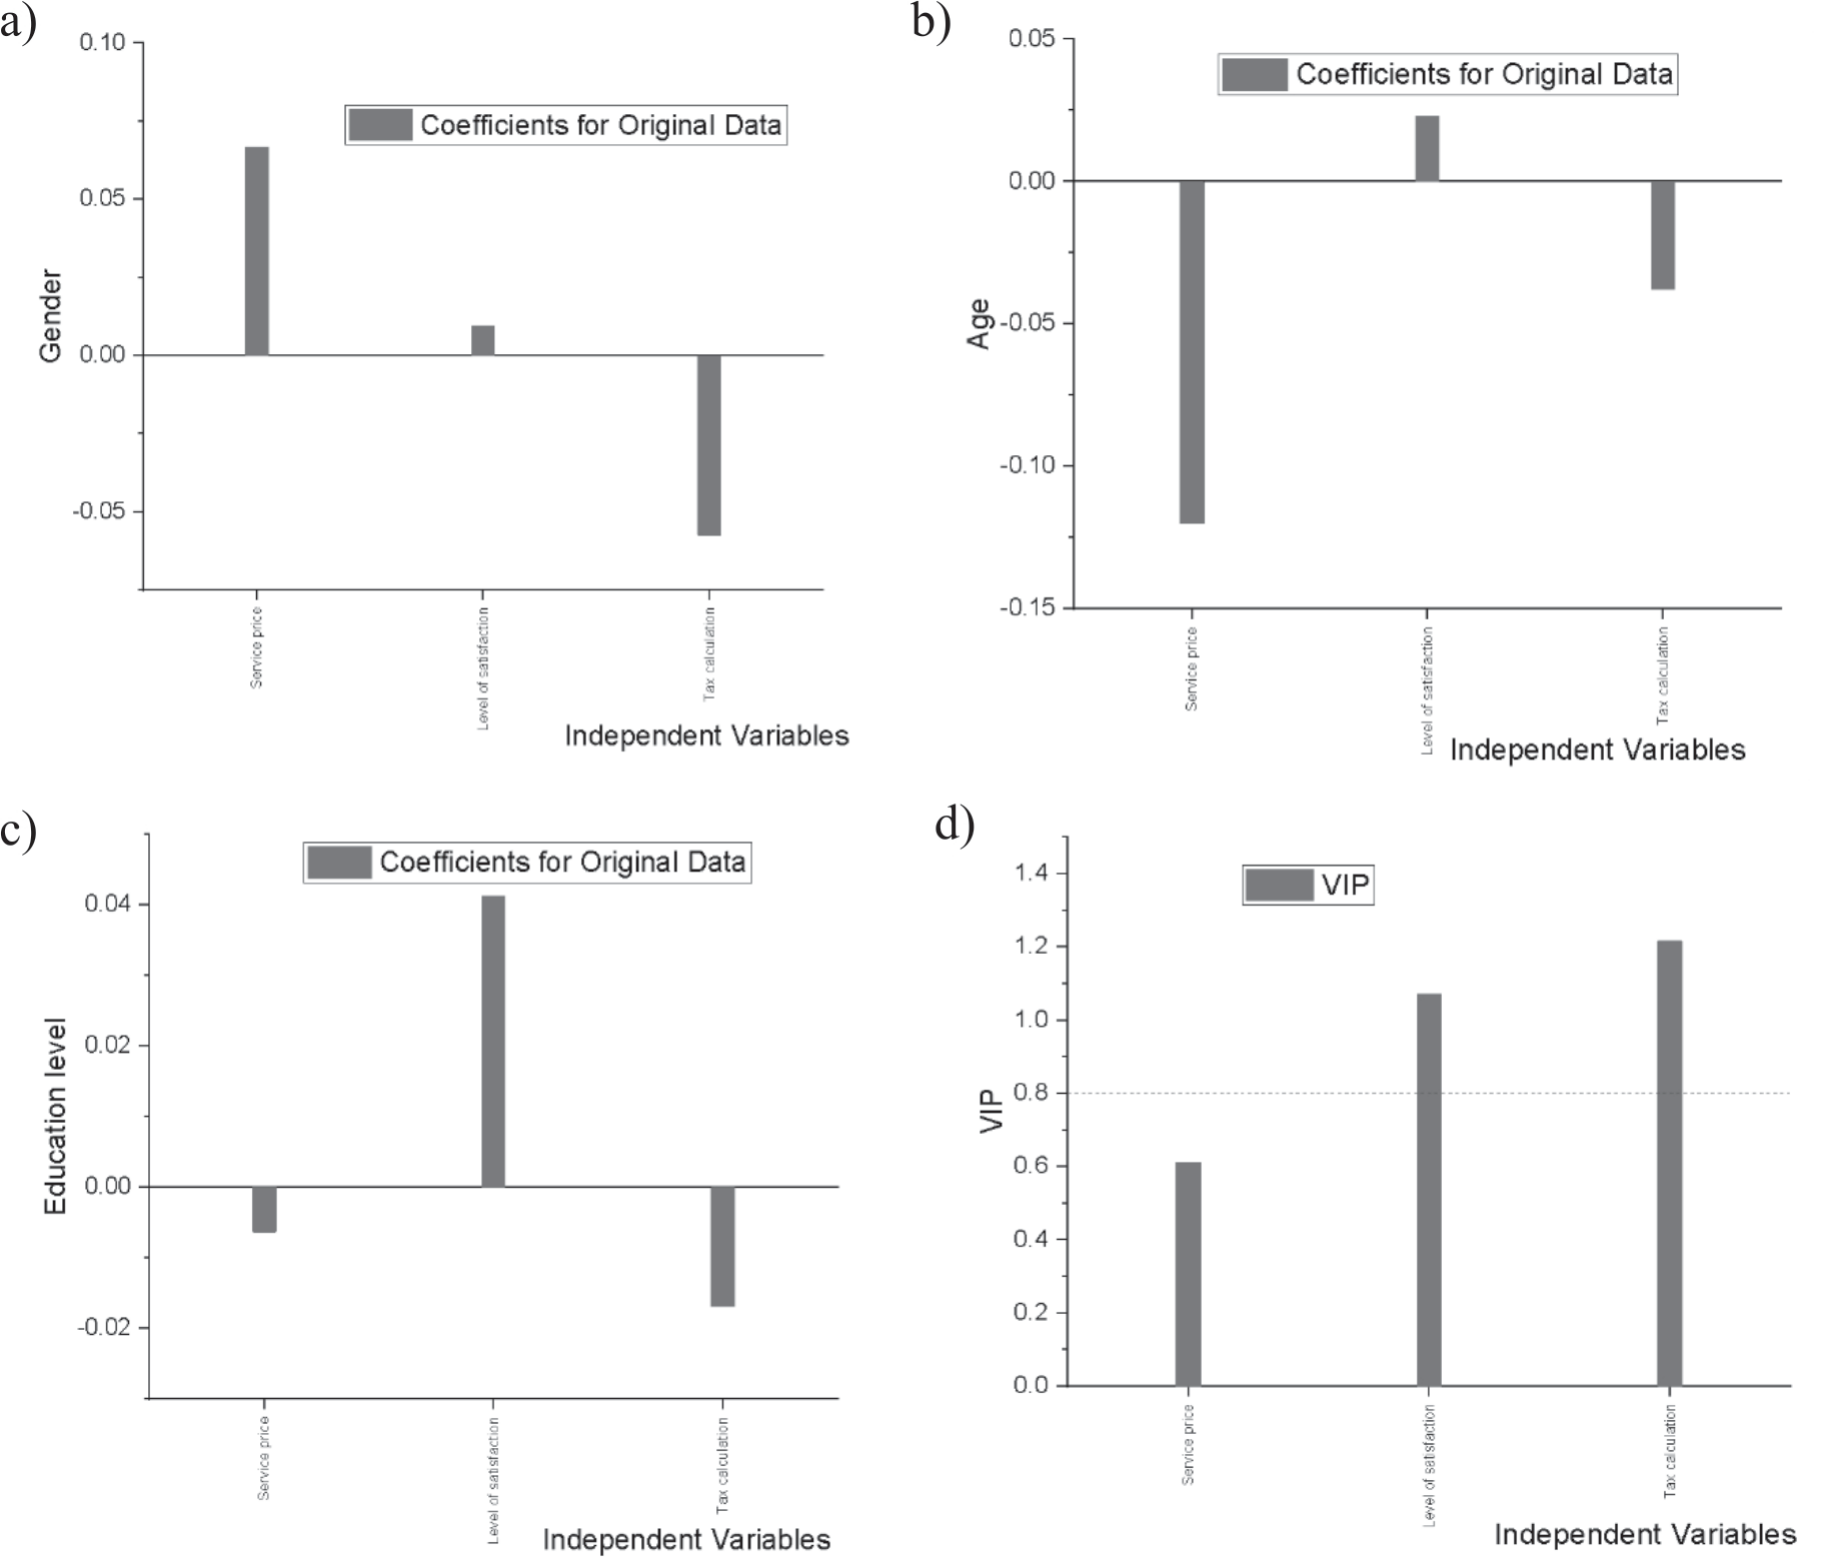
a) By performing a Partial Least Squares Analysis (which was suggested following the determination of the Chi-squared parameter), the following main influences were identified:
i. Regarding the gender of the respondents, it has the same impact on the opinions about the price of the service and the realization of the fee, as based on the calculation (Fig. 12a);
ii. The age of respondents has a major impact on the price of the service (Fig. 12b);
iii. Regarding the level of education, this has a major impact on the level of satisfaction of respondents (Fig. 12c);
iv. The graphical representation in Fig. 12d). shows the overall picture of the importance of the parameters studied, and in our case, these are the level of satisfaction and the calculation of the fee;
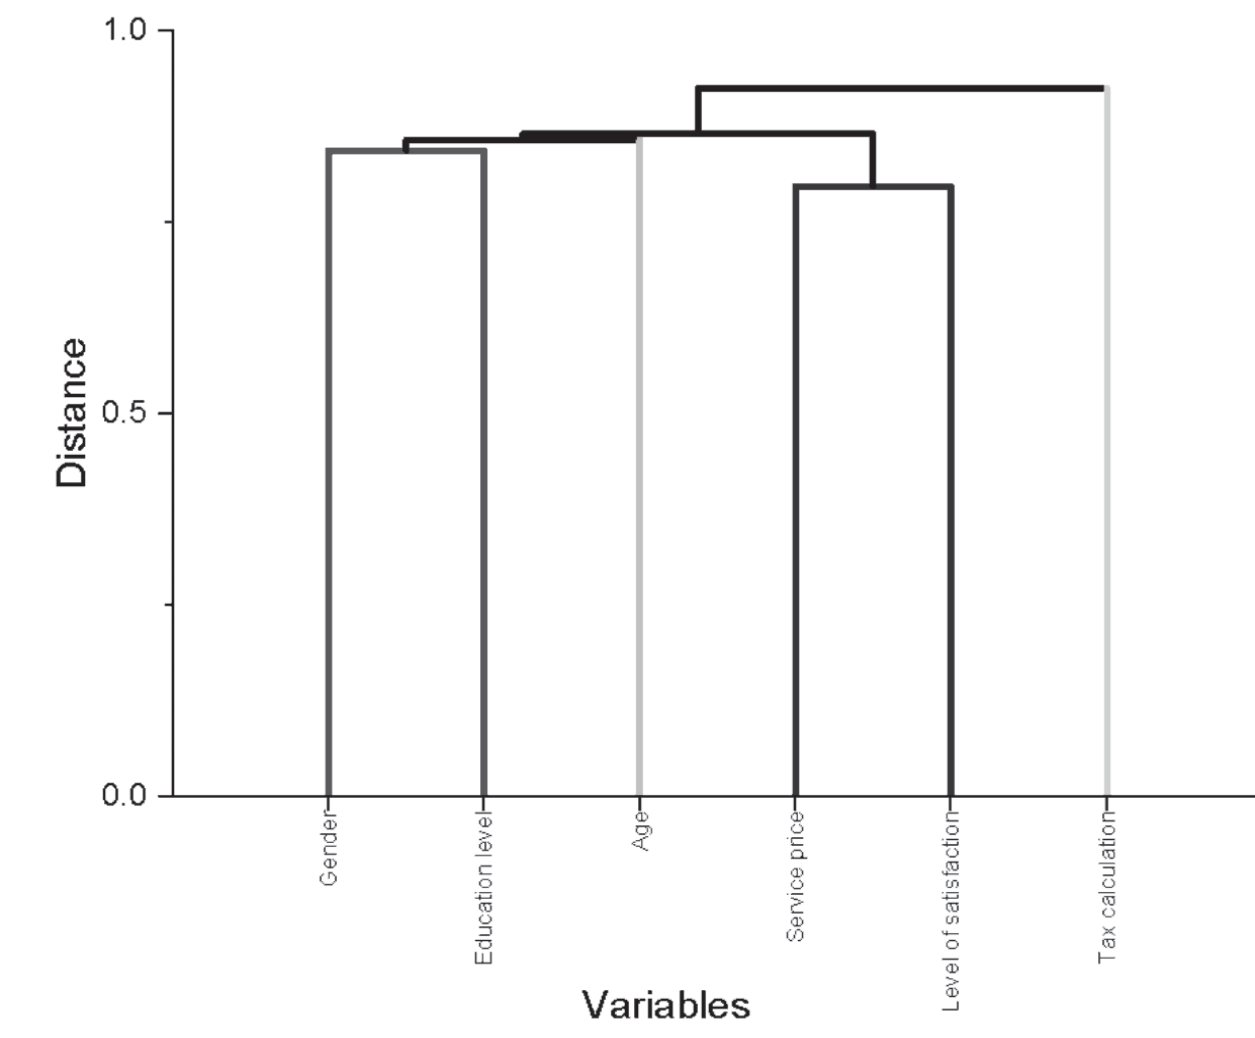
b) Performing Hierarchical Cluster Analysis (Fig. 13), two major and two minor clusters were identified, respectively:
i. The first main cluster comprises the price of the service and the level of satisfaction with the service;
ii. The second main cluster includes the gender and education of respondents;
iii. In the second cluster, the age of the respondent is identified, forming the first minor cluster;
iv. To the first main cluster and the first minor cluster, add the tax calculation.
Conclusions
The need for such a study was necessary because few analyses of the waste collection system based on questionnaires from the population have been conducted, both nationally and regionally.
Relevant to this article is that the study was conducted in only one district, the Serbanesti district of Bacau municipality, where household waste and recyclable waste are collected through the door-to-door method.
The data obtained through the online questionnaire were analyzed, leading to the following general conclusions:
– Of the 2252 families identified in the analyzed area, only 191 completed the questionnaire;
– The highest proportion of questionnaire respondents is represented by male participants, at 54.97%. Within this group, 32.38% are aged between 36-50 years, and of these, 55.8% have high school education, and 24.7% have higher education;
– Female respondents account for 45.03%, with the largest category being those aged 14-25 years, 27.9%, and respondents aged 36-50 years, at 23.25%. The education level for this group is predominantly those who have completed high school, at 46.5%, followed by those with higher education, at 38.3%;
– Regarding the price that the population pays for the waste management service, it was found that 53.07% of the respondents consider it high or very high, 36.59% consider it acceptable, and 10.34% think that the price is low or very low;
– As far as the level of satisfaction with this service is concerned, 58.1% of the respondents have a good or very good opinion, while 33.49% have the opposite opinion;
– On the question that refers to preferential taxation, a large proportion of respondents, i.e., 58.63%, agree with such a measure, and only 31.93% are opposed to such bill;
– A general conclusion that can be drawn from the analysis of the graphical representations is that the respondents are satisfied with the current system of household and recyclable waste collection in the Serbanesti area, as well as the price paid for it. However, the majority of respondents would preferential charging based on the amount of waste generated;
– Since the data under analysis are not numerical, mathematical modeling could not be performed, which is why statistical analysis was utilized. Consequently, two types of statistical analysis were conducted: Partial Least Squares Analysis for many highly collinear factors, and Hierarchical Cluster Analysis, a statistical method used to find relatively homogeneous groups of cases based on measured characteristics. In addition, specific analyses for Multivariate Analysis were performed. Several conclusions could be drawn from the parametric and global groups;
It is proposed that this study be continued by analyzing another district of Bacau in the next stage, where the waste collection is conducted at collection points.

