


Introduction
The problems posed by the exploitation of aquifers in coastal areas are generally delicate, as they combine the notion of quantity with that of quality [1, 2]. They are even more complex, as coastal areas often represent sectors where there is a very high demand for water in general [3-5]. This is due to the intensity of agricultural activities favored by a typically humid and moderate climate and the fact that these coastal regions are densely populated with fairly developed economic activity.
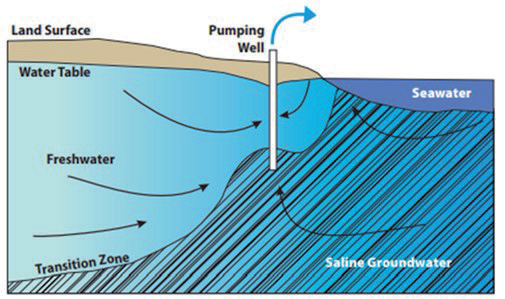
Furthermore, it is recognized that in a coastal aquifer in contact with the sea and naturally in equilibrium, groundwater from rainfall infiltration forms an aquifer flowing towards the sea, which overlays a mass of saline water, forming a wedge penetrating inland (Fig. 1). Any intensive extraction of freshwater from a pumping well will alter this equilibrium state by causing a decrease in groundwater flow and a lowering of the water table. This results in an advance of the saline wedge towards the land, which can reach the bottom of the well in some places and even lead to a change in the direction of flow [6-10]. It emerges that the coastal sectors (northern part) of the studied region, where intensive pumping for supplying populations and industry is observed, constitute areas where aquifers are vulnerable to salt contamination and where aquifers are in direct contact with the Mediterranean Sea.
Literature Review of the Intrusion Phenomenon
Intrusion occurs when saline water migrates into freshwater aquifers due to shifts in groundwater conditions, resulting in the blending of saltwater and freshwater [11]. Naturally occurring, this process involves both inland movements, with surface and irrigation water flowing downward into the aquifer and water from lower formations rising upward, and coastal movements, where the aquifer connects hydraulically with seawater. In coastal regions, freshwater and saline water remain separate due to density disparities, with saltwater flowing beneath freshwater. This phenomenon, documented extensively [12, 13], demonstrates the intricate dynamics of water movement within aquifers, crucial for various environmental and resource management considerations [14-16].
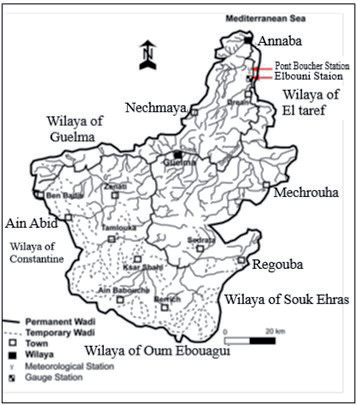
Several authors [17-20] have attempted, through analytical and numerical modeling methods, to describe the phenomenon, predict the position of the freshwater-seawater interface, and forecast changes in piezometric levels and salinity. Characterizing the intrusion phenomenon requires a multidisciplinary approach. The approach involves establishing the geological structure and determining the hydrological and geochemical properties through a sufficient number of measurements and analyses to characterize the sources and origins of salinization, the location of the interface, and the processes driving its spatiotemporal evolution [21]. The coastal confined aquifer studied in this work is located in the Seybouse basin in northeastern Algeria (Fig. 2). The problems of this aquifer result from the imbalance between recharge and intensive exploitation, the significance of agricultural activities, and the presence of highly soluble minerals in its reservoir.
Mechanisms of Marine Intrusion
The transition between fresh water and saltwater occurs relatively abruptly over a certain thickness not exceeding a few meters. The two miscible liquids are thus separated by a zone often likened to a steep interface limiting a saltwater wedge with a slope inclined towards the continent (Fig. 1).
The existence and spatiotemporal evolution of the transition zone depends on both hydrodynamic and geometric factors as follows [22].
– Natural fluctuations in both groundwater level (seasonal variations) and sea level (tides), which cause mixing of fresh and marine waters by displacing the interface;
– Density difference between the two liquids tends to keep the salt in depth;
– Molecular diffusion of salt in freshwater, which tends to decrease concentration contrasts (2.10-9 m2/s for chlorides). It corresponds to physico-chemical dispersion [23, 24].
– Dispersion (mechanical or kinematic) due to flow along the interface; results in the formation of a mixing zone of freshwater and marine saltwater. It is quantitatively expressed by intrinsic dispersion coefficients (longitudinal and transverse);
– Porosity and permeability of the coastal aquifer;
– Geometry of the aquifer;
– Groundwater flow rate is itself dependent on the previous factors. The progressive invasion of the aquifer by seawater depends on the groundwater flow rate, which tends to induce permanent cleaning of the coastal aquifer system.
The Function of Hydrodynamic Factors and Exploitation
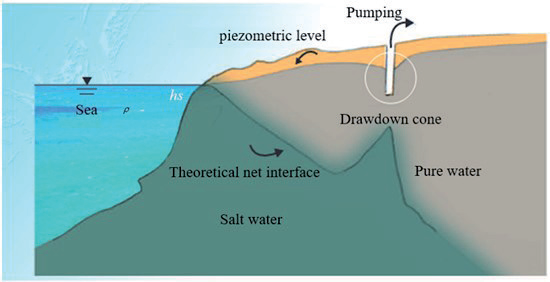
The explanation of the phenomenon of seawater intrusion into coastal aquifers, as expressed by the relationship between the freshwater head (h) above mean sea level and the depth (hs) of the freshwater-saltwater interface below sea level, is credited to Ghyben-Herzberg (1901) (see Fig. 3).
The Ghyben-Herzberg Equation is written as follows:
Where ρ is the density of freshwater (1 g/cm3); ρs is the density of saltwater (on average 1.025 g/cm3); hs is the depth of the wedge below sea level, and h is the piezometric head measured from sea level.
For these density values, the depth of the interface below sea level will be expressed in the form:
hs = 40*h
This Equation shows that depending on the density difference between the two liquids, the position, and depth of the interface are determined by the height of freshwater above the mean sea level (piezometric head of the aquifer). However, this formula should be used with caution as it assumes hydrostatic conditions and a steady-state regime rarely found in nature. There are other formulations for studying marine intrusion phenomena. One example is Todd’s formula (1980), which is derived from Darcy’s law and is expressed as follows:
Where Q is the freshwater discharge flowing towards the sea (m³/s); K is the permeability of the coastal aquifer (m/s); b is the saturated thickness of the unconfined aquifer (m); L is the length of the marine intrusion into the coastal aquifer.
In other words, this equation shows that the extent of the saline wedge penetration inland strongly depends on the permeability of the aquifer materials directly in contact with the sea and the thickness of the water-saturated zone. It is inversely proportional to the flow rate of groundwater towards the sea. It follows that the extent of marine intrusion into the coastal aquifer is significant when the groundwater flow rate is low and when the permeability of the coastal area is high. Conversely, in the case of a low-permeability aquifer with a high groundwater flow rate, i.e., significant hydraulic gradients or a large saturated thickness, the penetration of saline water inland is low or even insignificant.
The preceding equations have shown that the extent of marine intrusion depends on the groundwater flow rate. Indeed, any intensive exploitation in coastal areas above the groundwater reserves reduces the flow rate of the aquifer towards the sea and its outlet, and causes a shift of the freshwater-seawater transition zone inland. In general, the exploitation rate of a coastal aquifer must be compatible with the groundwater recharge rate. An upward movement of the transition zone can occur even if the aquifer is not regionally overexploited. This is a local rise of the interface between the two liquids under the wells so that saline water reaches the screens of the wells: a phenomenon known as “upconing”. This results in significant pollution of pumped water by marine salts.
The objective of these studies is to investigate the mechanism of marine intrusion to characterize the saline intrusion of coastal aquifers and thus highlight the determining factors and means to combat the contamination of aquifers by seawater.
Experimental Procedures
Actually, the issue of marine intrusion is increasingly acute, and highlighting it requires a multidisciplinary approach aimed at estimating the potential impacts of global change on coastal aquifers. Various publications have emerged to address the problem, which can be divided into two main approaches to explaining the phenomenon:
– The use of analytical, geophysical, and modeling methods aimed at locating the interface between freshwater and seawater [25, 26].
– The study of processes and chemical reactions that characterize mineralization and are responsible for the enrichment or depletion of groundwater in chemical elements [27–29].
– In our approach, we undertake the following steps:
– Study the hydrodynamic factors that may play an influential role.
– Determine the geochemical properties through measurements and analyses to characterize the sources and origins of salinization and the factors driving its spatio-temporal evolution.
– Develop cross-plots of major element concentrations with the Cl- ion, which serves as a good tracer of salinity.
– Finally, develop a numerical pollutant transport model.
Results and Discussion
Highlighting of Marine Intrusions into the Studied Aquifers
Hydrodynamic Factors
Coastal areas where aquifers come into contact with the sea (north of the Annaba plain) are the most vulnerable to marine intrusions, which are facilitated by the following criteria [30]:
– Permeability: In the gravel aquifer, the highest permeability values are located along the Seybouse River [31].
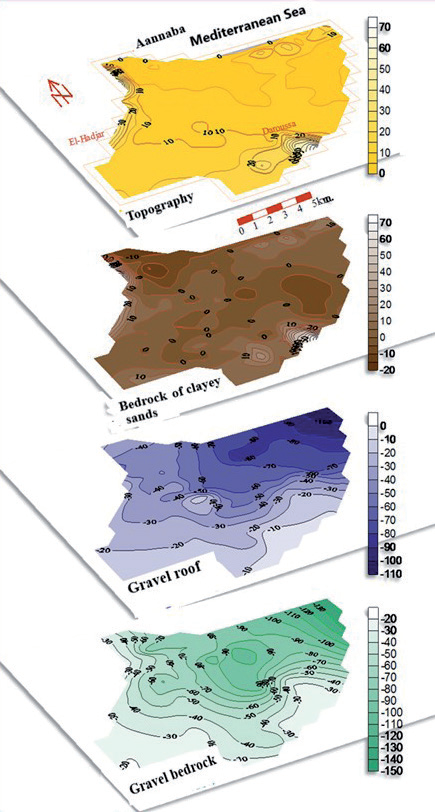
– Thickness of gravel and pebbles: It varies from a few meters on the western border of the system to nearly 25 m to the north along the Ben-Ahmed trench, oriented south-north, and then decreases to less than 10 m on the Daroussa elevation. Between the Boukhadra hill and El-Khous, another level with coarse elements, about 8 m thick, has been located at a depth of 35 to 40 m.
– Geometrical characteristics and dip of the gravels show that the aquifer would extend into the sea several kilometers from the coast (Fig. 4).
– Low hydraulic gradients.
– Intensive pumping in the Salines and Allélick catchment fields caused a significant drawdown of piezometric levels of up to -8 m.
– Decline in piezometric levels: the permanent extension of the 0 elevation isopiestic line caused by pumping reflects a widespread intrusion of seawater into freshwater through a transition zone. Additionally, analysis of groundwater samples shows that electrical conductivity is generally high and remains elevated in the northern part of the study area, marked by a piezometric depression [32]. Particularly noteworthy are the depressions of Salines and Allélick, where elevations can reach -10 m, and groundwater flow is directed from the sea towards the drilling batteries.
Monitoring of piezometric data reveals a generalized decline in levels, leading to the following conclusions:
– The presence of several depressions with elevations below sea level and the general decline in groundwater levels primarily result in an elevation of the freshwater-saltwater interface, which can rapidly reach the bottom of deep wells. We can mention the Allélick and Salines depressions, where levels can exceed 10 m.
– The permanent extension of the zero elevation contour caused by pumping reflects a widespread intrusion of seawater into freshwater through a transition zone.
– The significant drop in piezometric levels, especially during low-flow periods, and the low seasonal fluctuations of the aquifer lead to a reduction in freshwater flows and the penetration of seawater beneath the freshwater masses of the aquifer.
Chemical Analysis Study
The hydrochemical study of marine intrusion may seem straightforward. However, this phenomenon of seawater intrusion is accompanied by other processes that alter the characteristics of the water mixture. This change is due to the imbalance between the aquifer and the water mixture. Indeed, carbonates and clays participate in the dissolution and precipitation of some minerals and in cation exchange, which acts in opposition to changes caused by seawater intrusion. Along with sulfate reduction, these processes are the factors modifying the hydrochemistry of waters salinized by seawater intrusion [33].
Piper Diagram
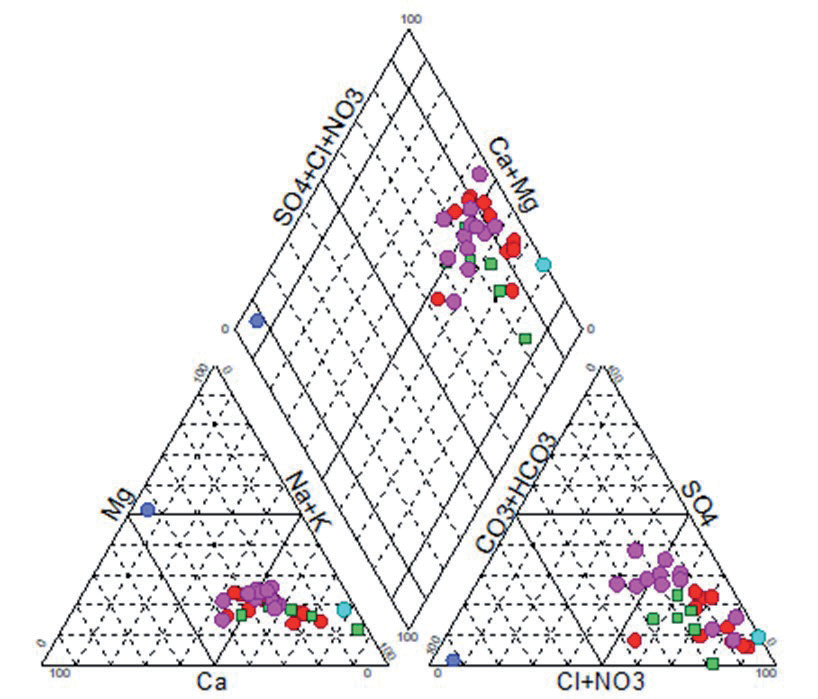
Observing the diagram (Fig. 5), it is noticeable on the anion side that the samples are generally rich in chlorides. We observe that five samples constitute the mixed domain, meaning no single anion dominates. Looking at the distribution of cations, there is a dominance of sodium, accompanied by potassium. It is noteworthy that a considerable number of samples indicate a richness of water in calcium and magnesium. The combination of the two triangles shows that the waters in the study area are sodium chloride, secondarily calcium to magnesium.
Stiff Diagrams
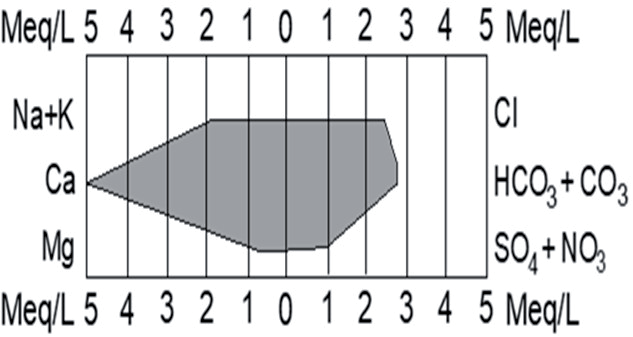
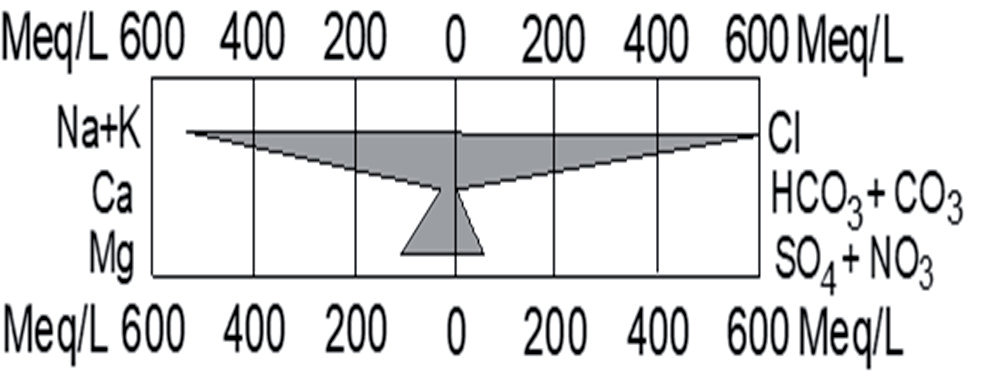
The Stiff representation involves constructing, for each sample, a diagram in the form of a polygon that takes on a geometric shape according to the concentration of the chemical elements considered (Fig. 6.). The differentiation between samples is based on the geometry of the polygon, which provides insight into dominant species and chemical affinity.
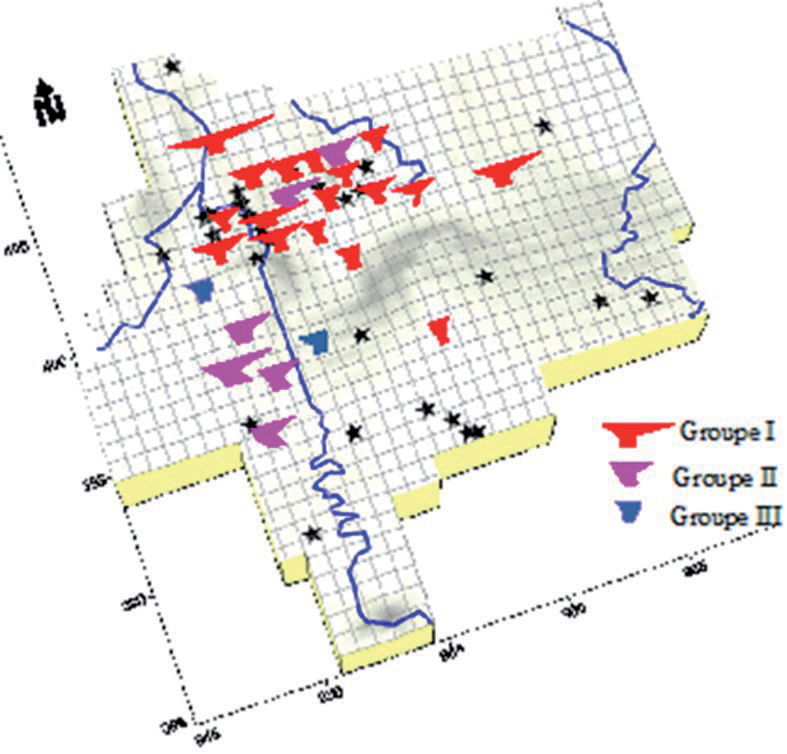
The three axes of the Stiff diagram are, respectively, from top to bottom, NaCl, Ca-HCO3, and MgSO4 (Fig. 7). The Stiff diagrams obtained have allowed the groundwater to be divided into three homogeneous chemical groups: groups I, II, and III.
– Group I, representing nearly 70% of the total sample, comprises water from the coastal sector, at Salines and Sidi Salem, as well as from the El Hadjar and Ben M’hidi regions. The Stiff diagram shape of this group closely resembles that of seawater (Fig. 8).
– Group II, constituting approximately 19% of the total, characterizes samples from the southern sector of the plain.
– Group III, comprising 11% of the total sample, consists of the least mineralized waters.
The spatial distribution of the different groups in the Stiff diagram allows us to understand the origin of water salinization in the aquifer.
Cross-plot Concentration Diagrams
The second method of interpretation used in this study consists of cross-plot concentration diagrams of major elements with chloride ions. Chloride, as a conservative element, does not participate in water-rock interactions and characterizes the origin of water salinity, serving as a mixing tracer [34]. Cross-plot diagrams (Fig. 9) illustrate the relationship between chlorides and major elements (Na+, Mg2+, Ca2+, K+, and SO42-) in water samples collected from different zones within the study area. The arrangement of various points relative to the freshwater-saltwater mixing line can be highly useful in identifying other phenomena associated with the mixing process.
The Na-Cl diagram reveals that representative points from groups I and II lie below and to the right of the seawater-rainwater mixing line. Points to the right indicate freshwater-saltwater mixing without ion exchange reactions, while those below indicate sodium depletion, predominantly governed by cation exchange reactions. The deficit in Na+ is attributed to reverse ion exchange phenomena, where Na+ adsorption and Ca2+ release occur within the aquifer. The CaCl diagram demonstrates a general calcium enrichment compared to the seawater-rainwater mixing line, with varying degrees among groups. Groups II and III exhibit maximum enrichment, while Group I shows the minimum. In the MgCl graph, points below the mixing line signify magnesium depletion, attributed primarily to water-rock interactions. The NO3Cl diagram depicts an increase in nitrates accompanied by chlorides, especially notable in samples from Groups I and II, indicating enrichment due to irrigation water return. These processes, coupled with evapotranspiration, facilitate mineral dissolution and fertilizer dissolution, leading to decreased Ca, HCO3, and SO4 due to precipitation and increased Na, Cl, and NO3 levels [35].
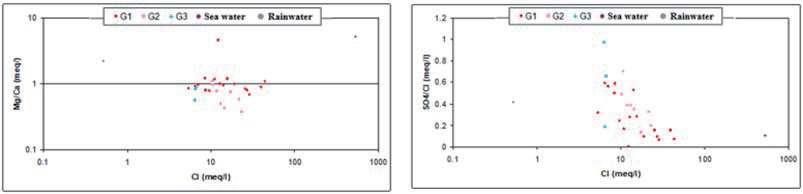
The ratio of Mg2+/Ca2+ increases as seawater content rises in the mixture, mainly due to ion exchange reactions during freshwater-seawater mixing. Group I points show the highest ratios, signifying marine mineralization origin. Some Group II points align with the seawater-rainwater mixing line, confirming irrigation water return. Others in Group II and Group III fall below, indicating low Mg/Ca ratios due to abundant calcium ions from gypsum and calcite. The SO42-/Cl- ratio decreases with increasing seawater proportion in the mixture.
Fig. 10 depicts Group I points with the lowest ratios, confirming marine origin, while Group III points have significant ratios, suggesting mineralization from gypsum dissolution [36].
Evolution of Groundwater Mineralization with Distance from the Sea
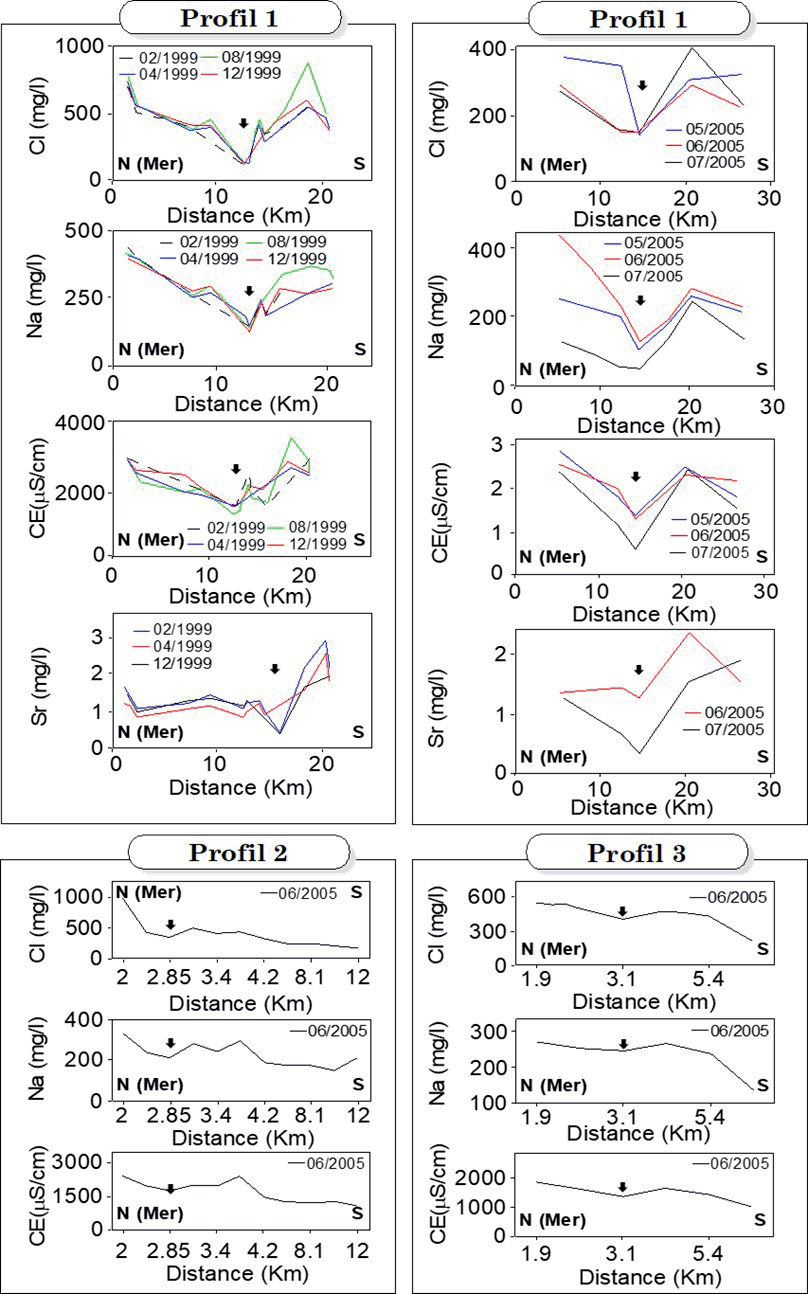
To highlight the influence of distance from the coast on groundwater quality, we revisit the analysis of groundwater samples taken along three N-S profiles perpendicular to the Mediterranean boundary [37].
Fig. 11a-f depict a notable decline in chloride, sodium, and electrical conductivity in the coastal area within the initial 15 kilometers. Chloride values drop from 800 mg/l to under 200 mg/l, sodium from 400 mg/l to under 100 mg/l, and conductivity from about 3500 to 1500 µS/cm. Further south, values rebound significantly for all elements. Elevated strontium levels (Fig. 11g-h) in this region may signify the influence of evaporitic formations on water physicochemical composition.
Fig. 11 Profile 2, composed of water sampling points perpendicular to the sea and situated centrally in the plain, demonstrates a concurrent decline in Cl, Na, and conductivity levels with increasing distance from the sea, reaching about 2.85 km. Unlike the initial profile along the Seybouse, this one exhibits a decrease in values towards the south after content stabilization. This shift is attributed to the absence of leaching input from evaporitic formations carried by the Seybouse. Fig. 11 Profile 3, located east of the first two, mirrors the trend of the second profile but with lower concentrations. Notably, areas inland show high salinities, reaching around 450 mg/l of chlorides within a 5.4 km stretch. Concentrations diminish sharply southward, likely due to similar factors as observed in the second profile. Detecting marine intrusion entails monitoring various parameters (EC, Cl-, Na+, Br-, 18O, etc.) along multiple profiles perpendicular to the sea and parallel to flow lines. In the Annaba plain, we conducted profiles with adequate observation points, whereas in other regions, fewer measurements hindered the creation of representative profiles.
Modeling of Marine Intrusion
In this study, we conducted mathematical modeling of groundwater flow in the Annaba aquifer system to better understand the process of saltwater intrusion. We utilized the MODFLOW code (McDonald and Harbaugh, 1988), which solves the groundwater flow equation, known as the diffusivity equation, using the finite difference method, coupled with the MT3DMS model for hydrodispersive transport simulation. The parameter calculated is the water salinity expressed in chloride concentration (Cl-). This modeling was divided into three distinct phases:
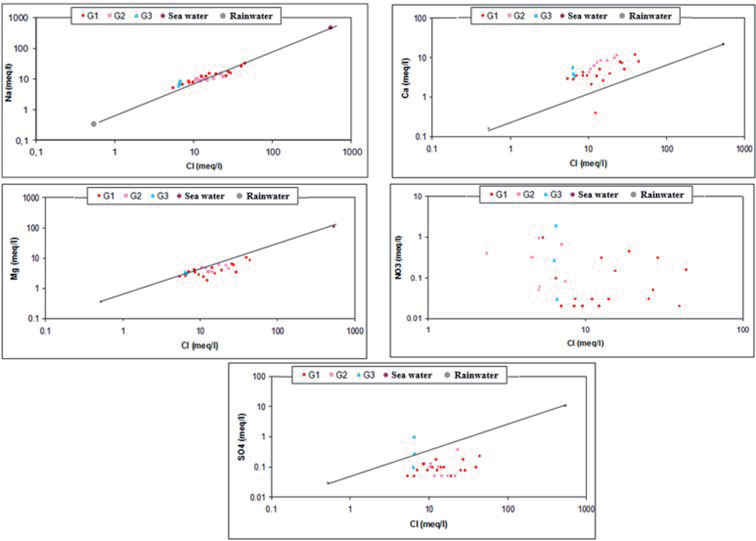
Fig. 10.
Variation of Mg2+/Ca2+ and SO4 2-/Cl ratios as a function of chloride concentrations (mg/l).
Phase 1: Calibration of water salinity under steady-state conditions for the year 1982. The calibrated salinity map is used to initialize Phase 2 of the modeling.
Phase 2: Calculation of salinity evolution from 1982 to 2005, integrating hydroclimatic data acquired during this period. The calculated salinity map for the year 2005 is used to initialize Phase 3 of the modeling.
Phase 3: Predictive simulation over 30 years starting from 2005. The proposed conceptual model consists of 3 layers from top to bottom:
– A shallow aquifer: composed of sandy-clay formations with a thickness reaching 18 m,
– A semi-permeable layer: sandy clay with a thickness of 0 m in the southern part of the plain and 75 m in the north,
– A deep aquifer consisting of gravel and pebbles. Its thickness varies from a few meters to 90 m.
– The discretization of the studied domain is achieved using square meshes with sides of 500 m. The boundary conditions discussed during the development of the groundwater flow model are as follows:
– Imposed fluxes on the upstream boundary, meaning inflow from the South, Southeast, and Southwest boundaries.
– A no-flow boundary on the Northwest borders.
– Imposed Cl concentration of 25 g/l on the northern boundary to simulate the mineral load of the Mediterranean Sea.
– Pumping withdrawals are applied to the relevant meshes.
The values and spatial distribution of permeability and storage coefficients were adjusted using the Modflow hydrodynamic model. Hydrodispersive phenomena were calibrated under steady-state conditions, with a longitudinal dispersion ranging from 10 to 20 m and a porosity of 20% applied to all model cells. Transverse dispersion was set between 0.1 and 0.2 m. In addition to recharge from adjacent aquifers (imposed flux), an effective rainfall of 250 mm was introduced into the model. Under transient conditions, this recharge was calculated annually for the period 1982-2005. To assess the long-term pumping impacts, a 30-year simulation was conducted.
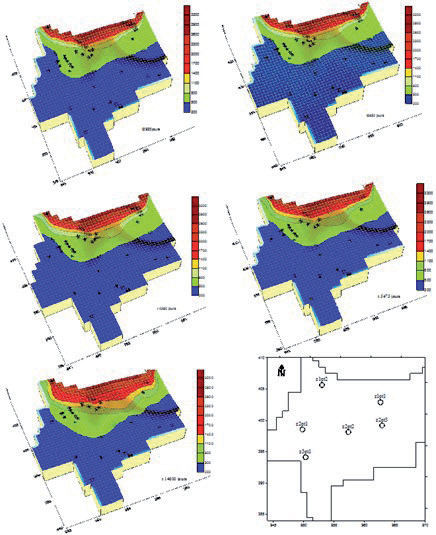
Fig. 12.
Simulation of the saline front: a) 1989, b) 1999, c) 2002, d) 2005, e) 2035, and distribution of observation points for Cl concentration.
For modeling, addressing seawater intrusion involves overlaying the following calculation components:
– A standard freshwater flow model.
– A transport model without chemical reaction (advection-dispersion). In saline intrusion issues, marine salts (particularly chlorides) are considered conservative contaminants that can move along freshwater flow lines.
– A mixing model (Fick’s law): seawater and freshwater are treated as miscible fluids (via molecular diffusion).
Uncertainties introduced by these components can be categorized into three types:
– Uncertainties related to the conceptual model of aquifer functioning. The characteristics of the freshwater flow model (geometry, boundary conditions, and hydrodynamic parameters, particularly permeability and storage coefficient, etc.) significantly influence the validity of salinity results.
– Uncertainties due to incorrect initialization of the salinity model. Salinity measurements used during calibration should correspond to a stabilized hydrodynamic state of the aquifer with a constant freshwater-seawater interface over time (pseudo-steady-state). This can be a significant source of error, especially in heavily exploited aquifers where hydrodynamic rebalancing, manifested by a more or less pronounced shift in the freshwater-seawater interface, can take several years.
– Uncertainties related to numerical dispersion. Introducing density, transport, and mixing into modeling processes introduces nonlinearities into flow equations, which can lead to numerical oscillations resulting in calculation errors and/or convergence problems.
– Calibration of the steady-state model enabled the reproduction of groundwater flows and the calculation of piezometric levels closely matching measured values across the entire modeled area. This step facilitated salinity calibration for the years 1989, 1999, 2002, and 2005 (Fig. 12). For wells in the southern and central sectors of the plain, the model indicates that groundwater exploitation at its current level can be sustained without significant salinity degradation. However, wells located farther north in the plain and those near the coast appear to significantly destabilize the freshwater-saline water balance year after year. According to the hydrodispersive model results from 1989, only a few wells in the northern plain were affected by chloride concentrations ranging from 500 to 800 mg/l, whereas by 2005, these same wells reached chloride concentrations ranging from 800 to 1100 mg/l.
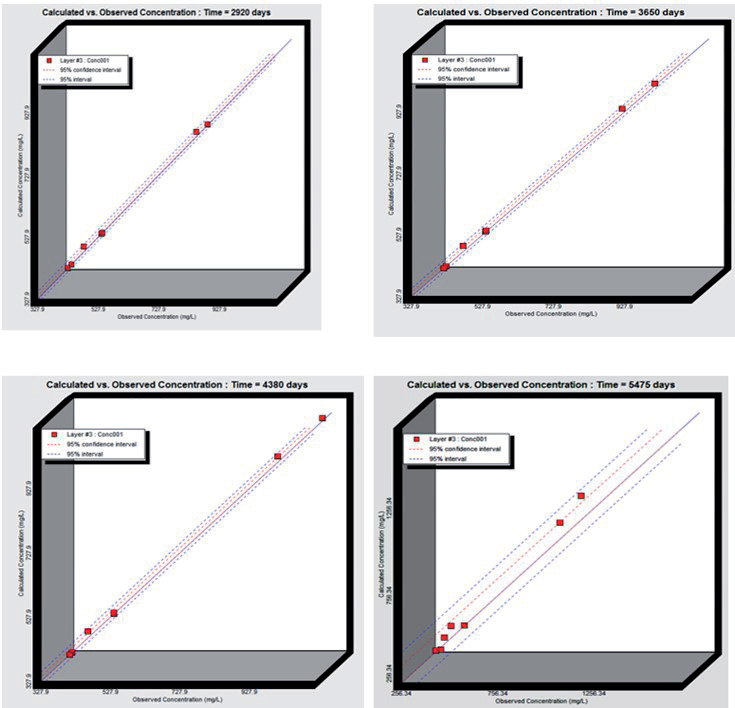
At the end of the salinity calibration, we compared the concentrations calculated by the model with those measured in the field. Fig. 13 illustrates the good fit of the hydrodispersive model for the years 1989, 1999, 2002, and 2005.
For simulating recent periods, water balances help determine the volume of seawater involved in marine intrusion. The table shows the various inflows and outflows in the system after modeling groundwater flow for these four hydrological years. We can distinguish between the aquifer’s input sources:
– Inputs through the boundaries of the modeled area;
– Recharge from the surface;
– Marine intrusion and outflow zones;
– Pumping;
– Discharge towards the sea.
The balance resulting from the modeling indicates that contributions from marine intrusion represent, respectively, for the years 1989-1999-2002 and 2005, 8.97%, 12.13%, 15.31%, and 15.69% of the total inflows into the aquifer. It is noteworthy that, despite the total freshwater sources in 1999 being higher than in previous years, the volume of saline water increased. This reveals the close relationship between the increase in withdrawal volume and the increase in saline water intrusion because, as Table 1 indicates, an increase in withdrawals is recorded from the year 1999 onwards.
Table 1 also shows that from the year when the extraction rates through pumping increased, the outflows from the aquifer to the coast became zero (reversal of flow direction).
Table 1.
Balance of inputs and outputs of the aquifer in 1989-1999-2002 and 2005.
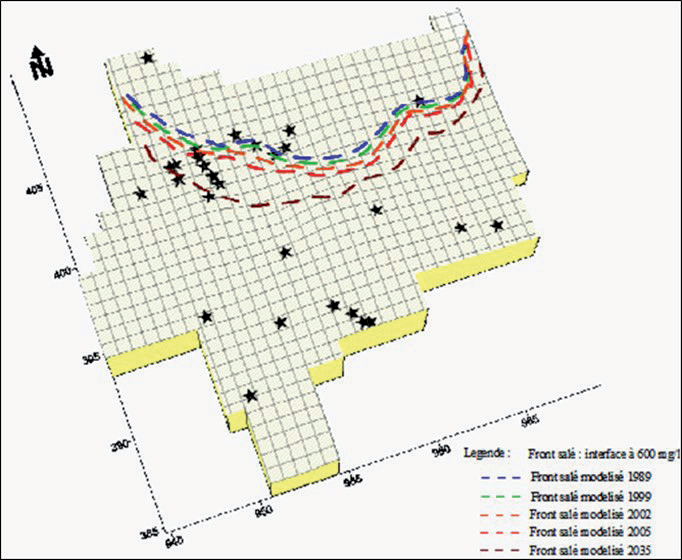
The simulation of the salt front for the year 2035 has shown that the hydrodynamic imbalance persistently continues beyond 2005, assuming the pumping regimes and rates observed in 2005, as well as recharge, remain constant. The dispersion zone would advance inland by about 200 to 300 m in the eastern sector of the plain, 500 m in the central sector, and could reach 1500 m in the west compared to its calculated position for the year 2005 (Fig. 14).
Conclusions
Given the current or future use of groundwater resources from the coastal aquifers in the northern part of the Annaba plain, characterized as sensitive to sea level rise and demographic pressure, water resource management is essential to ensure the sustainability of various uses. Negative impacts on groundwater and ecosystems can become catastrophic if no measures are taken to address the issue. Additionally, analysis of groundwater samples shows that electrical conductivity is generally high and remains elevated in the northern part of the study area, marked by a piezometric depression. Therefore, management is necessary for highly sensitive aquifers to minimize consequences. This management now involves the establishment of a monitoring network with defined alert piezometric levels, requiring adjustments to water withdrawals for specific periods by adapting water needs or using alternative water resources. This groundwater level monitoring network must be associated with a salinity alert network targeting specific aquifer levels, achieved through continuous recording of electrical conductivity either globally or distributed in wells. Forecasts for the year 2035 under the same climatic conditions and current exploitation allow us to predict the extent of the saltwater intrusion front. It would advance inland by 200 to 300 m on the eastern border, by 500 m in the center of the plain, and reach 1500 m further west of the plain.
As urgent solutions to the problem, applicable to all coastal plains in Algeria where water resources are becoming increasingly scarce, we recommend the following practices:
– Moderate groundwater exploitation in vulnerable areas and cease drilling new extraction wells;
– Irrigate using surface water from rivers that discharge significant volumes into the sea, thus preventing illegal pumping from the aquifer by rural communities;
– Implement drip irrigation systems suitable for regions experiencing decreasing rainfall;
– Implement artificial recharge techniques.

