

Introduction
The Cultural and Creative Industries (CCI), which emerged from British cultural theory research in the early 2000s, span culture, creativity, art, and design. These industries aim to provide a variety of cultural products and services, catering to people’s spiritual desires and driving socio-economic growth. The CCI, including sectors like film, publishing, performing arts, gaming, and tourism, drives economic development by shifting traditional industries towards more knowledge-based, innovative models [1-3]. Studies indicate that CCI is a key contributor to economic growth, especially in post-industrial cities. Its practitioners, who excel in analyzing trends, generating creative ideas, and using intellectual property effectively, produce significant economic and cultural value. This activity not only enhances cultural and spiritual experiences for individuals but also supports ongoing economic development. Therefore, robust research into the role of cultural industries in promoting economic growth is essential. To achieve this, increased funding and a focus on innovative methodologies are needed [4-8].
The rapid development of digital technology has positioned the digital economy as a major influence on economic and social advancement [9]. Digital technologies are viewed as essential catalysts that empower and drive innovations in business models within the creative industries [10]. Digitization can not only reduce resource consumption and environmental pollution but also promote innovation and development in the cultural and creative industries. It provides crucial support for achieving sustainable development in the cultural and creative industries. Thus, assessing the effect of the digital economy on the ecological efficiency of cultural industries is a critical task.
Digital technologies are offering new opportunities and challenges for the cultural industries. While digital technology improves production efficiency and provides a richer variety of cultural products, it also introduces challenges like environmental pollution and resource depletion. For example, digital technologies provide powerful tools for creation and production in the cultural and creative industries, offering new avenues and platforms for the dissemination and promotion of cultural and creative works. However, digitalization technologies require significant energy support; for instance, data centers, servers, and other equipment necessitate substantial electricity supply. The production of electricity may lead to increased carbon emissions, potentially adding to environmental burdens. Therefore, identifying strategies for sustainable growth in cultural industries, considering the digital economy, is crucial. The concept of green development in these industries emphasizes environmental protection, efficient use of resources, and reducing emissions. In the case of China, the cultural industries are advancing towards green development, but challenges like high energy use and environmental pollution remain [11]. Therefore, it is necessary to identify effective methods to improve the efficiency of green development in cultural industries from a digitalization perspective.
Upon reviewing relevant literature and conducting an analysis, this paper finds that the digital economy has a mixed impact on the green development efficiency of cultural industries. On one hand, digital technology significantly boosts production efficiency and convenience, broadening the range and customization of cultural products, thus improving the overall efficiency of cultural industries [12]. On the other hand, it leads to environmental pollution and resource waste, which may reduce the green development efficiency of these industries. Green development is a new trend in the development of China’s cultural industry. Many scholars have assessed the efficiency of green development in China. The cultural industries are a promising area within China’s service sector. However, existing literature shows a lack of research addressing the efficiency of green development in cultural industries. Hence, this study makes two primary contributions. First, it examines the spatiotemporal evolution of green development efficiency within China’s cultural industries. Second, it is how digitalization affects the green development efficiency of China’s cultural sector.
Building on this understanding, this paper initially examines the spatial and temporal characteristics of green development efficiency in China’s provincial cultural industries. Following this, it investigates the influence of the digital economy on the improvement of green development efficiency in the cultural sector. The paper concludes by offering recommendations for augmenting the efficiency of green development in the cultural industry within the digital economy framework.
Literature Review
In the context of increasing globalization and the rise of the knowledge economy, the cultural and creative industries have become a significant driver of economic growth. This has led to a growing interest in research related to this field [13-15]. Examining the efficiency of the cultural and creative industries is a complex and multifaceted task, requiring analysis from various angles and dimensions [16-19].
The cultural and creative industries have seen considerable growth recently, becoming an important part of the national economy in many countries and regions. Accurately measuring their efficiency has attracted attention in both academic and industrial circles [20, 21]. Various researchers have utilized different Data Envelopment Analysis (DEA) methods to assess the efficiency of cultural and creative industries and their components within specific countries or regions. For instance, Lin [22] used the Fuzzy Delphi method for managing input-output variables and applied DEA to evaluate the efficiency of cultural and creative industry parks in China. De Jorge-Moreno [23] utilized the meta-frontier DEA method to calculate the comprehensive efficiency index of the cultural and creative sectors in several European cities in 2017. Extending this line of inquiry, Li [24] employed a three-stage Data Envelopment Analysis alongside stochastic frontier analysis, assessing the operational efficiency of 56 publicly listed cultural and creative enterprises in China. However, with the increasing emphasis from both the government and the public on energy conservation and emission reduction in production and daily life, green development in the cultural and creative industries is also receiving more attention from relevant authorities and researchers. For instance, Zhang [25] discussed the impact of green financing in the cultural industry on the green growth trajectory of 32 provinces in China from 2010 to 2021. Hu [26] analyzed the impulse response relationship between tourism development and green development efficiency in the Yangtze River Delta region from 2000 to 2018, as well as the impact of tourism development on green development efficiency.
The efficiency of the cultural and creative industries is shaped by several key factors, as revealed in recent research. Studies focusing on industrial agglomeration, such as those by Černevičiūtė [27], Yu [28], Chi [29], and Chen [30], show its significant influence on the efficiency of cultural industries in various contexts. Complementing this view, Bellini (2015) examined the impact of innovations in information and communication technology on these industries in Europe, revealing a different aspect of efficiency drivers. Similarly, the influence of public policies was explored by Kaymas [31], who analyzed how Turkey’s cultural policies relate to the sustainable development of creative industries.
Lee [32] contributed to this discourse by evaluating Taiwanese government policies aimed at supporting cultural and creative industries, offering a governmental perspective on efficiency enhancement. In a more recent study, Yang analyzed the influence of marketization on resource allocation efficiency in Chinese cultural enterprises, adding a market-oriented dimension to the discussion [33]. The necessity of digital transformation as a means to improve efficiency was highlighted by Lu [34], emphasizing its relevance in the digital economy era. Černevičiūtė (2019) proposed a balanced approach to supply and demand in regional CCIs to achieve sustainable development, suggesting a strategy focusing on market equilibrium [27]. These diverse research strands collectively indicate that technological innovation, policy intervention, and market orientation are instrumental in enhancing the efficiency and sustainability of cultural and creative industries.
The unprecedented growth of information technology has rendered digitization a key characteristic of our era. The green development of the cultural industry, a significant sector in the global economy, is essential for promoting sustainable development [35]. However, the relationship between increased digitization and the cultural industry’s green development is still an open question.
The level of digitization refers to the extent to which information technology, such as big data, cloud computing, and artificial intelligence, is used to digitize the cultural industry [36].
Research in this area can generally be classified into three types: studies examining how digitization technology fosters green transformation and resource efficiency in the cultural industry [37]. research developing evaluation indices for digitization level and green development [38]. and analyses of how policy and legal frameworks impact the application of digitization technology in the cultural industry’s green development [39].
Most studies posit a positive effect of digitization on the green development of the cultural industry, suggesting that digital technology can effectively foster green transformation and resource efficiency while reducing pollution. Nonetheless, there are limitations in the current research, particularly in assessing the green development efficiency of China’s cultural industry with a focus on carbon emissions. Therefore, this paper constructs a provincial indicator system to reassess the green development efficiency of China’s cultural industry and provide policy recommendations in the context of the digital economy.
Materials and Methods
With the rapid development of cultural industries around the world, efficiency measurement has become a key area of academic inquiry [40]. Current methods primarily focus on input and output metrics but often overlook slackness in the input-output relationship. This gap is particularly evident in traditional DEA models, which emphasize the economic efficiency of anticipated outputs while disregarding unintended outputs such as energy consumption. This can result in inflated efficiency estimations and misrepresentations in the efficiency analysis of cultural industries.
Super-SBM Model with Undesirable Outputs
The Super-Efficiency SBM model, developed by Tone in 2001, incorporates slack variables, overcoming the shortcomings of traditional radial DEA models. This method also facilitates the ranking of decision-making units, gaining popularity in efficiency assessments across different sectors [22, 41-43]. Tone’s further refinement in 2004 introduced unintended outputs into the model, enhancing its capability to evaluate efficiency comprehensively [44]. In this research, the Super-Efficiency SBM model is adapted to include unintended outputs like carbon emissions from electricity consumption in cultural industries. The model operates as follows:
In this model, let the symbols n, m, s1, s2 denote the number of decision-making units, the quantity of input indicators, the count of expected output indicators, and the number of unintended output indicators, respectively. These are utilized in assessing the green development of cultural industries. The variables x, yd, yu correspond to the inputs, the expected outputs, and the unintended outputs, respectively. Here
(2)
In this formula, ρk is used to measure the efficiency of green development in the cultural industry of a specific province in China, designated as province k. When ρk is less than 1, it indicates inefficiency in the production unit, suggesting a need for enhancement and refinement in operational practices. On the other hand, a ρk value of 1 or more indicates that the production unit is operating efficiently, with higher values correlating to greater efficiency. The terms
A Two-Way Fixed Effects Model
Following the results of the Hausman test, a fixed effects model is selected. This model is essential for addressing individual and temporal differences and minimizing estimation errors due to unseen factors, thereby enabling a more precise estimation of the relationship between digitization level and green development efficiency in the cultural industry. Recognizing that macroeconomic factors also influence the green development efficiency of the cultural industry, this study includes variables like per capita regional GDP, industrial structure, marketization degree, financial sector development, energy consumption elasticity, consumption structure, and residents’ income elasticity as control variables. These additions aim to minimize the error that might arise from omitted variables. The following two-way fixed effects model is proposed:
In Equation (3), i represents the province, t the year, greenculture the efficiency of green development in the cultural industry, α a constant term, digitalindex the level of digital economy development, X a set of control variables, β and η the parameters to be estimated, and ε the random error.
Variables and Data Sources
Variable Descriptions
Dependent variables: The efficiency of green development in China’s cultural industries, denoted as “greenculture”, necessitates an indicator system encompassing the fundamental attributes of cultural industry activities. Considering the complexity of these activities, the paper opts for representative indicators, drawing on prior efficiency measures in the cultural industry, which often include human resources and capital elements as inputs, and added value and business income as outputs [22, 45-49]. Adhering to principles of comparability, authenticity, and simplicity, this study selects input and output indicators detailed in Table 1. The analysis involves 31 Decision Making Units (DMUs), corresponding to 31 provinces, with 3 input and 2 output indicators, fulfilling the Data Envelopment Analysis (DEA) requirements.
Green development efficiency, as discussed in this paper, extends beyond traditional technological efficiency, which primarily focuses on economic outcomes. It encapsulates the transition towards more environmentally friendly technological practices, offering a thorough evaluation that encompasses both energy consumption and environmental pollution. Accordingly, the output variables are categorized into two groups: expected outputs and unintended outputs.
Expected output indicators. These indicators aim to quantify the economic benefits accruing from the green development of cultural industries across regions (Table 1). Drawing on research by Lu [45] and Wu [48], this study selects the business income of cultural and related industries in each region as the output indicator, reflecting the profitability of the cultural industry. To control for price variations, 2013 is set as the base year, with the variable adjusted to real values using the consumer price index.
Table 1.
Input-output indicators for green development efficiency in China’s cultural industry.
Unintended output indicators. These indicators focus on quantifying the carbon emissions attributed to energy consumption in the green development process of cultural industries. Considering the comprehensive nature of the cultural industry and the absence of specific data on resource consumption in cultural and related industries in China, this study calculates carbon emissions relative to the overall business income of the cultural industry, proportionate to the Gross Domestic Product (GDP) of each region [49]. Utilizing the Provincial Greenhouse Gas Inventory Compilation Guide and considering the operational characteristics of China’s power grid, carbon emissions from electricity consumption in cultural industries are determined. The average emission factor for regional power grids is calculated by dividing the CO2 emissions from fossil fuel combustion by the total power output of the grid.
Modern economic production theory identifies land, labor, capital, and entrepreneurship as key elements. When applying DEA in the public sector, data availability is crucial, leading to the selection of variables like space, labor, and capital as inputs [48]. Owing to the challenges in defining land usage for cultural industries in China and its minimal impact on the development of these industries, this study excludes land as a production input element. Consequently, the chosen input indicators are labor, capital, and technology.
(1) Labor input: The cultural industry’s reliance on human resources is profound, as creativity and talent form the backbone of its development. These human elements bring unique contributions that cannot be replicated by machines or automated processes. The quality and quantity of labor are directly linked to the capacity for creating and innovating cultural products, significantly influencing the industry’s efficiency. Due to the absence of detailed measures for labor time and quality in public statistics, this study utilizes the number of employees in cultural and related industries at year-end as a metric for labor input.
(2) Capital Input: The study uses public financial expenditure on culture, sports, and media as a measure of capital input in the cultural industry. Capital input plays a fundamental role in the operations and growth of all industries, with its application having a direct bearing on the efficiency of industrial activities. In line with the approach in existing studies, where fixed asset investment or total assets are often used for measuring capital input in cultural and related industries, this research chooses public financial expenditure on culture, sports, and media for its analysis [48,49]. Acknowledging the scarcity of direct data on the capital stock of cultural industries, this paper follows the methodology proposed by Wu [48] and others, selecting this variable as a representative of capital input. To account for price variations over time, this variable is normalized to real values using the consumer price index, taking 2013 as the base year.
(3) Technology input. The total number of patent authorizations in cultural and related industries is a key indicator of the industry’s innovation and technological advancement. These authorizations reflect the industry’s capability for sustainable growth and long-term competitiveness. Following the approach of Zhang [50] and other researchers, this paper chooses the total number of patent authorizations as a measure of technological input, acknowledging the challenges of interdisciplinary overlap and integration in project selection.
Independent variable: In this study, the primary independent variable is the digital economy development level (digitalindex). The research aims to examine the impact of digitization levels on green development efficiency within the cultural industry. Following the framework proposed by Wang [51], a provincial-level indicator system has been devised to measure the extent of digitization in China. This comprehensive system includes three key indicators: digital economy infrastructure, digital industry maturity, and industry digitization degree.
Digital economy infrastructure considers factors such as mobile phone and internet penetration, information transmission capacity, signal coverage, broadband internet infrastructure, and investment in digital services. Digital industry maturity is evaluated based on the development stages of sectors including post and telecommunications, electronic information manufacturing, and software and information technology services. Industry digitization is assessed by examining enterprise digitization progress and the degree of digital inclusion. The entropy weight method is utilized to calculate the digitalization level across China’s provinces, with the detailed index calculation method presented in Table 2.
Control Variables: Following the framework of Lee [52], the following control variables were considered in this study:
1. Logarithm of per capita GDP (lngdp): To address variations in economic development across Chinese provinces, per capita gross regional product is employed as a control variable.
2. Logarithm of industrial structure (lnstr): This variable captures the ratio of the tertiary sector’s GDP to the regional GDP, delineating the industrial structure in each province.
3. Logarithm of the marketability index (lnmarket): The degree of marketability is integrated as a control variable, given its possible effect on the advancement of regional cultural industries.
4. Level of development of the financial sector (financial): The growth of the financial sector, indicated by the proportion of financial sector GDP to regional GDP, is a significant control variable for each province.
Table 2.
Framework for assessing provincial digitization levels in China.
5. Elasticity coefficient of energy consumption (energy): This coefficient is included to examine the relationship between the cultural industry’s green development efficiency and regional energy use.
6. Consumption structure (consumer): Reflecting population consumption habits, this variable is defined by the ratio of essential consumption expenditure to total expenditure in each province.
7. The elasticity of residents’ income (income): This measures the sensitivity of residents’ consumption to income changes, represented by the ratio of consumption growth rate to income growth rate.
Data Sources
Given the evolving nature of cultural and related industries and the National Bureau of Statistics of China’s multiple revisions of statistical standards, panel data from 2013 to 2021 across 31 provinces (excluding Hong Kong SAR, Macao SAR, and Taiwan region) was selected for this empirical study. The green development efficiency in China’s cultural industry is analyzed as per the National Bureau of Statistics’ regional division. Data on business income, employee numbers, patent authorizations, and public financial expenditure in culture, sports, and media are derived from the “China Culture and Related Industries Statistical Yearbook” (2014-2022) [53]. The consumer price index from the “China Statistical Yearbook” (2014- 2022) [54] and carbon emissions data from the “China Energy Statistical Yearbook” (2014-2022) [55] and the “Provincial Greenhouse Gas Inventory Compilation Guide” are also utilized [56].
Table 3 presents the descriptive statistics for the study’s input and output variables. Table 4 presents the descriptive statistics of variables required for panel regression. The results of the Kolmogorov-Smirnov test, which are significant, reveal that all these variables do not follow a normal distribution. This finding suggests the suitability of non-parametric models for the analysis.
Results and Discussion
Analysis of Green Development Efficiency in China’s Provincial Cultural Industries
Efficiency Measurement and Temporal Analysis
Utilizing the super-efficiency SBM model with unintended outputs, this study evaluates the green development efficiency of cultural industries across 31 provinces in China from 2013 to 2021. The analysis includes annual averages and compares the average efficiencies across China’s four main regions. As illustrated in Table 5, the average green development efficiency of cultural industries nationwide during the study period was 0.8048, suggesting a potential improvement margin of 19.52% to achieve full efficiency. Region-wise, efficiencies in descending order are observed in the eastern (0.8561), central (0.8427), western (0.7635), and northeastern (0.7229) regions.
Table 3.
Input-output variable descriptive statistics for China’s cultural industry green development efficiency.
Table 4.
Descriptive statistics of panel regression variables.
Table 5.
Average green development efficiency in China’s cultural industry (2013-2021).
Fig. 1 presents green development efficiency in China’s provincial cultural industries from 2013 to 2021. The overall efficiency initially increased, subsequently declined, and recently showed signs of recovery, indicating a dynamic adjustment with fluctuations. In 2021, the efficiency was 0.7860, marking a 1.48% increase from the previous year but a 2.18% decline from 2013, with an average annual decrease of 0.4%. The trend demonstrates fluctuation, with a peak in 2016, a decline until 2020, and a rebound in 2021.
The efficiency trend in green development efficiency in China’s provincial cultural industries, as depicted in Fig. 1, consistently aligns across its four major regions and can be segmented into three distinct stages. These stages reveal a notable time lag at major turning points across different regions. In the initial phase of fluctuating growth, the eastern and central regions exhibited this trend for four years, the western for three, and the northeastern for only one year. Conversely, in the period of decline, the duration varied, with the northeastern region experiencing it for six years, the western for four, the central for three, and the eastern for just one year. However, in 2021, all regions showed promising signs of recovery in their green development efficiency. Throughout the study period, the green development efficiency in China’s provincial cultural industries ranked highest in the eastern region, followed by the central, western, and northeastern regions, respectively. Notably, the eastern and central regions maintained efficiencies above the national average, while the western and northeastern regions lagged behind, displaying a progressive decrease in efficiency from east to northwest.
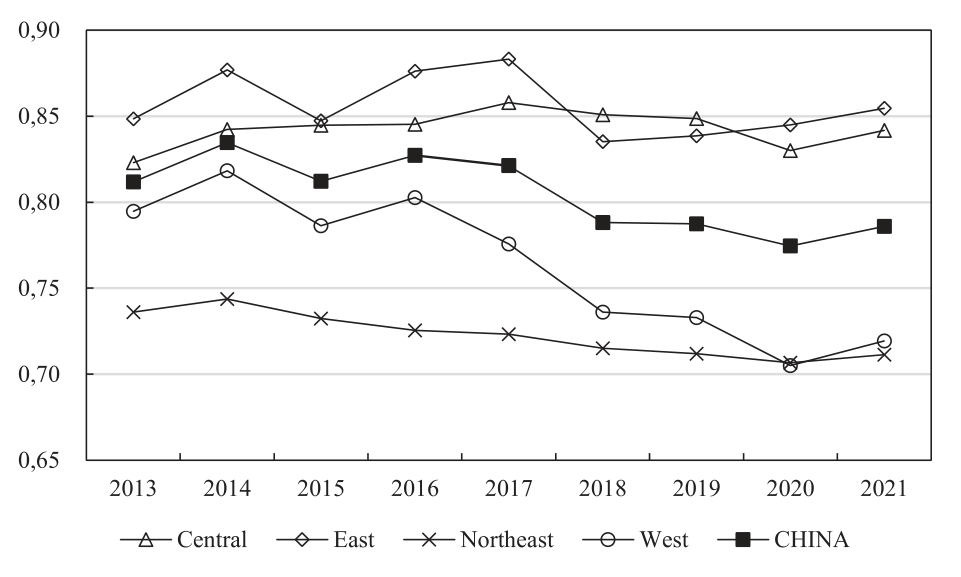
In a more detailed regional comparison to the base period, the green development efficiency enhancements in China’s provincial cultural industries were evident only in the eastern and central regions, whereas the other regions faced varying degrees of decline. Specifically, the central region marked a significant increase in efficiency by 2.28%, with a key shift in 2018 and subsequent declines over three years. The eastern region observed a moderate increase of 0.73%, the second-highest among the regions. Despite significant declines in 2015 and 2018, this region showed improvements in other years relative to the preceding ones. On the other hand, the western region experienced a pronounced downward trend, registering a cumulative decrease of 9.46% in efficiency over the study period. The northeastern region, while experiencing an overall decline of 3.37%, saw occasional increases in 2014 and 2021 but otherwise declined in comparison to previous years.
Analysis of Regional Green Development Efficiency in Cultural Industries
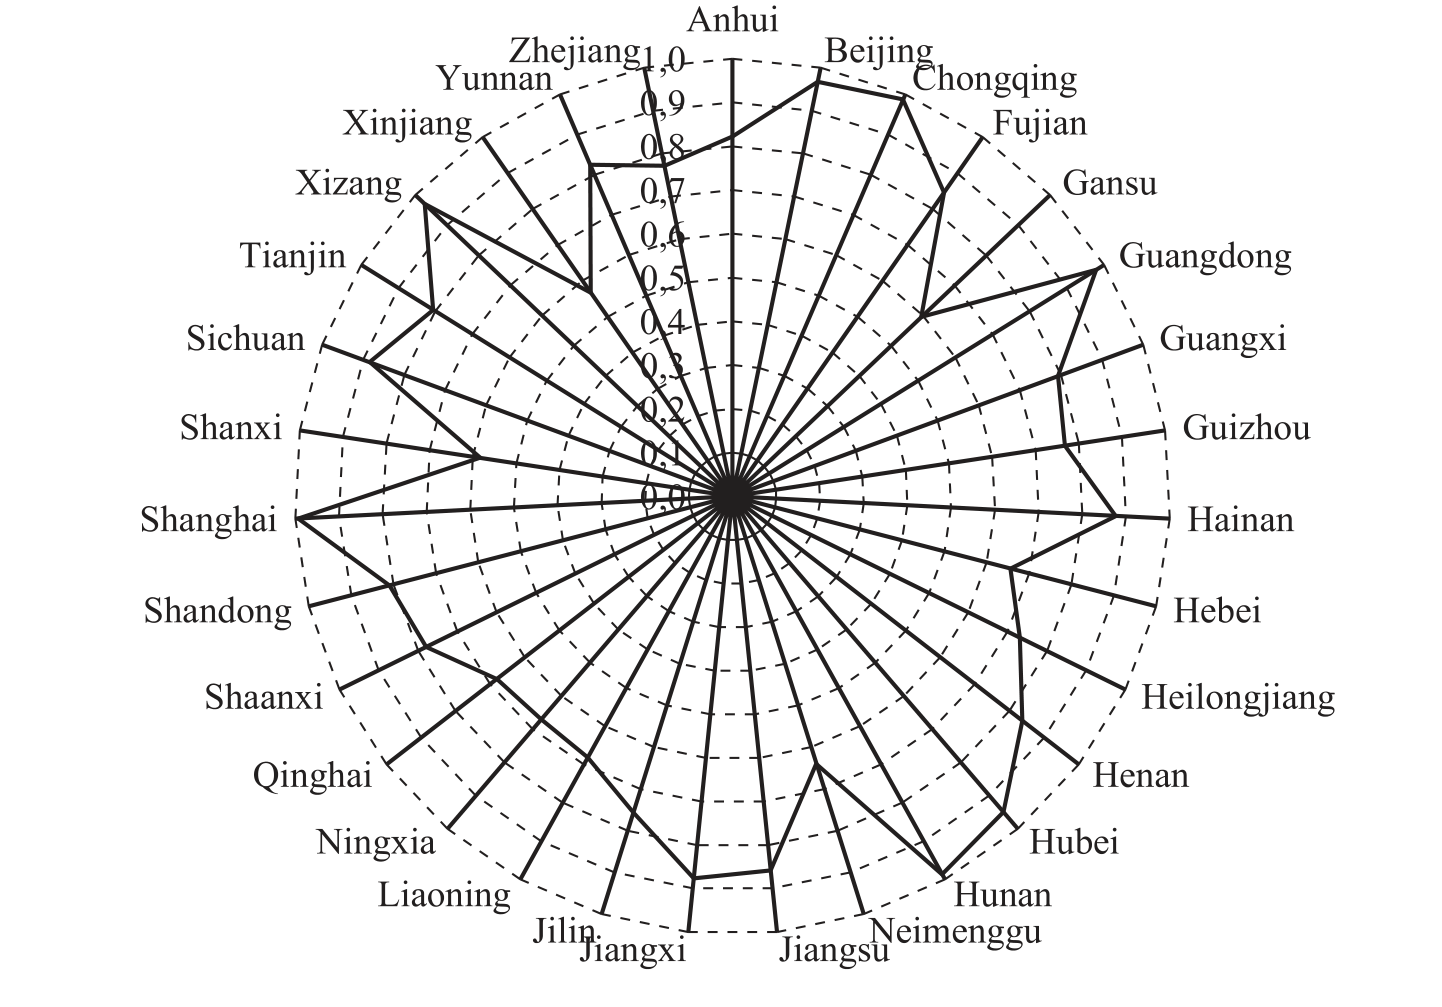
This study presents a detailed calculation of the average green development efficiency for each province’s cultural industries, as illustrated in Fig. 2. The spatial analysis reveals a noticeable unevenness in the distribution of green development efficiency across China’s provinces during the study period. Shanghai stands out with the highest average efficiency at 0.9933, closely approaching full efficiency. In contrast, the Xinjiang Uyghur Autonomous Region records the lowest efficiency at 0.5679, which is merely 57.17% of Shanghai’s efficiency. Other provinces like Chongqing (0.9873), Hunan (0.9871), Guangdong (0.9782), Tibet (0.9704), Beijing (0.9672), and Hubei (0.9496) also exhibit efficiencies above 0.9. Remarkably, provinces such as Chongqing, Hunan, Tibet, and Hubei, despite being in the inland central and western regions, showcase high efficiency in their cultural industries. This reflects their effective management and resource allocation strategies in cultural industry development.
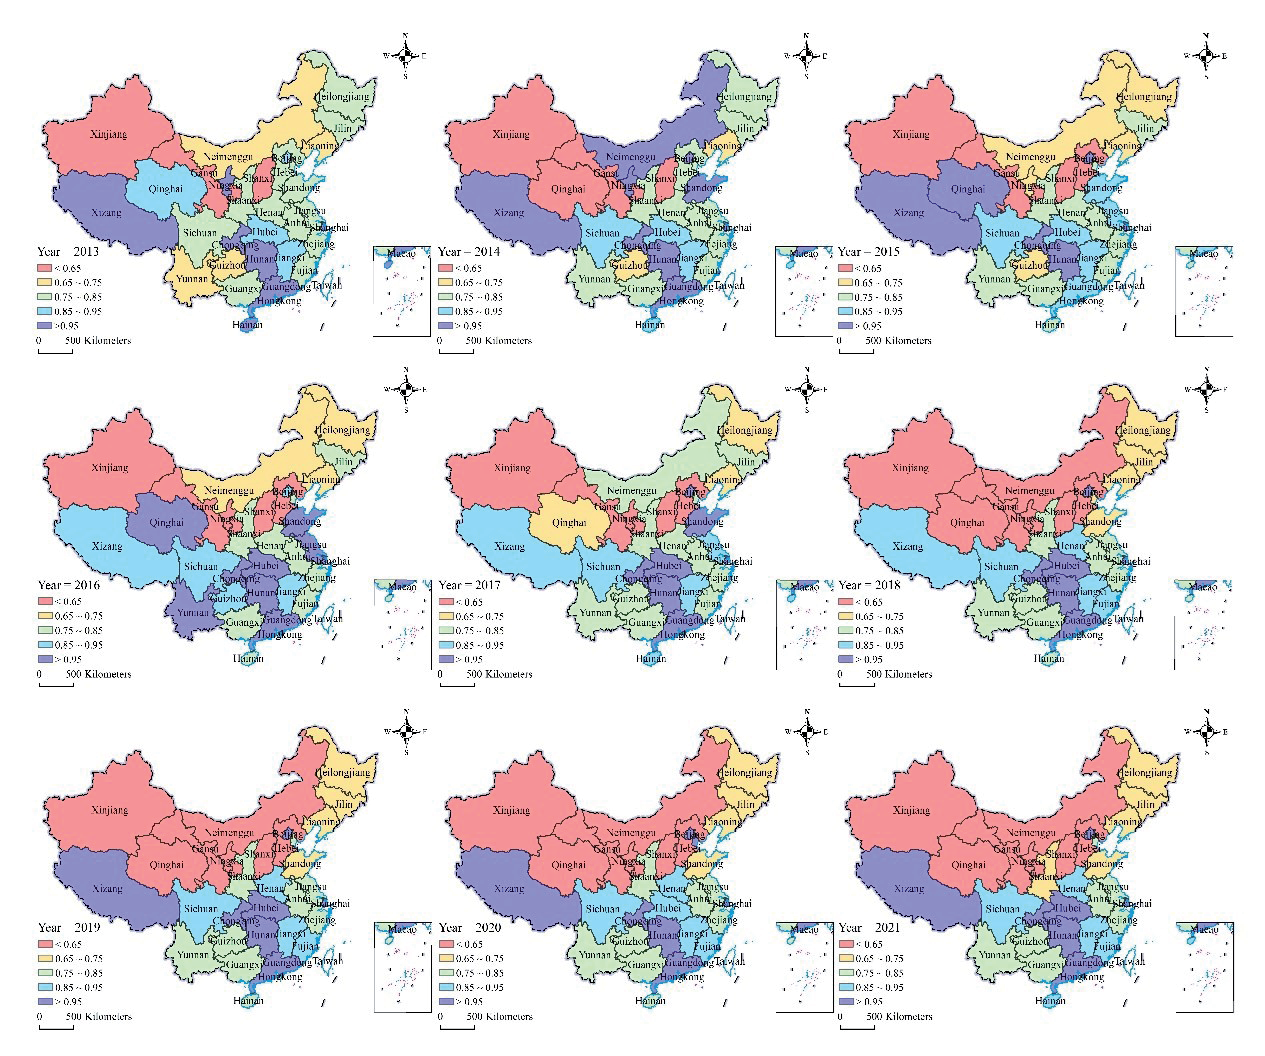
This paper also utilizes the ArcGIS tool for an intuitive representation of the efficiency evolution in cultural industries across China’s provinces. Fig. 3 offers a spatiotemporal evolution map, providing insights into efficiency trends from 2013 to 2021. The map in Fig. 3 highlights the substantial spatial disparity in green development efficiency across the provinces. High and stable efficiency levels are observed in provinces like Guangdong, Hubei, Hunan, and Tibet, whereas the western region’s provinces consistently exhibit lower efficiency, forming a cluster in these areas.
The year 2021 shows significant latitudinal variation in the efficiency of cultural industries, with higher efficiency typically seen in lower-latitude regions. Beijing, Guangdong, Shanghai, and Tibet achieved peak efficiency values, while Qinghai reported the lowest at 0.4018. The provinces are divided into five categories based on their efficiency, with Beijing and other high-performing provinces constituting 16.13% of the total sample and lower-efficiency provinces like Hebei and Shanxi making up 22.58%. Between 2013 and 2021, 17 provinces displayed increased efficiency, with Fujian Province leading the improvement at 11.99%. In contrast, 14 provinces showed a decline in efficiency, with Qinghai seeing the most significant decrease.
Table 6 presents the annual distribution of provinces across different efficiency levels. Since 2018, there has been a noticeable steadiness in provinces with efficiencies above 0.85, primarily in the central region. Meanwhile, an increase in provinces with efficiencies below 0.75, mainly in the western region, indicates a shift towards more balanced development in the cultural industries of these areas.
Impact of Digitalization on Green Development Efficiency in Cultural Industries
Table 7 presents the results from the two-way fixed effects model, examining the influence of digitalization on the green development efficiency of the cultural industry. The regression outcomes, depicted in columns (1) and (2), reveal that the digitalization level is significantly and positively associated with green development efficiency at the 1% significance level. This finding remains consistent regardless of the inclusion of control variables, indicating that an increase in digitalization positively impacts the efficiency of green development in the cultural industry.
Robustness Tests
To ensure the robustness of the benchmark regression results, this paper implements two empirical testing approaches. Firstly, the standard errors are adjusted to cluster robust standard errors at the provincial level. Secondly, an instrumental variable for the digital development level is constructed. Following the methodologies of Nunn [57], this study uses the number of landline telephones per hundred people and the number of post offices per million people in 1984, along with the interaction term of the previous year’s national Internet investment, as instrumental variables. The rationale is rooted in China’s Internet evolution, where initial internet access heavily relied on telephone lines, and the distribution of fixed telephones formed the foundational infrastructure. Thus, using the historical data of landlines and post offices as instrumental variables for digitization level meets the relevance criterion and is unlikely to directly influence the green development efficiency of China’s cultural industry historically.
The regression results presented in columns (1) and (2) of Table 8 use clustered standard errors and instrumental variables at the provincial level, respectively. Column (1) of Table 6 shows that the digitization level remains significantly positive at the 5% significance level with robust standard errors. Column (2) demonstrates that when using the number of landlines and post offices as instrumental variables, the digitization level is significantly positive at the 1% level. These outcomes collectively reinforce the robustness of the benchmark regressions.
Table 7.
Impact of digitization on green development efficiency of cultural industry.
Table 8.
Assessment of digitization’s impact on cultural industry’s green development using robustness tests.
Conclusions
This analysis, centered on the green development efficiency of China’s cultural industries, sheds light on both the temporal and spatial variations in efficiency, as well as the role of digital technology in shaping these trends.
Initially, the study finds that the green development efficiency of China’s cultural industries has undergone a complex pattern of increase, decline, and subsequent recovery. By 2021, a slight dip of 2.18% from 2013 levels was observed, bringing the efficiency to 0.7860. This pattern reflects a varied yet progressive adjustment in efficiency over time. When examined regionally, there’s a discernible stepwise reduction in green development efficiency from the eastern to the northeastern regions.
Furthermore, the study reveals pronounced spatial disparities in green development efficiency across different Chinese provinces. High-efficiency clusters are prominent in select provinces, including Beijing, Hubei, Hunan, Guangdong, and Tibet, achieving optimal efficiency levels. Conversely, Qinghai lags significantly behind. Over the eight-year period, 17 provinces demonstrated upward efficiency trends, with Fujian leading the improvement, while 14 provinces experienced declines, with Qinghai witnessing the most substantial drop.
Lastly, the research underscores the significant positive influence of digitization on the cultural industry’s green development efficiency. This conclusion is supported by the consistent results obtained using both instrumental variable regression and robust standard error methods, emphasizing the integral role of digital advancement in fostering the cultural industry’s green growth.
This research underscores the importance of digitalization in advancing the green development of cultural industries, offering strategic directions for policymakers. A key recommendation is to intensify investments in digital infrastructure within cultural sectors. This approach could include the provision of grants or incentives for digital innovations and a stronger emphasis on the digital skills training of industry professionals. Equally important is addressing the geographical imbalance in green development efficiency. Policy interventions should be region-specific, with more resources and developmental programs allocated to the western and northeastern provinces. These initiatives should aim at enhancing local infrastructure and providing access to necessary technologies, thereby fostering a more equitable growth in green development efficiency across different regions.

