

Introduction
The environment is a complex system that consists of both biotic and abiotic communities. Atmospheric air is one of the major abiotic components of the environment. Atmospheric air is composed of particulate matter (PM), water vapor, various gases, and several active to inert elements and compounds [1, 2]. The gaseous and PM compositions of the air are influenced by prevailing environmental conditions, geological features, and other anthropogenic conditions [3]. The gaseous/volatile organic compounds compositions of the atmospheric air play an essential part in supporting biotic lives and influencing climatic conditions [4]. Air pollution is a mixture of hazardous substances (gaseous and other PMs) which has severe consequences for human health. Air pollution is one of the leading causes of death globally. The hazardous nature of air pollution is dependent on the type(s) of the pollutants, components of the pollution, and the prevailing environmental conditions [5]. Vulnerable populations – infants, the elderly, and people with chronic health conditions – are more susceptible to the health risks associated with air pollution [6].
In many developing nations, inadequate railway and inland waterway transportation systems have put extreme pressure on the road transportation system. Heavy and bulky goods are transported by heavy-duty vehicles, leading to traffic congestion and the rapid deterioration of road networks. Emissions from the combustion of fuel release greenhouse gases such as carbon oxides (COx), sulfur oxides (SOx), and nitrogen oxides (NOx) into the atmosphere; hence contributing immensely to climate change and global warming. Sulfur dioxide (SO2) and nitrogen oxides (NOX) are the leading causes of acid rain, which depletes plants’ nutrients in the soil, hence resulting in retarded plants’ growth and poorer yields [7]. Prolonged exposure of human beings to PM emissions from diesel engines can lead to cardiovascular problems, increasing the risk of heart attacks and other related issues [8]. Some health hazards which can be linked to air pollution are: respiratory and cardiovascular diseases, heavy metals poisoning, and stillbirth [9]. Vehicular and other road-related activities emit substantial amounts of PM, heavy metals (HMs), and other toxic gases into the environment, posing significant hazards to ecosystems [10]. Roads with unpaved surfaces provide favorable conditions for dust generation. When vehicles especially articulated vehicles) travel through them, significant amounts of dust particles are generated and released into the air, primarily due to the interaction between the vehicle tires and the materials making up the road subgrade or subbase.
Heavy metal is a term commonly used to describe metal with high density and can be relatively harmful to living organisms at low concentrations. Some heavy metals commonly referred to as potentially toxic elements (PTEs) include: nickel “Ni”, mercury “Hg”, lead “Pb, chromium “Cr”, and cadmium “Cd”. Though some heavy metals (copper “Cu”, manganese “Mn” and zinc “Zn”) have been proven to be essential for human growth and performance in trace amounts, they can be harmful at higher concentrations [11]. Human beings assimilate toxic substances through three major pathways: oral, dermal contact, and inhalation. The health implications associated with PTE’s toxicity are dependent on the type of metal, its chemical form, the duration and intensity of exposure, and individual susceptibility [12]. PM contamination and toxicity have become global threats to the biotic community of the ecosystems. Health implications of PTEs pollution include – retard intelligence, liver and kidney failure, cardiovascular disease and some forms of cancer [2].
Recently, research has been conducted to quantify pollution levels and identify the primary emerging pollutants [13-15], and traffic activities have been recognized as a major contributor to environmental pollution [16-18]. Vehicular activities with the potential to cause massive atmospheric pollution include fuel/lubricant combustion, tire and brake wear, and road surface abrasion. Emissions from the combustion of fossil fuels are rich in Pb and Cd; particles emitted from tire/brake wear contain considerable amounts of Cu, Zn, Cd, and Ni [19]; while poor road surface emission is rich in As, Fe, and Zn [17, 20]. Additionally, emissions from asphalt, a commonly used road surfacing material, contain a wide range of heavy metals, including Cu, Zn, Cd, and Pb [18]. Remarkably, it has been documented by several scholars that emissions from road activities have a colossal negative impact on roadside soil, air, and vegetation [21-25]. These emissions have adverse effects on human health, particularly respiratory issues [26, 27]; increased roadside soils and vegetation PTEs levels [16, 28, 29]; and significantly altered chlorophyll production and performance in green plants [30-32].
The plant is one major natural air purifier, as it has the ability to accumulate and remediate large contaminants present in the environment [21]. According to [33, 34], there is a strong correlation between traffic density and the concentration of PTEs in the plants’ tissues. Plants absorb pollutants through their leaves and root systems, filtering and degrading atmospheric pollutants through their body structures. This process reduces the volume of these pollutants in the environment and improves air quality [35, 36]. The air purification capacity of plants depends on various factors, including the plant species, growth stage, leaf area index, leaf morphology, and the concentration of contaminants [21, 34].
Some scholars have asserted that the amount of PTEs accumulated in the human body is directly proportional to the concentration of contaminants present in the air, vegetation, and water [32]. To mitigate these challenges posed by PTE contamination in ecosystems, regular monitoring of the PTE concentration in the plant bodies, air quality assessment, and sustainable land/ road management are necessary factors to be considered [1]. This is because forests and grasslands serve as primary sources of essential food items for humanity. Contamination of these areas poses significant risks to human well-being, through gradual bioaccumulation of these poisonous substances, eventually leading to heavy metals toxicity [37]. Naturally, roadside plants are exposed to various anthropogenic pollution sources, affecting the food chain and ultimately affecting the entire ecosystem. Therefore, it is paramount to pay great attention to grassland and arable land located close to national or regional roads, as these areas are typically subjected to elevated emissions volumes. Monitoring the ecological pollution levels of these areas is crucial, especially since rural regions are often preferred locations for motorways, increasing the risk of contamination [10, 18].
Nigeria’s roads are deteriorating rapidly due to rapid urbanization, increased traffic density, and poor road management structure, consequently leading to massive ecological pollution [29, 38]. Several studies have examined the hazards associated with vehicular traffic-related emissions on the environment [1, 3, 37, 39-41]. Existing research reveals a lack of comprehensive studies on heavy metal accumulation in plant leaves and soil, as well as the potential ecological risk under varying road emission intensities over large areas in Nigeria. Targeted research on the spatial distribution of traffic emission-induced heavy metals pollution in the Middle Belt region of Nigeria is now paramount. This is due to the area’s high human population, significant food production potential, and the deplorable state of its roads. Therefore, the goal of this study is to evaluate the heavy metal concentrations in roadside plants and particle matter (PM2.5) and their health implications. Additionally, Geographic Information Systems (GIS) using ArcGIS 10.6 software will be utilized to map out the spatial distribution of heavy metals in the studied region. Furthermore, the results obtained from this study will offer substantial insights into heavy metal pollution levels and environmental health quality.
Materials and Methods
The Study Area
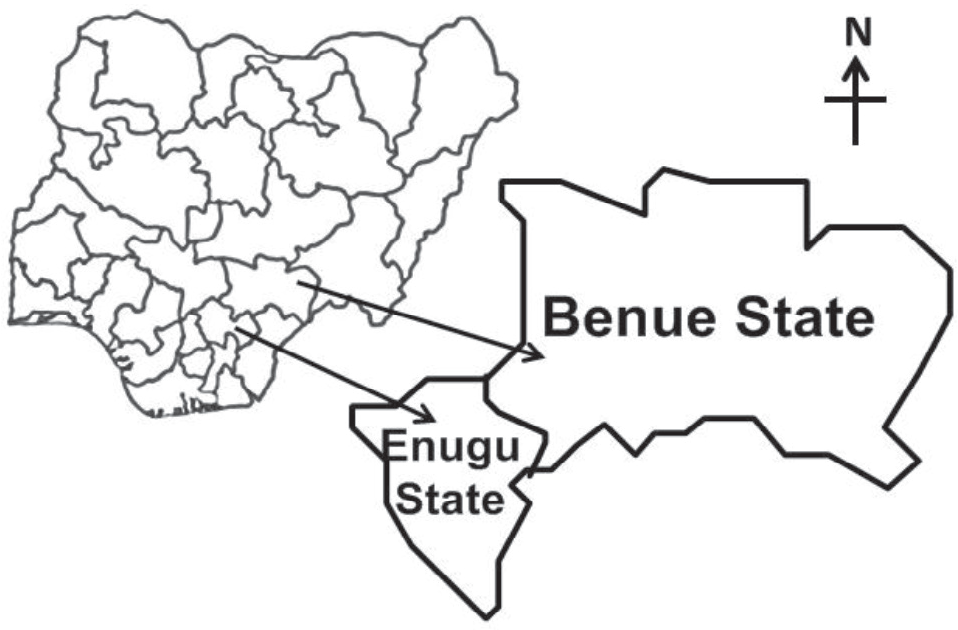
This research investigated a section of the middle belt region of Nigeria. The area studied has a landmass of approximately 40,000 km2, and contains a series of major highways linking southern and northern Nigeria (Fig. 1). Additionally, the area is known for its predominant rainforest and Guinean forest-savanna status. This is an indication that the region has diverse ecosystems (different ecosystems) with various flora and fauna adapted to different ecological conditions. The fact that most of the highways passing through this area are in a very poor, deplorable state indicates potential interactions between human infrastructure and the natural environment. Additionally, numerous isolated rural and semi-urban towns are located within the studied area, with human pollution of about 10 million [32, 42].
The area experienced two distinct climatic seasons, characterized by a rainy (wet) season and a dry season, with significant temperature fluctuations throughout the year. The annual rainfall of the region varied from 1500 mm per annum to 1800 mm per annum, non-uniformly spread across the year [43]. Apart from the automobile (vehicular), agricultural, and artisans’ workshop activities, the area has limited interference from other human-induced pollution activities. The deplorable state of roads in this region is a vital contextual factor, as road conditions can influence the extent and nature of vehicular emissions, potentially affecting vegetation in the vicinity. The diverse topography of the studied region, encompassing hills, plains, and disturbed natural vegetation due to farming and semi-industrial activities, introduces additional complexities to the evaluation of the impact of air pollution from road activities on the environment.
Cashew (Anacardium occidentale) is one of the commonly found trees in the study area, mainly planted as a medium of erosion control and afforestation. Cashew’s extensive root system has high tensile strength, which helps to bind the soil practices together, thereby preventing erosion and leaching of the soil nutrients [44]. The plant is a fast-growing deciduous tree, resistant to harsh environmental conditions, and helps in moisture conservation. Cashew cultivation has become widespread in the region due to its multifaceted benefits, including environmental protection, medical uses, and socioeconomic advantages. Cashew nuts, fruits, and leaves are rich in vitamins and antioxidants, while the extracts from the bark, leaves, and roots have anti-inflammatory and antimicrobial properties [45, 46]. The nut and oil are valuable export commodities and their global demand is steadily increasing due to their versatility in industrial applications and their perceived health benefits [45]. As a result of its potential for versatile utilization and environmental remediation, the cashew plant was chosen as the sole research material in this study to evaluate the impact of air pollution from road activities on the environment.
Samples Collection
Twenty-two spatial points were identified within the study area for the collection of samples. Sampling cashew leaves and outdoor air from these spatial points is a critical step in comprehending variations in heavy metal concentrations within the region’s vegetation. This process will tend to identify potential causes and assess the potential impacts on human health. Vehicular activities were only the obvious anthropogenic actions in all the sampling locations. The geographical coordinates, specified in terms of latitude and longitude, for all spatial points where samples were collected, are detailed in Table 1. The sampling unit operation was conducted between August 2023 and November 2023.
Cashew Leaves
At each spatial location, the leaves were collected in about 300 m diameter along the main road. To properly evaluate the impact of road activities on the vegetation (cashew plant), both areas with bad road spots (characterized by higher levels of emissions), and areas with good motorable roads (characterized by lower levels of emissions), were taken into consideration. All the selected spatial sites have comparable in environmental conditions - soil type, temperature, rainfall pattern, and farming practices. Also, during the sampling process, some key indicators such as leaf size, age, morphology, and overall vitality were taken into consideration. Furthermore, cashew leaves were sampled from another two locations without significant road or vehicular emissions. These two points are considered the reference (control) points. This will help to properly monitor the impact of the road actions on local vegetation.
Air Samples Collection
The outdoor air was sampled by using a portable air sampler (model CF-903, HI-Q Environmental Products Companyinc., America), at an airspeed of 100 L/min using a 60 mm diameter glass fiber filter. Prior to each sampling operation, the filters were conditioned at a temperature and relative humidity of 45oC and 60%, respectively, before each sampling operation. The only evident anthropogenic actions in all sampling locations were related to vehicular activities, and the spatial points have close proximity to where the cashew leaves were sampled. A sampling height of approximately 2 meters above the soil surface was consistently maintained during the air sampling process.
Laboratory Analyses
The relevant laboratory tests were carried out on the sampled PM and vegetation in accordance with the American Society for Testing and Materials (ASTM) approved procedures. Reagents used for the chemical analyses were of the analytical grade, produced by Merck KGaA (manufactured in Germany). The sulfuric acid (H2SO4) has a 97% purity level, perchloric acid (HClO4) has a purity of 72%, and the nitric acid (HNO3) has a 65% purity level.
Leaves Sample Preparation
The leaves were washed with distilled water to remove all contaminants/airborne deposits from their surfaces and dried under a room temperature of 29±5oC for two weeks. The air-dried leaves were ground with an electric blender and sieved with a 0.8 mm sieve before they were digested.
Determination of the Leaves’ PTE Concentration
During the digestion procedure, 10 g of the sieved sample was transferred into a round bottom conical flask containing 20 mL of concentrated HClO4, H2SO4and HNO3 mixture (mixed in a ratio of 1:2:2). The content of the conical flask was heated in a water bath at a temperature of 100oC. The heating was continued until a clear solution was achieved, and the product “solution” was sieved with a paper filter into a measuring cylinder as described by Rehman [47]. The solution was cooled to room temperature and was diluted using double distilled water until a total volume of 100 mL was reached. Dilution is necessary in analytical chemistry to make the solution more suitable for further analysis. Subsequently, each PTE [nickel (Ni), Cadmium (Cd), Arsenic (As), Copper (Cu), lead (Pb), mercury (Hg), and zinc (Zn)] concentration in the digested solution was measured using an atomic absorption spectrophotometer (model - Unicam 969 AA, produced in America), using the appropriate wavelength of the heavy metal. The limit of Detection for Ni, Cd, As, Cu, Pb, Hg, and Zn was 3.00×10⁻⁴, 6.00×10⁻⁵, 6.00×10⁻⁴, 3.50×10⁻⁴, 1.00×10⁻⁴, 6.00×10⁻⁵ and 2.00×10⁻³, respectively.
Table 1.
The coordinates of the sampling points.
Chlorophyll Content Determination
The fresh leaves were washed with distilled water to remove foreign bodies. Thereafter the chlorophyll pigment of the leaves was extracted using ethanol (95% concentration), and the total chlorophyll content of the filtered solution was measured using a spectrophotometer, as described by Li [48].
The pH Determination
The pH value of the leaves was determined through the use of a portable pH meter (manufactured by Mettler-Toledo, Australia), by using the non-grinding method as described by [49].
Quality Assurance (QA) and Quality Control (QC) Measures
The QA and QC procedures were conducted on each sample to ensure the reliability and accuracy of the analyses conducted on each sample. The blank sample was incorporated with certified reference material to enhance robust quality control of the PTE analysis, minimize potential sources of experimental errors, and provide a reliable reference standard for the calibration. All the analyses were conducted in triplicates and the relative standard deviation was less than 5%, with a certified reference material recovery rate that ranged from 93% to 102%.
Environmental Hazards Assessment
Contamination Factor (CF)
The contamination factor is used to evaluate the pollution level of a PTE in leaves. This factor is calculated through the formula shown in Equation (1) [29].
Where: Cx of the PTE concentration at the sampling location and Cn is the PTE concentration at the control location.
The pollution ranking orders of PTE based on the CF value are: CF<1 ~ No or Minimal Pollution, 1≤CF≤3 ~ Moderate Pollution, 3≤CF≤6 ~ Considerable Pollution, and 6≥CF ~ Very High Pollution [50].
Pollution Load Index (PLI)
The PLI is another index used to grade the PTE pollution level in the environment, and it is calculated through Equation (2).
The PTEs pollution rakings based on PLI are as follows: PLI≤1 ~ unpolluted, 1<PLI≤2 ~ slightly polluted, 2<PLI≤3 ~ moderately polluted, and PLI≥3 ~ heavily polluted [20].
Geo-Accumulation Index (Igeo)
The intensity of the pollution level in the roadside PM and vegetation was further quantified by using the Geo-accumulation Index, as calculated through Equation (3),
Where Cbn is the background concentration of the PTE, and Al was taken as the background PTE as recommended by Zahra [51].
The pollution rankings based on Igeo are as follows: Igeo≤0 ~ uncontaminated, 0 <Igeo≤1 ~ uncontaminated to moderately contaminated, 1 <Igeo≤2 ~ moderately polluted, 2<Igeo≤3 ~ moderately to strongly contaminated, 3<Igeo≤4 ~ strongly polluted, 4<Igeo≤5 ~ strongly to extremely contaminated, Igeo>5 ~ extremely polluted [52].
Enrichment Factor (EF)
This pollution index was used to confirm the pollution degree of PTEs in the ecosystems and their source of pollution. The EF was computed by applying the formula presented in Equation (4).
Where Bn = concentration of the reference PTE at the sampling location; Bref = PTE concentration at the reference point.
Pollutants EF are rated as follows: EF<2 ~ minimal enrichment, 2≤EF<5 ~moderate enrichment, 5≤EF<20 ~ significant enrichment, 20≤EF<40 ~very high enrichment, and > 40 extremely high enrichment [52].
Human Health Risk Assessment
The human body usually acquires toxic substances through three major routes – oral, inhalation, and dermal; however, due to the inability of the human skin to effectively absorb or ingest the dry PTEs directly from the PM2.5, the dermal and oral exposure routes are ineffective routes. Furthermore, given that cashew leaves are typically not ingested by humans, obtaining PTE through oral transmission becomes challenging. Consequently, this study excluded the oral and dermal pathways, instead focusing solely on the inhalation exposure model.
Non-Carcinogenic Risk
Estimated Daily Intake (EDI)
The PTEs’ EDI associated with the PM2.5 was calculated through the inhalation equation presented in Equations (5) and (6) [53, 54]. Among the metals assessed, Pb, Zn, and Cu were deemed to pose noncarcinogenic risks, whereas As, Cd, Hg, and Ni were identified as posing carcinogenic risks.
Where EDI and LEDI are the daily intake for non-carcinogenic and carcinogenic risks (µg/kg.d), respectively.
Hazard Quotient (HQ) and Hazard Index (HI)
The hazard quotient (HQ) for the EDIinhal was calculated with the models shown in Equation (7).
Where 1000 is the conversion factor from µg to mg, since the RfD unit is based on the “mg” unit.
Table 2.
Definition and standards of essential factors.
Table 3.
| Heavy metal | RfD (mg/kg/d) | IUR (μg m–3)−1 |
|---|---|---|
| Inhalation | Inhalation | |
| Pb | 3.52E-03 | - |
| As | - | 4.3E-03 |
| Zn | 1.0E-02 | - |
| Hg | 8.57E-05 | - |
| Cd | - | 1.8E-03 |
| Ni | - | 2.6E-04 |
| Cu | 4.E-02 | - |
Consequently, the Hazard index (HI) of the pollutants was calculated through Equation (8).
These parameters/factors: EF, ED, Bw, AT, ATn, IRinhal, and RfDinhal were comprehensively defined in Tables 2 and 3.
Geostatistical Mapping
The mapping of the PTEs concentration in the region vegetation was done by using the ArcGIS geostatistical software. This will give a robust approach to spatial analysis, and understanding of variations in heavy metals concentrations and their potential ecotoxicity effect in the region.
Statistical Analysis
The descriptive statistics were carried out on the results with SPSS (version 20.0). The one-way analysis of variance (ANOVA) was conducted on the results to evaluate the significance of the emissions on the PM2.5 and plant samples. All the tests were conducted in triplicate and the mean results were recorded.
Results and Discussion
Heavy Metals Concentration in the Vegetation
The one-way ANOVA and descriptive summary results of the PTE concentrations in the cashew leaves across the sampled region are presented in Tables 4 and 5, respectively. Table 4 revealed that sampling location had a significant effect on the PTE content in the plant’s leaves (P ≤0.05). This outcome is further confirmation of Atikpo’s [55] observations, that spatial location has a significant impact on the minerals accumulation level in plant tissues, which was mainly attributed to anthropogenic actions. Furthermore, Table 5 shows the descriptive summary of the PTE concentration in the cashew leaves. The Ni, Cd, As, Cu, Pb, Hg, and Zn levels in the leaves ranged from 4.47-16.91 mg/kg, 0.001-0.06 mg/kg, 0.014-0.31 mg/kg, 2.23-13.91 mg/kg, 1.02-8.09 mg/kg, 0.0-17.92 mg/kg and 0.061-81.06 mg/kg, respectively. These wide ranges in the PTE concentration indicate variability in the concentrations of these PTEs across the sampled spatial points; which might be influenced by atmospheric deposition and human activities. Plants mainly acquire heavy metals (contamination) through two major pathways: assimilation from the soil and atmospheric deposition [55]. The average concentration of the PTEs recorded in the studied area vegetation followed this decreasing order Zn˃Ni>Cu>Pb>As>Cd˃Hg, which means that Zn and Hg have high significant accumulation in the region’s vegetation body. This accumulation of Zn, Ni, and Cu in the cashew leaves can be attributed to the bioavailability of the metals in the air, the specific mechanisms of the metals’ assimilation, and translocation within the plants. This indicates that poor road conditions and associated vehicular emissions significantly affect the concentration of PTEs in plant leaves, similar to the observations [34, 56]. Automobile-based emissions are a significant contributor to PTE pollution. Vehicle components, poorly maintained vehicles, and poor road surfaces release numerous pollutants, including heavy metals, into the ecosystems [16, 19, 45].
Table 4.
The one-way ANOVA of the PTEs concentration.
| Source of Variation | SS | df | MS | F | P-value | F critical |
|---|---|---|---|---|---|---|
| Between Groups | 28933.71 | 6 | 4822.29 | 87.75 | 4.54E-46* | 2.160 |
| Within Groups | 8079.44 | 147 | 54.96 | |||
| Total | 37013.15 | 153 |
Table 5.
Descriptive statistics of the heavy metals concentration in the leaves.
Generally, the leaves sampled from bad roads localities significantly have higher PTE concentrations than leaves sampled from localities with fairly good motorable roads. This portrays that there is a potential correlation between road conditions and heavy metal contamination. This confers with earlier reports of [57, 58], which stated that rough roads have the ability of reducing the operating efficiently of vehicles, leading to higher emissions of pollutants including heavy metals. According to [19, 57] emissions from brake and tire wear and fuel and its treatment significantly increased Zn, Cu, Pb, and Cd concentrations of the roadside soils and vegetation. The presence of these toxic heavy metals in the region’s vegetation should be a major environmental concern. Excessive levels of toxic metals in plant systems have detrimental effects on ecosystems and wildlife. These plants have potential health risks when they are consumed directly or indirectly by human beings [11, 55, 59].
The Cd and Ni contents in the leaves recorded in this study were generally higher than the values reported by Juwah [29], for roadside vegetation sampled from other geographical regions. Furthermore, the Cu and Pb levels obtained in this research were considerably higher than those obtained by TariDlama [60], who investigated the impact of road activities on nearby vegetation. On the other hand, the Cd and Cu contents of the vegetation were lower than those reported by [61] in some Ghana districts. Likewise, the Pb concentration detected in cashew leaves was less than the findings reported by [18, 62] for vegetation located along roadsides in a different geographical region. Lead and copper toxicities include the retardation of photosynthetic efficiency, enzymatic reactions, and critical metabolic processes, leading to poor plant development and disruption of ecosystems [59, 63].
The order (Zn˃Ni>Cu>Pb>As>Cd˃Hg) of accumulation of the PTEs in the cashew plant was similar to the accumulation pattern observed by [36] in a study conducted on roadside grasses in Poland. The variations in the PTE concentrations in the roadside plants recorded among the authors can be linked to several factors, such as; concentration of the pollution, prevailing weather conditions, soil physiochemical characteristics, materials used for the road construction, sampling technique, and sample preparation methods adopted. Soil/plant pH level, humus content, and mineral compositions of soil significantly heavy metals bioavailability in plants [64]. Different soil compositions, the volume of emissions discharged, sampling methods, plant species, and laboratory protocols can be attributed to the variations in the results obtained by the various authors.
Air Quality Assessment
Tables 6 and 7 present the results for the one-way ANOVA and descriptive summary of the PM2.5 PTEs concentration. Table 6 indicates that the PTE concentration was significantly affected by the sampling location (P≤0.05). It was noted in Table 7 that the mean concentration of the As, Cu, Ni, Cd, Pb, Hg, and Zn in the PM2.5 was 0.37, 0.0468, 0.5086, 0.0013, 0.2056, 0.0006 and 0.5423 µg/m3, respectively. Additionally, the PTEs concentration in the PM2.5 followed this decreasing trend Zn˃Cu˃Pb˃Ni˃As˃Cd˃Hg. The high levels of Zn and Cu in the particulate matter recorded in this study are similar, when compared to the observations made by Sharma [13] and Wang [15], during their investigations into the mineral content of atmospheric particles. Likewise, the low Cd and Hg concentrations recorded in this research are similar to the findings reported by [2, 14] during their research into PM2.5 quality.
The elevated levels of Zn, Cu, and Pb level recorded in the outdoor PM2.5 could be attributed to emissions from materials used for road construction, fuel combustion, brakes, and metallic materials used for vehicle construction [20]. According to [19], emissions from vehicle tires are rich in Zn and Cu, making them toxic to the environment, as they can accumulate in the soil and water bodies and disrupt ecosystems. Similarly, the substantial Ni, As, and Cd concentration recorded in the PM2.5 can be linked to particle emissions from batteries, lubricants, tire wear, and alloy components of the vehicles. Vehicles traveling on roads with loose surface materials have the potential to raise a considerable quantity of dust particles, and these particles often contain high concentrations of toxic substances. The spatial distribution of these contaminated particles is determined by several factors; notably weather conditions, topography, vegetative cover, wind, water, or air current [20, 65]. High-velocity winds tend to spread air pollutants over large areas. Vegetation reduces wind speed and traps pollutants, while atmospheric moisture content helps to absorb pollutants from the air. These actions dictate the concentration and spread of particulate matter.
Table 6.
The one-way ANOVA of the PM2.5 PTEs concentration.
| Source of Variation | SS | Df | MS | F | P-value | F critical |
|---|---|---|---|---|---|---|
| Between Groups | 11.667 | 6 | 1.944 | 99.809 | 2.62E-49* | 2.1607 |
| Within Groups | 2.8640 | 147 | 0.0194 | |||
| Total | 14.5316 | 153 |
Table 7.
Descriptive statistics of PM2.5 and the PTE (μg/m3).
Table 8.
Heavy metals concentrations in PM2.5 from other regions (μg/m3).
Table 8 presents a comparative analysis of the findings obtained in this study with those observed by previous authors. It can be seen that the Pb level recorded in this study’s PM2.5 was greater than the concentration reported by [2, 3, 15, 23]; while the As and Zn levels reported in this study were less than the results documented by [13]. Similarly, Table 8 reveals that this study PM2.5 Cd content was smaller, when compared to the findings of [1, 2, 14, 23]. The observed differences in PTEs concentrations in the PM2.5, as documented by the various authors, can be attributed to these factors: volume of contaminants emitted, prevailing environmental conditions, natural vegetation remediation ability, roads construction materials, as well as the techniques employed for the sampling and laboratory analyses.
The result of the relationship (percentage) between the PM2.5 PTE content and sampling spots is presented in Table 9. Table 9 reveals a strong correlation between the concentration of PTEs and emissions discharged from specific localized spots. Notably, higher percentages of potentially toxic elements were observed in locations with bad roads compared to regions with good roads. This suggests that road activities significantly contribute to the elevated presence of PTEs in the region’s particulate matter. This conforms with Miazgowicz [66] reports that road-related anthropogenic activities play a substantial role in influencing the concentration of PTEs in air particles. Vehicular-based emissions have become a major contributor to particulate matter contamination (degradation of air quality) [15]. PM2.5 tends to reduce visibility and acts as a carrier for viruses, bacteria, and heavy metals, posing a significant threat to human health and ecosystems [4, 6].
Spatial Distribution of the PTEs in the Vegetation
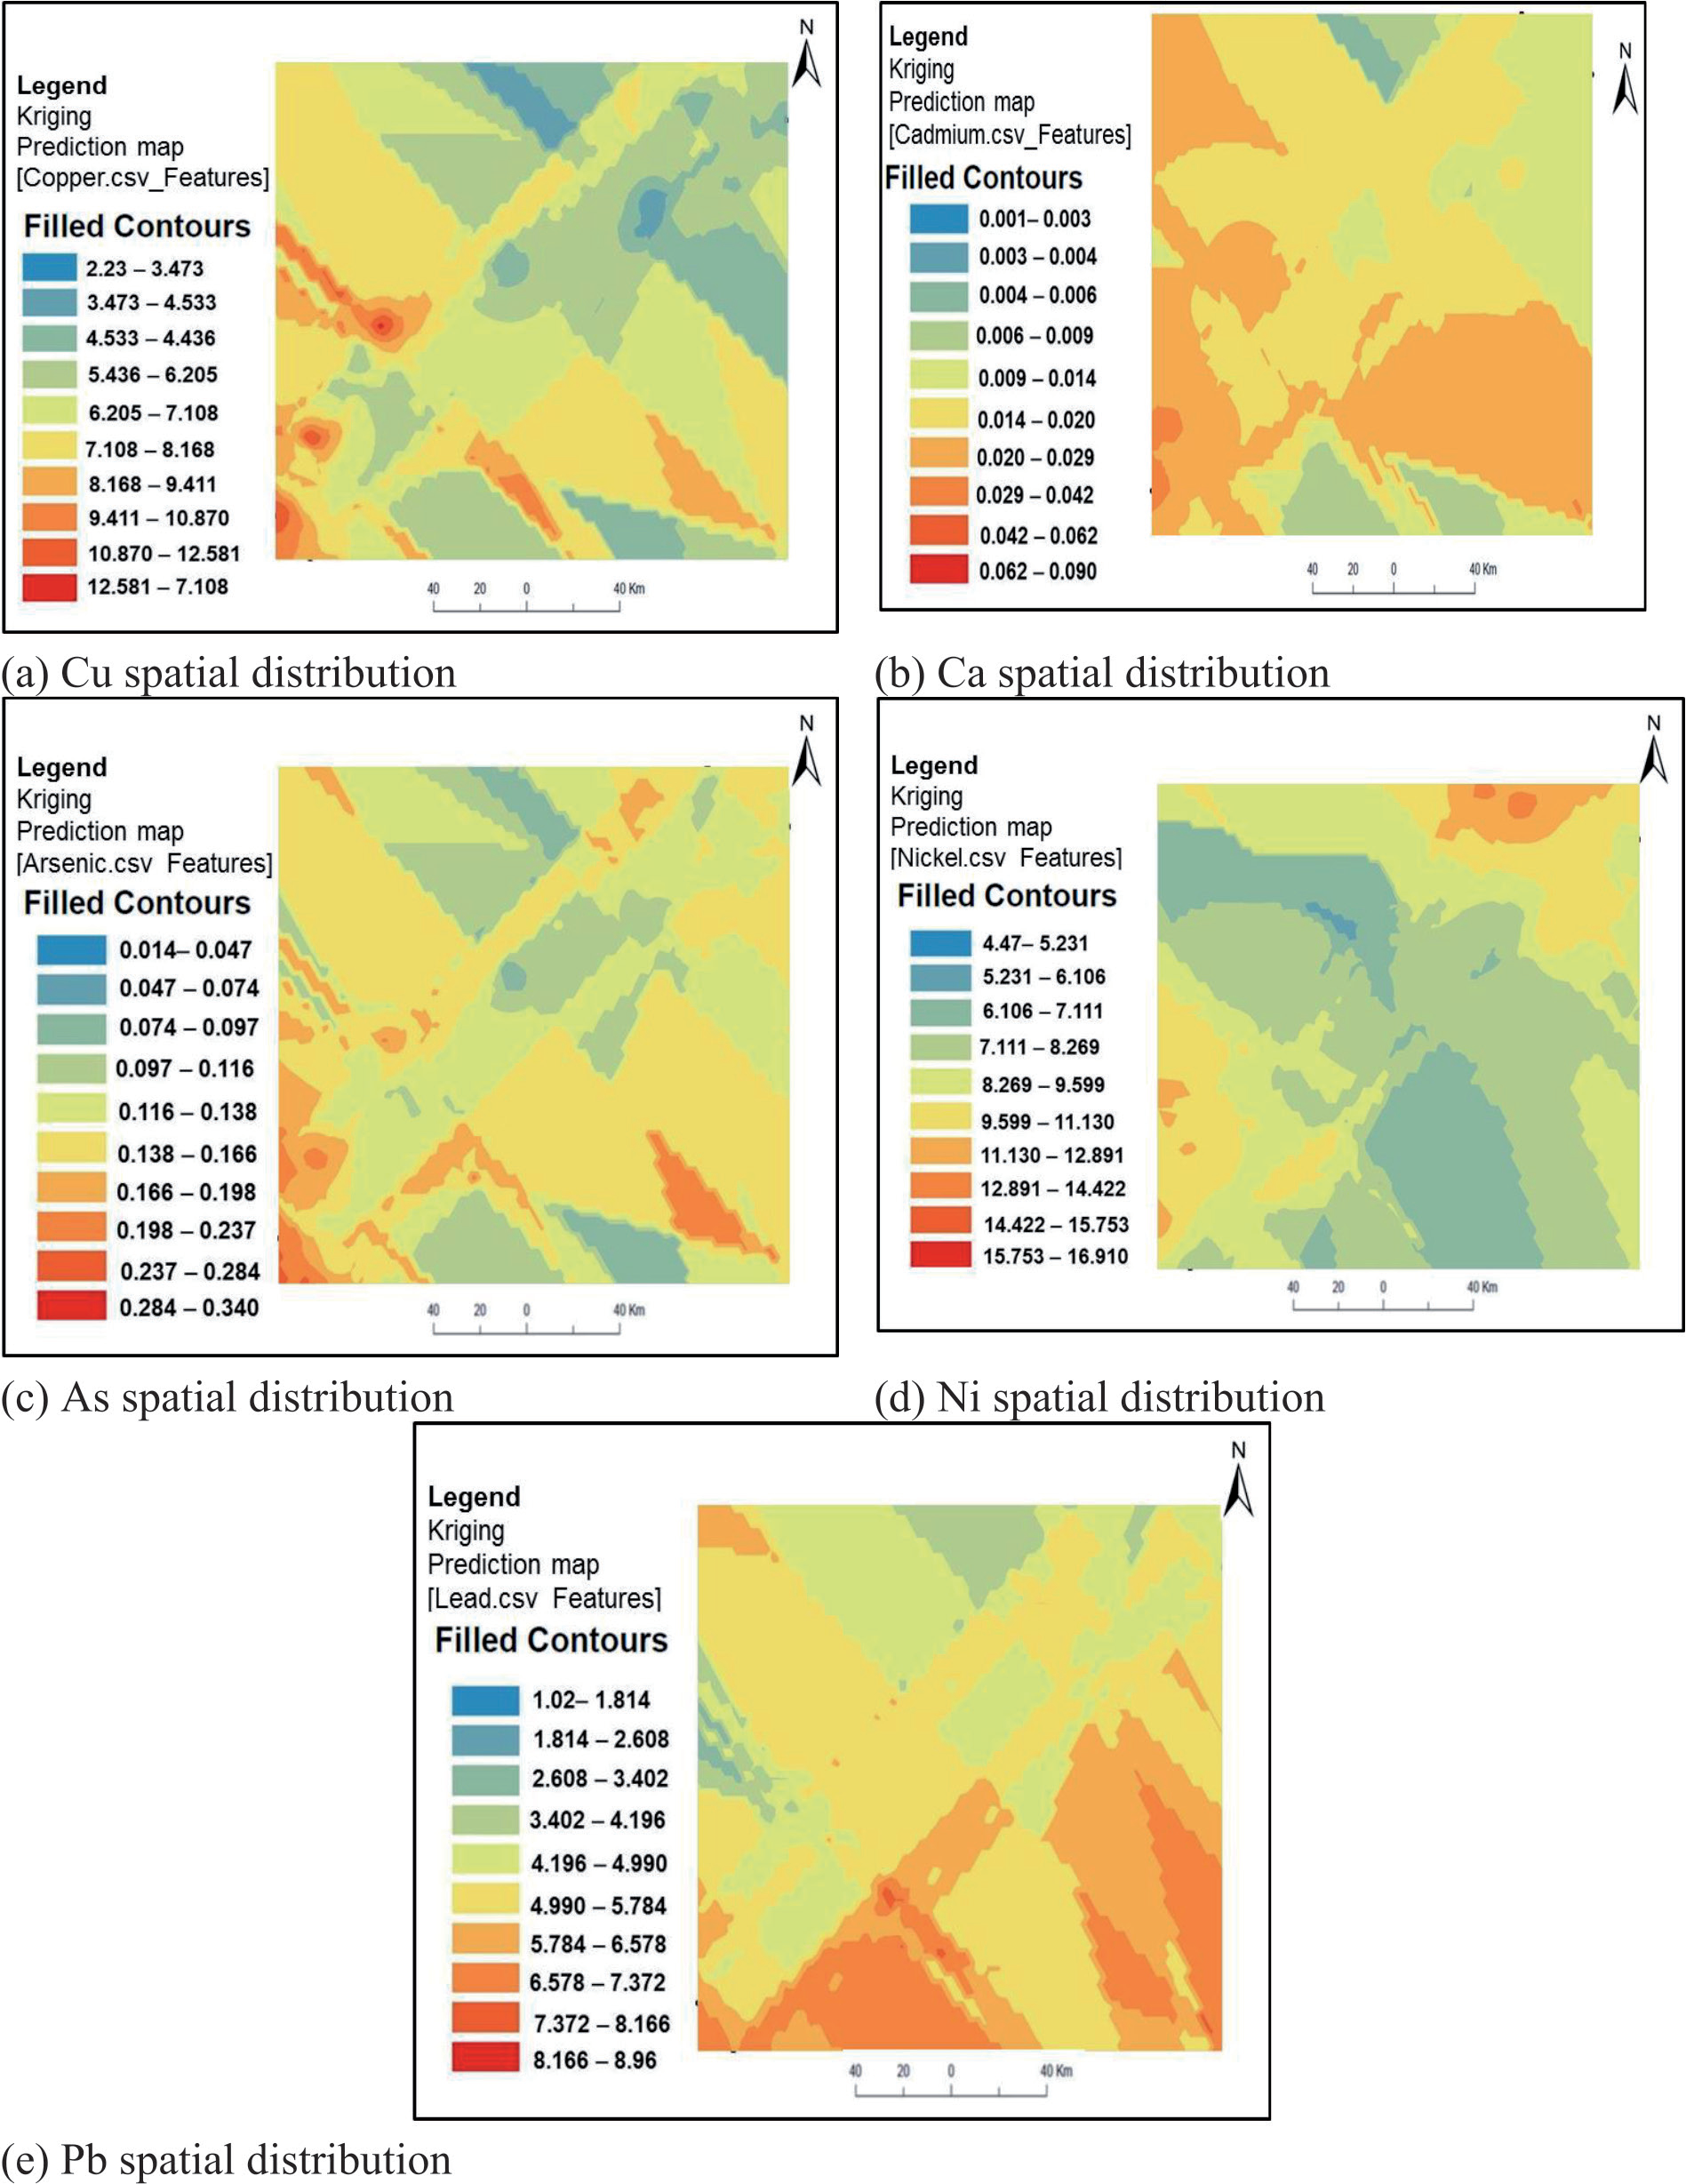
The spatial mappings of the heavy metals concentration in the cashew leaves sampled from the region under investigation are plotted in Fig. 2 (a-f). The copper spatial distribution map presented in Fig. 2a) revealed that copper concentration in the vegetation leaves varied widely across the region. It was noted that the leaves sampled north-eastern and south-western parts of the region recorded the minimum and maximum copper concentration, respectively. The central part of the area displayed moderate copper concentration in the leaves, suggesting a mid-range level of copper content in the vegetation. On the other hand, the cashew plants in the southeastern sub-region recorded a relatively high copper content in their leaves.
It was noted that the cadmium spatial distribution (Fig. 2b) varied significantly across the region. Notably, the southern part of the region displayed a considerably higher cadmium concentration in the vegetation leaves compared to the northern part of the forest. Conversely, in the north-central and northeastern regions, moderate cadmium concentrations were noted in the vegetation leaves. This is an indication that there was a distinct gradient of Cd contamination, with the southern region experiencing elevated levels of the Cd metal. Furthermore, the spatial distribution of As metal in the region is displayed in Fig. 2c), with notable arsenic content variation in the forested area. Specifically, the south-south and north-central parts of the region displayed lower arsenic concentrations in the cashew leaves. In contrast, the southwestern part of the forest exhibited a higher concentration of arsenic in the cashew plants. Remarkably, the central belt of the forest showed a moderate arsenic concentration in the sampled cashew leaves.
Fig. 2d) revealed that the nickel concentration in the cashew leaves increases unevenly from the southern part to the northeastern part of the studied region. Interestingly, the south-eastern and north-western sub-regions exhibited the minimum nickel concentration. This indicates comparatively lower Ni levels in the vegetation in those specific locations. Remarkably, the cashew plants in the southwestern belt of the region studied in this research recorded moderate Ni concentrations. The variation of Pb concentration in the cashew leaves is presented in Fig. 2e). Specifically, the leaves sampled from the southern belt exhibited comparatively higher Pb concentrations than those from the northern belt. Furthermore, the highest concentration of lead was observed in the southeastern part of the region (Fig. 2e). This spatial variability in heavy metal distribution can be attributed to soil composition and potential anthropogenic activities, with vehicular pollution as the principal suspect as sub-regions with poor road conditions tend to have higher heavy metal concentrations [20]. Similar wide spatial variations of the PTE pollution rate in roadside vegetation were observed by Atikpo [55] and Uka [62].
These findings show spatial heterogeneity in the heavy metals distribution across the different locations (belts) within the studied area. The spatial heterogeneity observed in PTE distribution, particularly with higher concentrations in the leaves sampled from areas with proximity to areas with significantly poor road conditions and vehicular activities, is a strong indication that localized sources of environmental pollution were responsible for the cashew leaf contamination. Emissions from automobile activities are major contributors to heavy metal pollution, and high metal concentration of these metals close to major roads is an indication that these pollutants (PTEs) are being deposited and accumulating in the surrounding areas. Similar results were recorded by [6, 67] which stated that there are severe localized environmental implications of emissions from road activities. These implications tend to have adverse effects on the ecosystems, and soil quality, and potentially pose risks to human health. Road transportation stands out as a significant contributor to environmental pollution, with the extent of pollutant emissions contingent on several factors such as road surface conditions, the materials employed in the road construction, traffic volume, and the mechanical health of the vehicles [68].
Physicochemical Composition of the Leaves
The pH Content
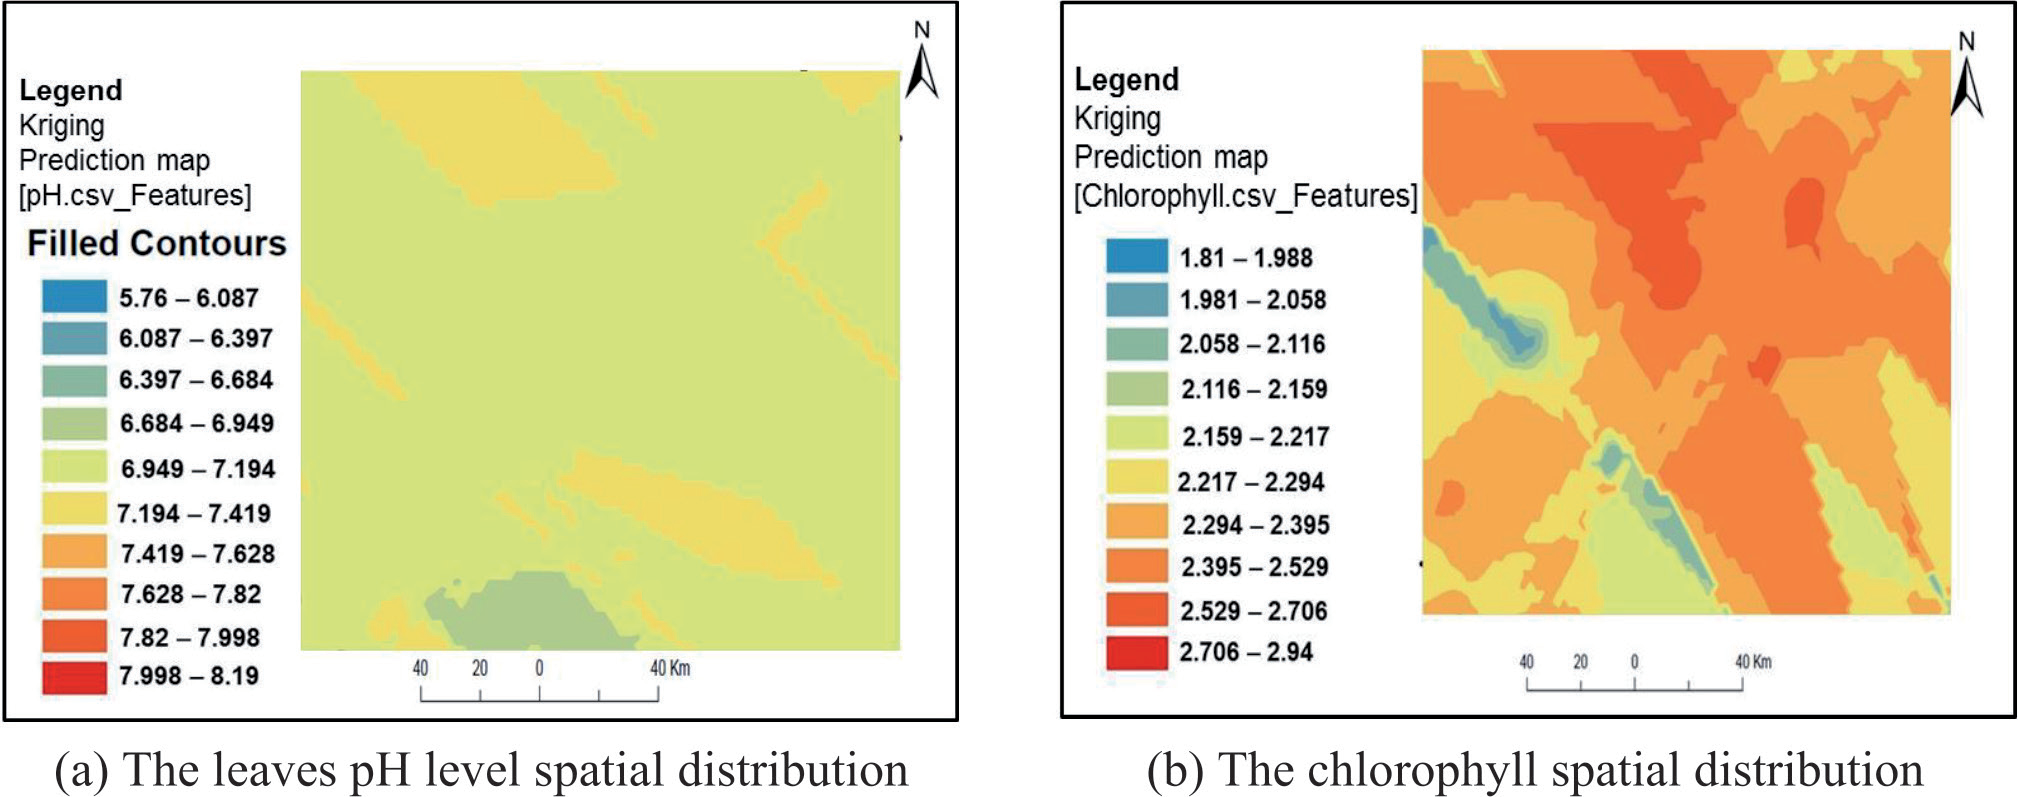
Fig. 3 presents the results of the pH level in the cashew leaves. The leaves’ pH level ranged between 5.75 and 8.19 (mean ~7.13), which is an indication that the pH content of the leaves was around the borderline of neutrality. However, there is some variability in the acidity or alkalinity of the leaves, which can be attributed to the toxicity effect of environmental pollution. Bui [35] reported that vehicular-based pollution had a significant effect on plants’ pH levels, as the pH content of 10 plants sampled from the roadside varied between 5.09 and 6.02. This confirms that particulate matter ecotoxicity can contribute to an increment in the acidity of the plants. Similar observations were made in this study, where leaves collected from areas with higher pollution levels recorded lower pH values. This may negatively impact crop growth performance in the region. Acidic conditions (low pH) tend to inhibit microbial activities and facilitate excessive absorption of trace elements such as aluminum and manganese. This leads to retarded root development and poor uptake of macronutrients [69].
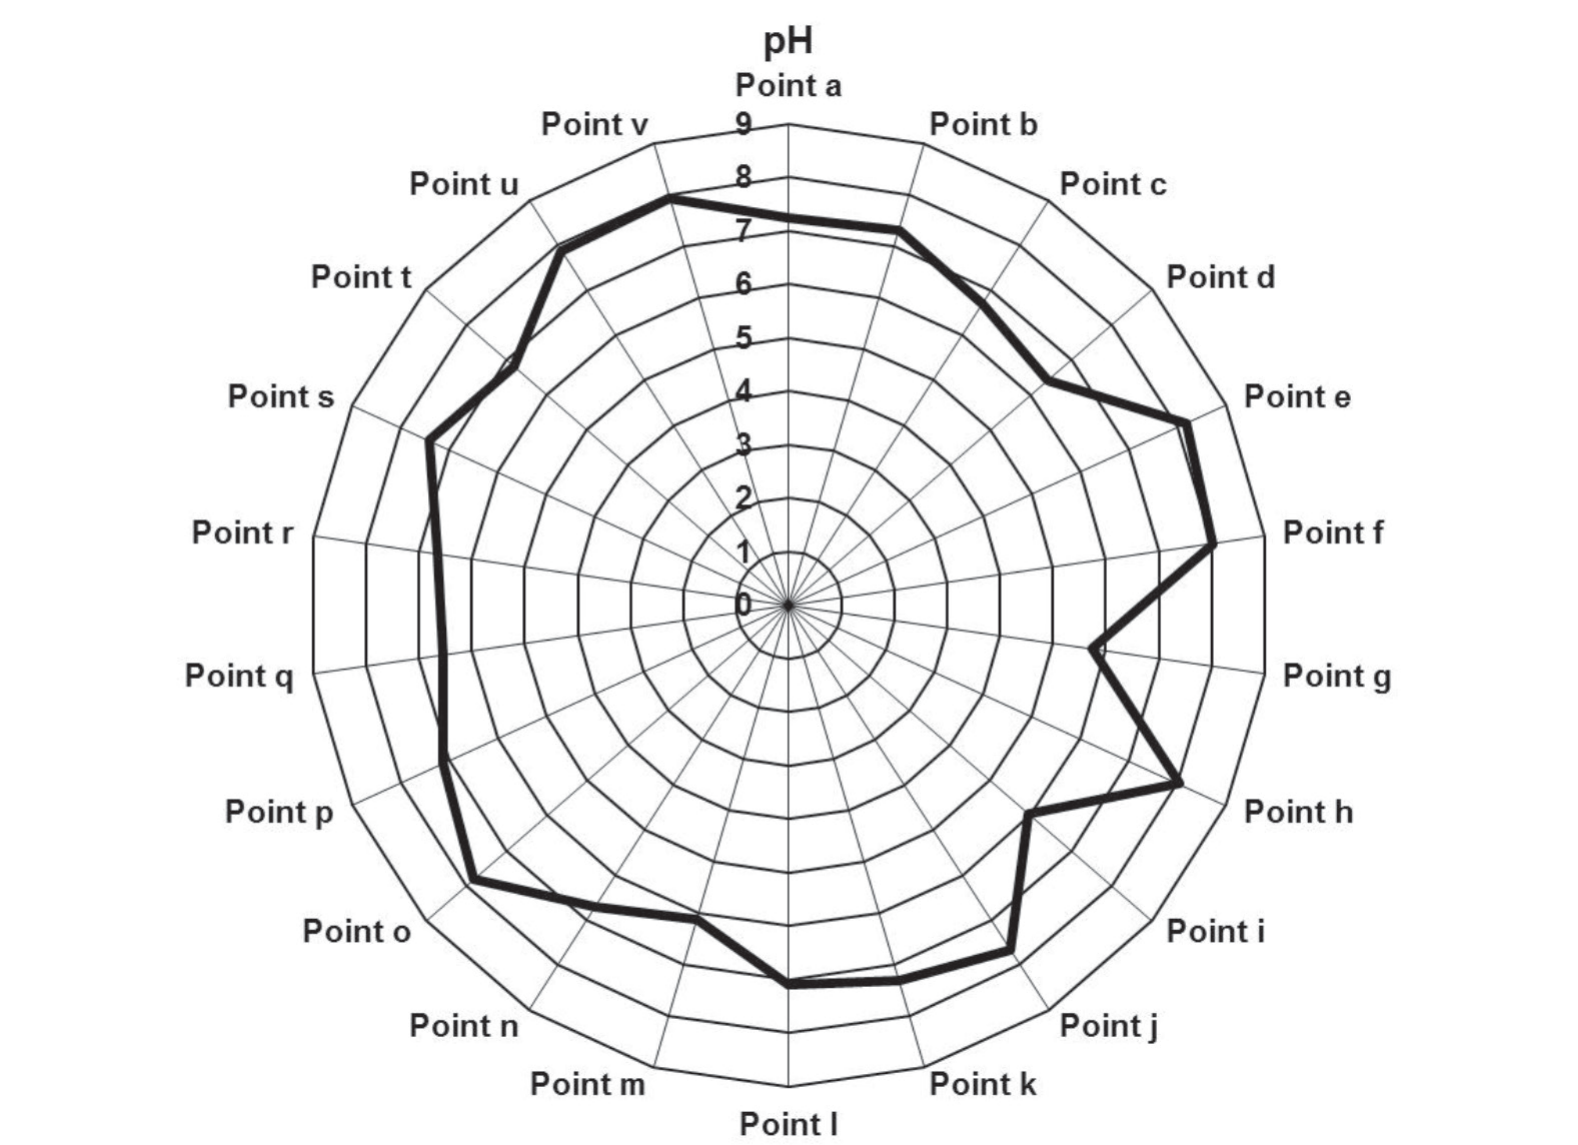
According to Sadia [41], there is a strong negative correlation between plant pH levels and pollution-related traffic emissions. Most plants are sensitive to low pH conditions as it hinders photosynthetic and other physiological actions, through retardation of chlorophyll formation and inhibition of nutrient uptake leading to nutrient deficiencies [70]. Apart from the traffic emission, differences observed in the leaves’ pH content across the regions can be linked to different soil conditions, microbial activities, and other natural pollution sources. Plants’ pH level reflects their environmental stress and area environmental health conditions, caused by acidic or alkaline substances deposition on the plant’s body.
Chlorophyll Content
The results of the chlorophyll content of the cashew leaves sampled from the 22 locations are presented in Fig. 4. Findings obtained from this study revealed that the chlorophyll concentration in the cashew leaves varied from 1.88-2.94 mg/g (mean 2.29 mg/g and skewness 1.0138). The positive skewness of the leaves’ chlorophyll concentration is an indication that there could be specific conditions, which lead to the higher chlorophyll concentrations in the leaves. It was observed from the findings that there was substantial chlorophyll degradation in spatial locations with higher PTE concentration, which can be attributed to the PTE toxicity effect on the plant’s green pigment and high plant pH level. Heavy metal toxicity tends to interfere with the process of chlorophyll formation in green plants, by inhibiting the enzymatic actions involved in chlorophyll synthesis, hence leading to chlorophyll dilapidation in the plant’s leaf system [30].
Furthermore, it was noted that locations where the plants have lower pH levels have significantly higher chlorophyll values, compared to spatial locations where the leaves have higher pH levels. This suggests that there is a strong correlation existed between leaves pH level and its chlorophyll content. This conforms to previous studies conducted by Lefever [71], where the chlorophyll content of Salvia chamelaeagnea leaves was inversely proportional to the pH level. Chlorophyll is a crucial parameter for plant growth and performance, as it is responsible for photosynthesis and absorption of essential nutrients by plants. Therefore, chlorophyll plays a significant influence on the overall appearance and health of plants [72]. Traffic-based pollution affects the affects photosynthetic rates of plants, irrespective of the variety which is linked to alterations in stomatal opening and the ability of plants to assimilate carbon CO2 [73].
Spatial Distribution of the pH and Chlorophyll Levels
Fig. 5 (a-b) provides plots of the spatial variation of the pH and chlorophyll levels in the plant leaves. Fig. 5a) reveals wide spatial distribution in pH conditions of the leaves; however, the leaves sampled from the southern parts tend to have lower pH values. The outcomes of this research also revealed that the cause(s) of the factors responsible for the uneven spatial distribution of the pH levels spread un-uniformly across the area. This is reflected by the wide variation in heavy metals concentration in cashew leaves and PM2.5 levels, as identified by this research. Particulate matter and other gaseous pollution have serious environmental consequences, affecting the pH condition of most plant species. Indeed, pH levels considerably influence several plants’ physiological processes, including stomatal sensitivity and the formation of essential nutrients such as ascorbic acid (vitamin C) [44].
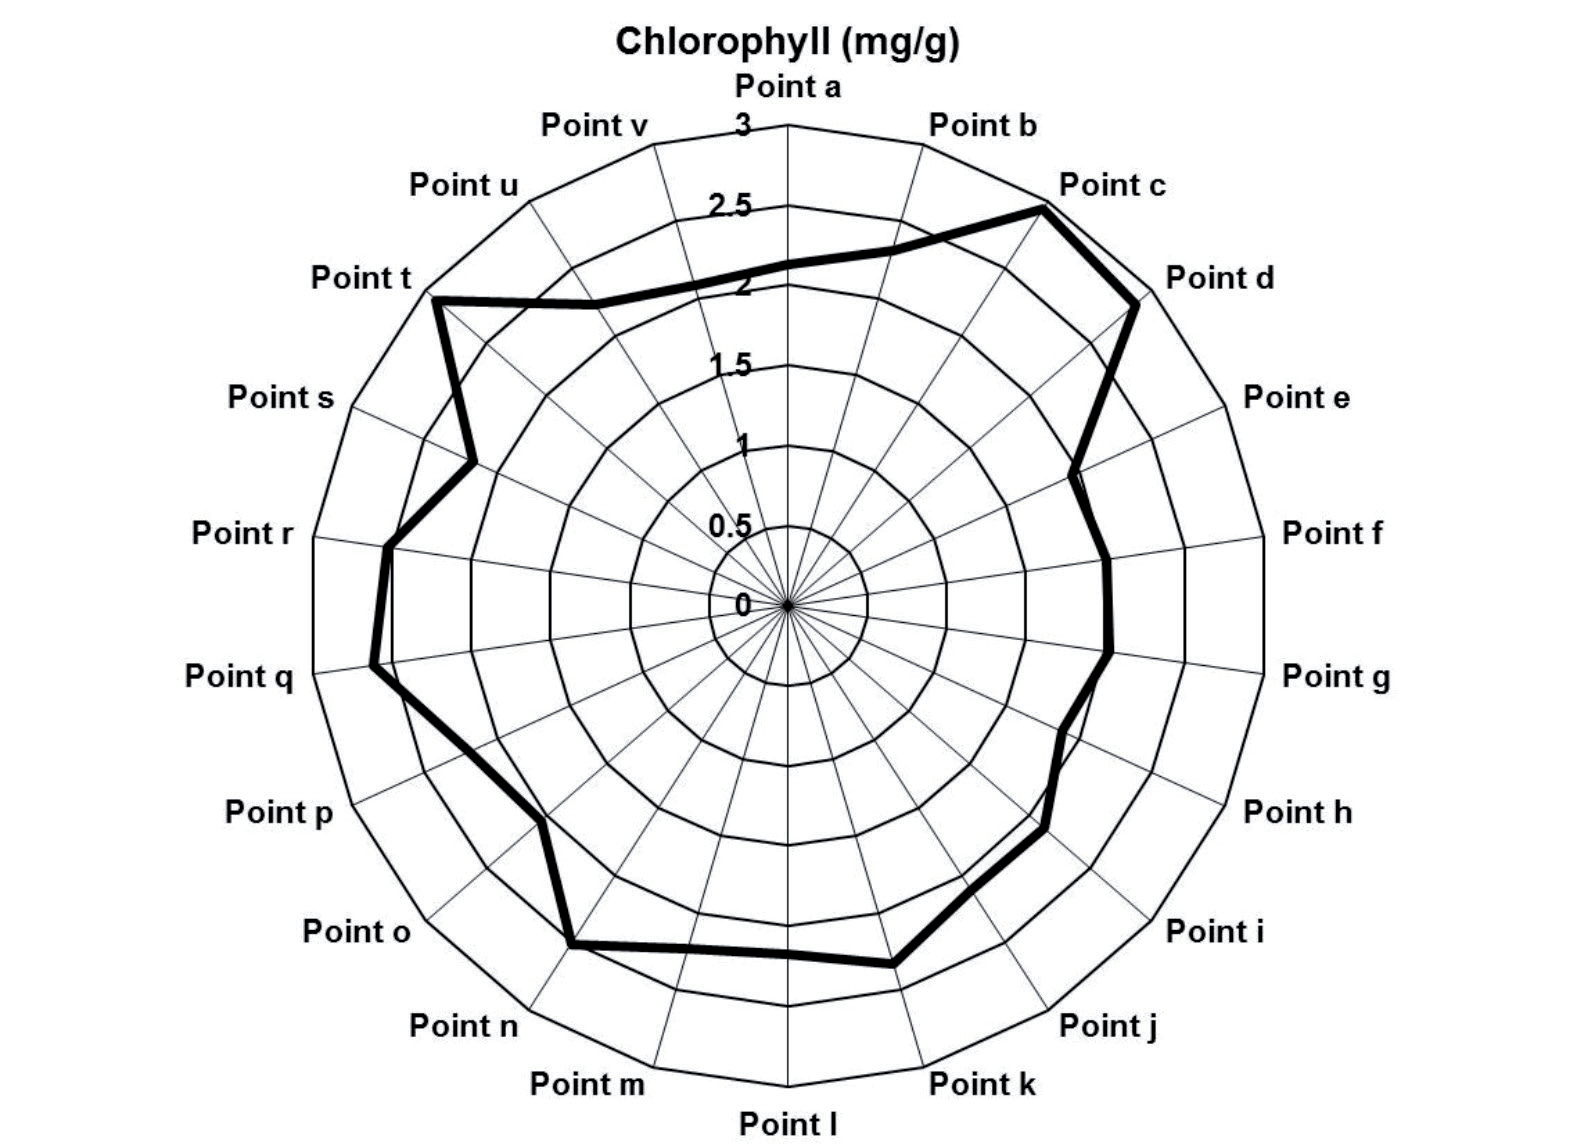
Notably, Fig. 5b) portrayed that the lowest chlorophyll levels were recorded in the leaves sampled from the south-eastern part of the area, while the highest chlorophyll contents were recorded in the leaves sampled from the north-eastern part of the region. It was observed that the northern part of the region had higher chlorophyll levels when compared to the southern part of the region. This is an indication of the variations in the environmental and anthropogenic conditions, such as sunlight and pollution exposure across the studied region. The northern part of the region may have more favorable conditions for photosynthesis and chlorophyll synthesis when compared to the southern part of the region. Excessive accumulation of PTEs in a plant’s body can cause serious alterations in the plants’ biochemical and physiological actions, hence inhibiting photosynthesis and impairing the chlorophyll formation process and cellular respiration [30].
Environmental Pollution Indications
The results of the calculated pollution indices (CF, PLI, EF, and Igeo) of the vegetation and PM2.5 are presented in Table 8. These indices were used to further assess and evaluate the degree of environmental pollution in the area, and provide insight into the pollution degree of each individual metal.
Contamination Factor
Table 8 presents the PTEs’ CF level in the cashew leaves and PM2.5. The CF values of the PM2.5 and vegetation ranged from 1.26 to 11.82, and 1.79 to 6.00, respectively. Based on the contamination factor index rating, PM2.5 has a very high level of Cd pollution, a considerable degree of Hg and Zn pollution, and a moderate level of pollution for arsenic, copper, and nickel. Likewise, the vegetation had a very high pollution degree of Hg and Cu, a considerable degree of pollution for Zn, Cd, and Ni, and a moderate pollution level for As and Pb. It was noted that none of the PTEs demonstrated a minimal pollution level in either the atmospheric particles or cashew leaves.
Pollution Load Index (PLI)
The results presented in Table 10 show that the PLI values for the PM2.5 and cashew leaves were 2.83 and 2.81, respectively. This revealed that both the PM2.5 and cashew leaves have moderate pollution levels. The high PLI values can be attributed to the volume and concentrations of the traffic-related emissions the region received. According to Chen [50], vehicular activities are one of the major sources of heavy metal pollution. PLI helps to provide necessary information about heavy metals’ ecotoxicity. The pollutants emitted from the road surface and vehicles settle in the surrounding environment; hence, affecting the PTEs status of the roadside air, soil, and vegetation [16].
Geoaccumulation Index (Igeo)
The Igeo results indicated that in the air PM, there was no significant trace of Hg and Cd contamination, As pollution varied from non-contamination to moderate contamination, Ni pollution ranged from moderate to strong contamination, Pb pollution was at strong pollution degree, while Cu and Zn pollution varied from strongly to extremely contamination. Similarly, the Igeo results revealed that in the cashew leaves, As, Cd, and Hg recorded non-pollution, Cu, Ni, and Pb pollution varied from moderate to strong contamination degree, while the Zn pollution was at the extreme pollution level. It was noted that in the PM2.5, the Igeo decline in this order Zn>Cu>Pb>Ni>As>Cd>Hg; while in the leaves, the Igeo decrease in this pattern Zn>Cu>Ni >Pb>As>Cd>Hg. These outcomes are an indication that out of the PM2.5 sampled, some samples have no As contamination, and the contamination of Pb, Cu, and Zn in the PM is high enough to cause substantial health and environmental effects. Conversely, the absence of pollution in Cd and Hg (Igeo ≤ 0) indicates that their concentrations fall within permissible limits. Likewise, in the vegetation, the As, Cd and Hg concentrations were below the maximum allowable limits, and they did not pose significant hazards to human health and the ecosystems.
Enrichment Factor (EF)
The enrichment factor results presented in Table 10 show that the PM2.5 had minimal As, Cu, Ni and Pb enrichment, moderate Hg and Zn enrichment, and significant Cd enrichment. Likewise, the vegetation had minimal enrichment of As, Cu, Ni and Pb, moderate enrichment of Zn, and significant enrichment of Hg and Cd. As shown by the EF values, all the PTEs EF were greater than 1, which is an indication that there is an active enrichment of these metals, and anthropogenic actions – probably road and vehicular emissions – were reasonable for the environmental pollution. These findings (based on the pollution indices) are similar to observations made by other researchers [20, 32, 49]. These studies found substantial evidence that particulate emissions from road-based activities can result in serious alterations in ecosystem equilibrium, by increasing the PTEs pollution degree in the air, soil, and vegetation. This alteration has severe health implications for human beings and the well-being of plants and animals. PTEs contamination (toxicity) can cause chronic ailments in human beings, and stunted growth in plants and animals by interfering with their physiological processes [63, 74]. High exposure duct particles with large PTEs content especially, Cd, Hg, and Pb pose serious health risks such as: cardiovascular disorder, cancer, and other respiratory infections [30].
Human Health Implications
Estimated Daily Intake (EDI) and Hazard Quotient (HQ)
The results of the EDI, HQ and HI of the noncarcinogenic risk PTEs are presented in Table 11. As shown by the findings (Table 11), the children and adult EDI’s values ranged from 1.33 x10⁻⁷ to 1.16 x10⁻⁴ µg/kg/day, and 1.19 x10⁻⁷ to 1.05 x10⁻⁴ µg/kg/day, respectively. Generally, the EDI values of the non-carcinogenic PTEs followed this ascending pattern: Hg<Pb<Cu<Zn, signifying that Hg had the lowest EDI degree and Zn recorded the highest EDI degree among all the PTEs evaluated in this study. Similarly, the results revealed that the EDI values recorded for the children category were generally higher than those recorded for the adult age category, irrespective of the PTEs investigated in this research. The research outcomes regarding the EDI values are consistent with the observations made by Martín-Cruz [14], where Zn was identified as one of the predominant metals in particulate matter. Findings obtained from this study confer with previous findings of [2] and Uguru [75], which observed remarkably higher EDI values in children when compared to adults, during their research into food quality. The higher EDI values in children are attributed to their lower body weight and other and different physiological characteristics, though their food intake is usually smaller than adults [76].
Table 10.
Pollution indices of the PM2.5 and cashew leaves.
Table 11.
The EDI, HQ and HI values of the PTEs.
Table 11 further revealed that the HQ values ranged from 1.55 x10⁻⁶ to 1.16 x10⁻⁵, and 1.39 x10⁻⁶ to 1.05 x10⁻⁵ for the children and adults, respectively. Notably, the HQ values followed this ascending order Hg<Cu<Pb <Zn. This signifies that PM inhalation is an efficient absorption route for the assimilation of both harmful and beneficial substances, as these materials can be absorbed more quickly into the bloodstream in gaseous form [77]. Han [78] reported similar observations on the impact of vehicular pollution on health implications. The HQ values recorded in this study were lower than the values reported for similar metals [2].
Hazard Index (HI)
The results of the hazard index (Table 11) depicted that the HI value was higher in the children category (3.84 x10⁻⁵), when compared with the result recorded for the adult category (3.47 x10⁻⁵). Although the HI value for children was relatively higher than for adults, it interestingly remained below the maximum allowable (HI˃1) typically associated with chronic ailments. According to Sakunkoo [2], if the hazard index value of any toxic substance exceeds 1 (HI˃1), its cumulative exposure may pose serious health risk (but noncarcinogenic) to human beings. Similar to this study’s HI results, research conducted by [1, 2, 14] in various geographical locations revealed that PM is loaded with PTEs. However, the risk factors remain low, as most of their HI values are less than 1.
Carcinogenic Risk
The LEDI, CR and TCR values obtained in this research are presented in Table 12. It was noted that the PM2.5 LEDI values varied from 2.80 x10⁻⁷ to 4.41 x10⁻⁵, and 2.54 x10⁻⁷ to 3.98 x10⁻⁵ µg/kg/day for children and adults, respectively. Likewise, the CR values of the PM2.5 ranged from 5.04 x10⁻¹⁰ to 4.30 x10⁻⁸, and 4.57 x10⁻¹⁰ to 3.89 x10⁻⁸ for children and adults, respectively. These LEDI and CR values are similar to the findings of Sakunkoo [2] and Han [78], during their investigation into PTEs poisoning associated with traffic pollution. Furthermore, these findings indicate that As presents the highest cancer risk, whereas Cd has the lowest cancer risk. Similar results were reported by [14], for CR of atmospheric particulate matter sampled from various locations in Spain. People exposed to heavy metal pollution from road activities tend to develop compromised health status [32]. Children are more vulnerable to environmental health hazards, due to their behavioral factors, lower body weight, higher inhalation/ingestion rate to body weight or surface area ratio, and developing physiological systems [79].
Table 12.
The LEDI, CR and TCR values of the potentially toxic elements.
Table 12 shows that the TCR associated with the PTEs for the children and adults age groups were 5.50 x10⁻⁸ and 4.97 x10⁻⁸, respectively, indicating that children are still more prone to cancer risks compared to adults. The TCR value reveals the chances of human beings developing cancer diseases through prolonged exposure to PTEs are very low. CR and TCR values are indicators of the likelihood of developing cancer from PTE toxicity. According to the template of the International Commission on Radiation Protection (ICRP), a TCR value that is less than 1.0 x10⁻⁶ is considered to represent a very low carcinogenic risk [2, 27, 80]. Although the findings indicated that the TCR of the metals is still at a very low level, the concentration of these metals can accumulate over time, thereby increasing their toxicity. Therefore, regulatory and remediation measures should be implemented in this region to reduce the concentration of these PTEs.
Furthermore, the results revealed the effect of the vehicular emissions on agricultural crops, mirrored by the observed effect in the cashew plant, through the inhibition of chlorophyll formation. This is an indication that these emissions (from road surfaces and vehicles) have ecotoxicity potential, which has a detrimental effect on both plant and animal growth performances. Inhibition of chlorophyll formation in plants through ecotoxicity has severe effects on the ecosystems. Apart from retarding plant growth (primary producers in the food chain and web) which will drastic impact on the chain/web and ecosystem dynamics; it will cause serious alteration in the ability of plants to regulate the atmospheric CO2 and oxygen levels through photosynthesis [81]. Additionally, since plants have different levels of resistivity to ecotoxicity, these discharges will create inequality in the biodiversity, causing significant alterations in plant diversity and their community arrangement. Human beings exposed to PM2.5 and PTEs toxicity have the tendency to develop mental deterioration, respiratory disorders, cancer, and circulatory diseases. The highlights of this research go beyond ordinary environmental pollution, as the consequences of traffic emissions’ potential implications for human health, crop productivity, and food security.
Conclusions
This study was conducted to assess the impact of road-related pollution on the environment. The potentially toxic elements (PTEs), pH, and chlorophyll levels in plant and air samples from major highways were analyzed using standard procedures. The PTEs load in PM2.5 and cashew leaves was significantly higher, in samples collected along the roadsides compared to the reference point PTEs concentration. The elevated concentration of PTEs in both vegetation and PM2.5 collected from the roadside, as opposed to the control, confirms that road activities are a significant contributor to environmental pollution. Additionally, it was observed that vehicular pollution led to a noteworthy reduction in the chlorophyll and pH levels of the cashew leaves, highlighting a significant toxicity effect associated with vehicular pollution. The spatial distribution maps revealed a wide and uneven variation in the PTEs concentration in the cashew leaves. Furthermore, the areas characterized by poor road conditions displayed elevated PTEs levels, in contrast to those with well-maintained roads.
Results of pollution indices confirmed that the region’s environment was moderately polluted. In the PM2.5, Cd has the highest contamination factor (CF), while in the vegetation, Cu and Hg have the highest CF values. Similarly, Cd recorded the maximum enrichment factor in both the PM2.5 and cashew leaves. The results of the non-carcinogenic and carcinogenic risk assessments indicated that there are low chances of contracting serious ailments, such as cancer and non-cancer diseases, through the inhalation of PTE-contaminated PM2.5. The presence of toxic heavy metals in the region’s vegetation warrants significant environmental concern. Since PM2.5 transmission occurs through aerosols, wearing an appropriate face mask will reduce the risk of exposure to PM2.5 and, consequently, lower the hazards associated with PTE poisoning.

