

Introduction
With global warming causing increasingly serious impacts on the ecological environment and human society [1], governments and international organizations have proposed goals and measures for carbon reduction and low-carbon development [2–4]. Building a beautiful China is an important goal of the 14th Five Year Plan, and beautiful countryside is an important component of beautiful China. Promoting green development in rural areas is an inevitable choice to achieve the goal of building a beautiful countryside [5]. Therefore, how to promote agricultural and rural emission reduction and carbon sequestration is a practical requirement and top priority for achieving the “dual carbon” goal in the process of implementing the rural revitalization strategy [6].
At present, domestic and foreign scholars or research institutions have conducted some research on low-carbon rural areas. Foreign research mainly focuses on rural energy consumption [7] and carbon emissions caused by agricultural production [8], while existing domestic research mainly focuses on the development path of low-carbon rural areas through modern agriculture and energy transformation. In terms of energy structure transformation, most advocate adopting clean energy sources such as biogas to replace petrochemical energy [9]. In terms of development path, it is mainly recommended to promote the development of low-carbon rural areas through government policy guidance, regulatory construction, financial subsidies, and policy incentives [10]. Foreign research mainly focuses on low-carbon agriculture [11], which includes measuring agricultural carbon emissions through grain yield, research on reducing agricultural carbon emissions, as well as research on grain production efficiency and low-carbon agricultural production technology. In addition, discussions on the definition of low-carbon rural areas [12] and methodological research on the development of low-carbon rural areas continue to emerge [13]. There is still a lack of systematic research on the theoretical system of low-carbon rural development in the research field, and there is also no research on rural or rural carbon emission indicator systems. At the same time, there is a lack of research on low-carbon rural development issues from the perspectives of residents’ livelihood capital, industrial structure, etc.
In addition, the importance of carbon emission accounting lies in its ability to address many complex sustainability issues, with the main purpose of reducing carbon footprint by measuring and monitoring carbon emission levels [14]. Therefore, for practical carbon reduction, the use of carbon accounting can greatly help policymakers make correct decisions for urban and rural development. Comprehensive research cases on regional carbon emissions both domestically and internationally mainly use the emission factor method for calculation now [15–17]. Based on the scale differences of the research areas, it is found that carbon emission accounting research mainly focuses on macro scales such as national and provincial regions, cities, or micro scales such as individual buildings, and there is very little research on carbon emission accounting at the village level.
However, rural areas are an important component of carbon cycling [18], and there are significant differences between them and other environments, such as cities. The carbon cycle in rural areas is influenced by natural and human factors [19], which include climate change, land use change, agricultural activities, deforestation, etc. These factors have a significant impact on the carbon cycling process and outcomes in rural areas, and they have also led to environmental problems in rural areas. By studying the carbon cycle in rural areas, it can better understand the environmental conditions and ecosystem functions of rural areas and also formulate more scientific and effective environmental protection policies. At present, the national scale carbon emission inventory covers a very comprehensive range of emission activity types, but the classification of rural scale research is not detailed enough [20]. For certain emission activities closely related to rural areas, such as agricultural production, the national inventory only stays at the level of land use types, and the emissions from the use of agricultural materials and energy consumption of agricultural machinery in the agricultural production process cannot be measured separately. Therefore, there is an urgent need to refine this type of emission activity. In the consideration of building energy, the national carbon emission inventory does not take into account the regional biomass energy commonly used in rural areas, such as firewood combustion, biogas, etc. [21]. There are still serious deficiencies in rural low-carbon management and research capabilities, as well as weak green and low-carbon awareness.
To solve the above problems, this paper takes rural areas in Guanzhong, Shaanxi Province, as the research object. As the core of Northwest China, the Guanzhong region not only carries a rich historical and cultural heritage, but also has irreplaceable strategic significance in its geographical location [22]. The Guanzhong Plain region is located between the Qinling Mountains and the Loess Plateau. Except for some areas in the southern Qinling Mountains, the terrain in other areas is relatively flat, with an overall trend of high in the west and low in the east. The south is higher than the north, with an average elevation of about 500 meters and a slope mainly concentrated below 2°. Agricultural farmland is mainly concentrated in the water rich Guanzhong Plain and some river valley plain areas.
With the promotion of the “Belt and Road” initiative [23], the Guanzhong region plays an important role in the economic development of Shaanxi Province and even the whole northwest region. It has become an important transportation and economic corridor connecting the eastern coast and western inland of China and even connecting the Eurasian continent. The Guanzhong region will continue to leverage its unique geographical, economic, and cultural advantages, which continuously promote comprehensive socio-economic development. They also pay attention to ecological environment protection and sustainable development, which makes new and greater contributions to building a more prosperous and strong society.
As a result, based on the analysis of the characteristics of different carbon balance zones in Guanzhong, a village carbon emission accounting and prediction model is developed. The Shenhe Village is also taken as an example; a detailed analysis is conducted on its villages, evaluating the performance of different types of villages in carbon emissions and carbon sinks and proposing targeted low-carbon development strategies. It provides a reference value for low-carbon development and ecological civilization construction in rural areas under the dual carbon background.
Methods
Data Sources
The data types and sources used in this study are shown in Table 1 [24].
Table 1.
Data Description.
Rural Carbon Source (Sink) Inventories
The emission sources of IPCC [25] are used as references, and the current situations of rural areas in the Guanzhong region are also taken into account. Table 2 shows a list of rural carbon sources (sinks) in the Guanzhong region.
From Table 2, it can be seen that A-level targets are carbon sources and carbon sinks, respectively. There are four B-level emission (absorption) factors, and the emission (absorption) factors are used to quantify the activity coefficient of production or consumption activities that lead to greenhouse gas emissions, which represent the greenhouse gas emissions per unit of production or consumption activities [26]. According to the IPCC’s assumption, it is assumed that the carbon emission coefficient of a certain energy source is fixed and unchanging. Carbon sink absorption is mainly considered soil carbon sequestration of cultivated land throughout the life cycle of crop growth and in carbon absorption in the characteristic forestry and fruit industry [27]. The carbon sink absorption factor is the ecological environment. There are three emission factors for carbon emissions: economic industries, building units, and infrastructure. Each B-level factor has 1~4 carbon sources (sinks), so there are a total of 19 C-level carbon emission sources (sinks). The definitions of activity levels in the IPCC national carbon emission inventory are used as references, and also combines with other literature, there are 26 corresponding activity level data for each emission source (sink) that were obtained. The specific evaluation factors need to be sorted and integrated, according to the management division of local government functional departments and the process methods of village planning.
Carbon Balance Zoning Standards
Regional carbon balance refers to the process of reducing the total amount of regional carbon emissions and increasing the carbon sink capacity of ecosystems within a certain administrative region, watershed, ecological function zone, or economic zone so that the total amount of carbon emissions and the scale of carbon sink absorption and storage are equivalent in a certain statistical period, achieving dynamic balance [28]. In this study, carbon balance is a concept and development goal, and in the specific delineation of carbon balance zones in counties, each balance zone cannot fully achieve carbon balance. The construction of carbon balance zoning indicators should comprehensively consider the ecosystem and economic activities. The carbon compensation rate and average carbon emission intensity are used to delineate carbon balance zoning in this paper.
Carbon Compensation Rate
The carbon compensation rate is the ratio of carbon absorption to carbon emissions in a certain region, which reflects the size of the region’s carbon sink capacity. It was calculated using Equation (1) [29]:
where Ccom is the carbon compensation rate, Cs is the carbon absorption of a certain region, and Ce is the carbon emissions of a certain region.
Ground Average Carbon Emission Intensity
The average carbon emission intensity per unit area represents the amount of carbon emissions generated by production activities, which is calculated by using Equation (2) [30]:
where L is the average carbon emission intensity per region, Ce is the carbon emissions of a certain region, and S is the area of a certain area.
Table 2.
Rural carbon source (sink) inventories.
Classification Criteria
The two carbon balance indicators of carbon compensation rate and average carbon emission intensity are taken into consideration, and the space is divided into carbon intensity control areas, low carbon optimization areas, carbon balance areas, and carbon sink functional areas [31]. The average carbon emission intensity of the land is repeatedly explored and verified through threshold testing, with the criterion of maximizing the differentiation between medium and low carbon areas (cultivated land) and high carbon areas (construction land, industrial land, and mining land). Carbon compensation rate refers to relevant literature and materials [32]. The carbon balance zoning standards are shown in Table 3.
Carbon intensity control areas refer to areas with high carbon emissions and spatial intensity, high human life and production intensity, high energy consumption, and weak carbon sequestration capacity. The carbon compensation rate in the carbon intensity control areas is less than 0.8, and the average carbon emission intensity is greater than or equal to 3 tons/hectare [33]. Low carbon optimization areas refer to areas with low energy consumption, carbon emissions, and carbon emission spatial intensity, as well as low human life and production intensity. The carbon compensation rate in low-carbon optimization areas is less than 0.8, and the average carbon emission intensity per hectare is less than 3 tons. Carbon balance areas refer to areas where energy consumption, carbon emissions, and spatial intensity of carbon emissions are low, human life and production intensity are low, and carbon sources and sinks generally maintain dynamic balance. The carbon compensation rate in a carbon balance zone is between 0.8 and 1.2. Carbon sink functional areas refer to areas where carbon sinks are absolutely greater than carbon emissions, with a carbon compensation rate greater than or equal to 1.2.
Table 3.
Carbon balance zoning standards [28].
| Partition indicators | Carbon intensity control areas | Low carbon optimization areas | Carbon balance areas | Carbon sink functional areas |
|---|---|---|---|---|
| Ccom | <0.8 | <0.8 | 0.8~1.2 | ≥1.2 |
| L (t/ha) | ≥3 | <3 | - | - |
Model Establishment Follows Principles [34]
Regional characteristics: It should conform to the geographical and socio-economic characteristics of the zoning, which ensures that carbon accounting work is consistent with the actual situation.
Data availability: It is necessary to ensure that accurate activity level data can be obtained for the calculation and monitoring of carbon emissions.
Model operability: The model should simplify design, be easy to understand and implement, facilitate tracking and accounting by local governments and communities while ensuring accuracy and validity, and facilitate rapid response to emission reduction measures and policy changes.
Accounting accuracy: The accuracy and representativeness of the emission factors of relevant activities should be considered to ensure the scientificity of the accounting results.
Emission reduction potential: Priority should be given to emission sources with potential in carbon reduction policies, such as industrial production and agricultural activities, to achieve effective control of carbon emissions.
Accounting continuity: When selecting inventory items, it is necessary to consider the continuity of future tracking and monitoring to ensure long-term carbon emission management and assessment.
By analyzing and selecting inventory items, the carbon accounting work of each carbon balance zone can be more refined and systematic. Industrial zones focus on industrial energy use and production process emissions; low-carbon optimization zones focus on energy consumption of residents and service industry buildings; carbon balance zones focus on agricultural production activities and land management; and carbon sink functional zones focus on the carbon sink potential of the natural environment.
Carbon Emission Accounting Model
Carbon Intensity Control Areas
(1) Carbon emission inventory:
Industrial production (C8) is the most important activity in this region, which is directly related to a large amount of energy consumption and carbon emissions. Industrial output value (D11) is an important indicator for measuring the scale of industrial activities, which can reflect the contribution of industrial production to carbon emissions. The choice of “industrial production commodity energy use” is because energy consumption is the most direct source of carbon emissions in this region.
Direct emissions (C9) from the cement lime production process are also an important source of carbon emissions. Cement and lime are the basic materials in the construction industry, and a large amount of carbon dioxide is released during the production process. The annual production (D12) data can accurately calculate the total emissions generated from this.
(2) Accounting model:
Model framework:
– Direct emissions = industrial product production × emission coefficients for each product production
– Indirect emissions = (electricity consumption × electricity emission coefficient) + (fuel consumption × fuel emission coefficient)
– Accounting list items:
– Industrial Product Production (D11)
– Annual production of cement and lime (D12)
– Industrial electricity consumption (D13)
– Industrial LPG consumption (D14)
Low Carbon Optimization Areas
(1)Carbon emission inventory
Building energy consumption (C12) reflects the energy consumption of residential and commercial buildings. Electricity consumption (D16) and LPG consumption (D17) are key indicators for measuring building energy consumption and formulating energy-saving and emission reduction strategies.
The use of straw firewood (C13), especially in rural areas, is often used as a traditional energy source for heating and cooking. Understanding the usage of straw and firewood (D19) can help evaluate the contribution of traditional energy use to carbon emissions and seek alternative energy sources.
(2) Accounting model
Model framework:
– Building energy emissions = (electricity consumption × electricity emission coefficient) + (LPG consumption × LPG emission coefficient)
– Traffic emissions = (gasoline consumption × gasoline emission coefficient) + (diesel consumption × diesel emission coefficient)
– Accounting list items:
– Residential electricity consumption (D16)
– Residential LPG consumption (D17)
– Residential coal consumption (D18)
– Residential straw and firewood usage (D19)
– Accumulated usage time of biogas by residents (D20)
– Residential tap water usage (D21)
– The usage of transportation gasoline (D22)
– The usage of transportation diesel (D23 D24)
– Garbage disposal (D25)
– Wastewater treatment (D26)
Carbon Balance Areas
(1) Carbon emission inventory
The management of arable land (C4) and the consumption of agricultural materials (C5) are directly related to the emissions generated by agricultural activities. The amount of crop straw returned to the field (D4) is an important aspect of soil organic carbon management, while the use of fertilizers (D5) and pesticides (D6) is closely related to carbon emissions from farmland.
The commodity energy use (C6) of agricultural behavior includes the electricity consumption for irrigation (D8) and the diesel consumption of agricultural machinery (D9), which reflect the degree of modernization and energy consumption in agricultural production.
(2) Accounting model
Model framework:
– Agricultural production emissions = (fertilizer usage × fertilizer emission coefficient) + (pesticide usage × pesticide emission coefficient)
– Land management absorption = cultivated land area × cultivated land carbon sequestration capacity
– Accounting list items:
– Fertilizer usage (D5)
– Pesticide usage (D6)
– Agricultural film usage (D7)
– Electricity consumption for irrigation (D8)
– Diesel usage of agricultural machinery (D9)
– Tillage area (D10)
Carbon sink functional areas
(1) Carbon emission inventory
Forests, grasslands, and wetlands in the natural environment (C1), C2, and C3 are the main carbon sinks in such areas. The forest area (D1), grassland area (D2), and wetland area (D3) are directly related to the carbon absorption capacity of a region, and these ecosystems not only store carbon, but are also important components of biodiversity.
(2) Accounting model
Model construction principle: The ecosystem carbon sink model emphasizes the natural environment’s carbon sequestration capacity, especially the carbon absorption of ecosystems such as forests, grasslands, and wetlands. The model needs to quantify the balance of these ecosystems in carbon sequestration and release processes.
Model framework:
Results and Discussion
Case Analysis
Shenhe Village is selected as the research object, which is located in the southwest of Tongchuan New Area, 66 kilometers away from Xi’an City. There is the Baomao Expressway passing through the northeast of the village area, with convenient transportation. It is adjacent to Pingdu Village to the north, Niucun Shanglou Village to the west, and Yuhuangge Village to the east [35]. There are 3166 people and 798 households in the village, with a permanent population of 2000. The per capita annual income in rural areas is 15000 rmb. The research was conducted in December 2023, and the basic information of the questionnaire survey is shown in Table 4.
Usually, it is necessary to determine an approximate value or use sample indicators instead based on past research on similar populations. The sample indicator can use P = 0.5, as the variance is maximum at this point. The higher the proportion of sampled individuals, the higher the confidence level of the research results. Therefore, based on the actual situation of the case village, while ensuring a confidence level above 90%, as many household surveys were conducted as possible to make the results more authentic and effective.
Carbon Emission Accounting and Characteristics
The main industries in Shenhe Village are cherry, apple, and lotus cultivation. The planting areas are 100 mu, 300–400 mu, and 800–900 mu, respectively. The total area of cultivated land, gardens, forests, grasslands, and agricultural facility construction land is 487.59 hectares, accounting for 82.61%. The total construction land area of Shenhe Village is 94.94 hectares, accounting for 16.09% of the total village area. Among them, the village land area is 61.42 hectares, accounting for 10.41% of the total village area. The current land and water area of Shenhe Village is 7.51 hectares, accounting for 1.27% of the total area of the village. Administrative management: there is one Shenhe Village committee, covering an area of 0.11 hectares. The original village committee was built and unused, covering an area of 0.04 hectares. It is equipped with a fitness square and a cultural activity room. Education facilities: There is Abaozhai Primary and Secondary School in the new district of Tongchuan City, with a main building of three floors and an area of 1.41 hectares. There are 400-500 students on campus from five surrounding villages: Pingdu Village, Yuhuangge Village, Shanggaonian, Renjiazhuang, and Shenhe Village. There are two private kindergartens in the village, covering an area of 200 square meters, with 40-50 students enrolled. Cultural activities: There is one cultural activity room in the village, located in the idle Shenhe Village Committee; Sports and Fitness: There are two fitness squares in the village, located respectively in the Shenhe Village Committee (0.17 hectares) and the Abaozhai Village Group. Medical and Health: There is one Shenhe Health Room, covering an area of 150 square meters. Social welfare: There are no elderly care facilities in the village. Commercial services: There are more than 10 convenient small shops in the village, all arranged in conjunction with the village’s residential land; 2 farmhouses, 1 Anhe small courtyard is in long-term operation, and 1 coarse tea and light rice tourism peak season is open; 2 restaurants, 2 e-commerce centers, and 2 express delivery points. There is one folk snack city with good quality commercial street buildings, including gatehouses, blocks, accommodations, and parking lots. It is located in the Qianshenhe Village group and was built from 2014 to 2015. During the peak season, the city attracts an average of 10000 visitors per day. It has been closed since 2018 and is currently idle. Village enterprise: (1) Shenhe T8 Art Zone (formerly Shenhe Village Paper Mill), covering an area of 3.7 hectares. Renting a factory for sculpture creation by teachers and students of Xi’an Academy of Fine Arts, with an annual rental income of 200000 yuan. Two abandoned brick factories are used for mining purposes. The land area is 2.76 hectares and 1.28 hectares, respectively. The southeastern part of the village is occupied by Tongchuan Ruicheng Industrial Co., Ltd., and the land ownership belongs to Yuhuangge Village.
Table 4.
Basic information.
| Village | Total population | Total number of households | Number of questionnaires | Number of valid questionnaires | Effective questionnaire involves population | Sampling rate |
|---|---|---|---|---|---|---|
| Shenhe | 3166 | 798 | 76 | 76 | 380 | 9.5% |
In addition, the road conditions in Shenhe Village are good, and there are dedicated roads for Shenhe Xianggu tourism and observation trails built. Gas coverage, 3 wells, and water supply network connection to the new area. Drainage mainly involves a combination of pipe networks and underground channels [36]. Full coverage of electricity and telecommunications, with heating mainly using electricity or natural gas, achieving coal to electricity conversion. There are two public toilets in the village, one located in the village committee and the other as a tourist toilet, covering an area of 0.05 hectares.
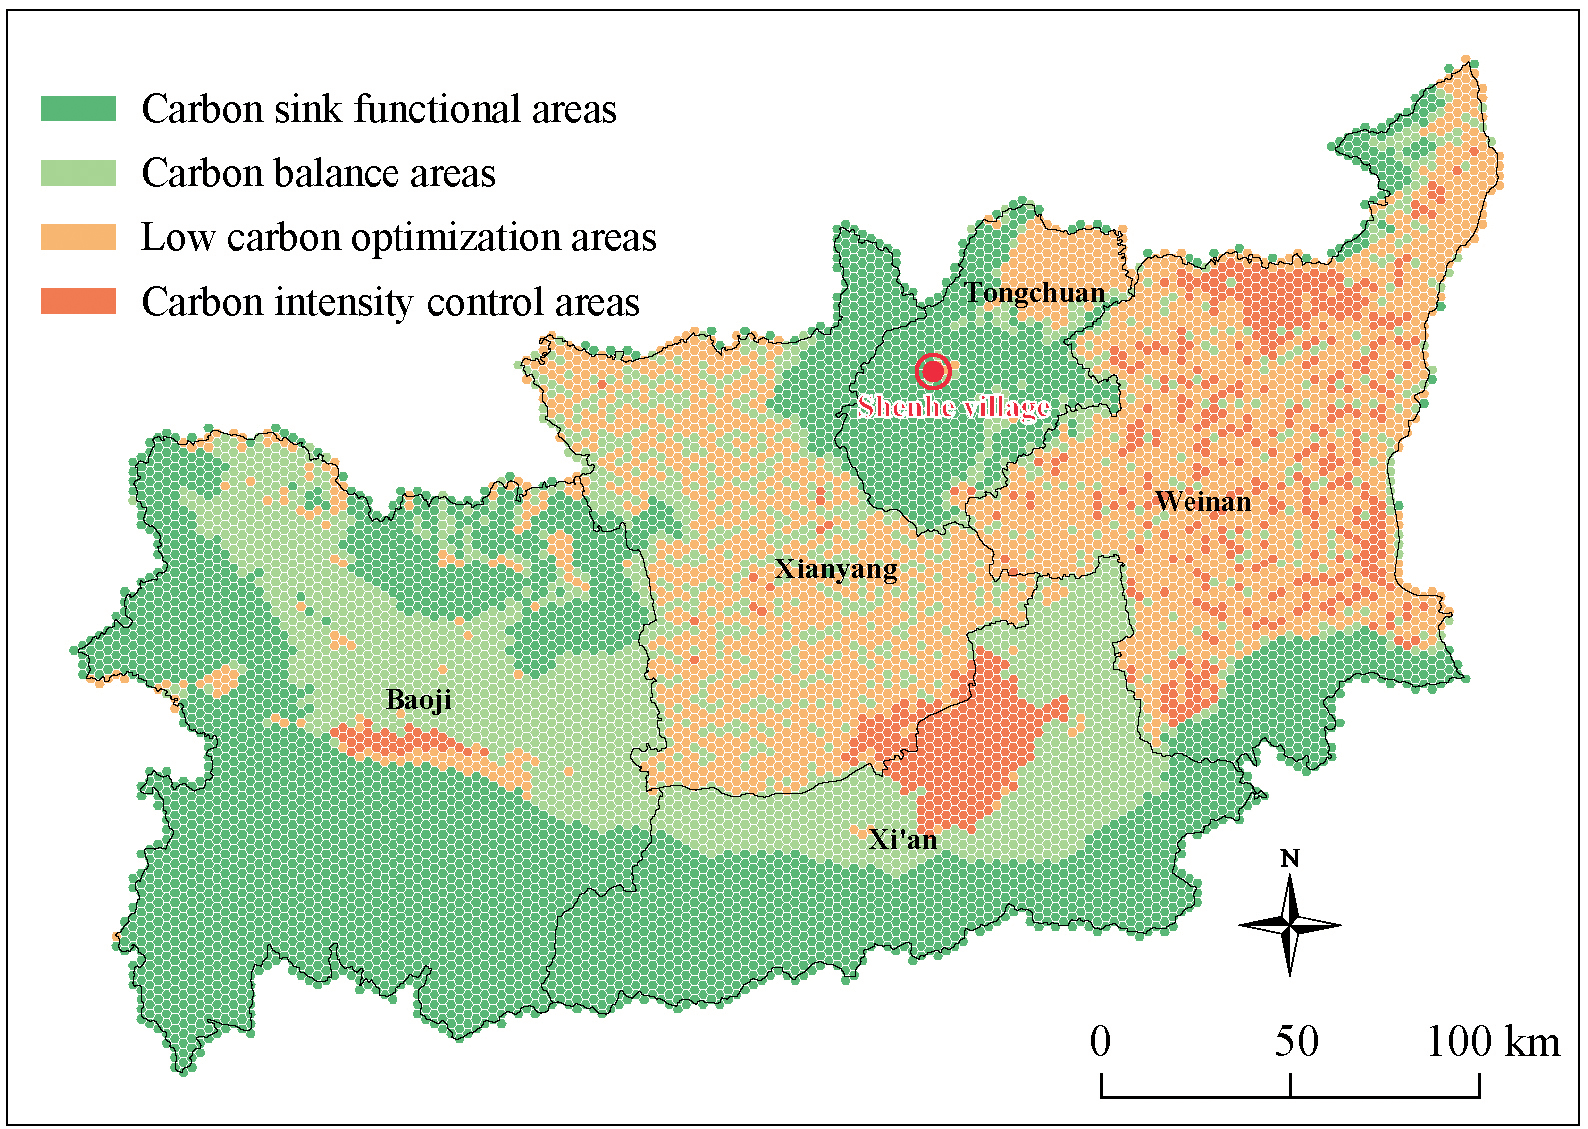
The zoning of different carbon intensity control areas in Shenhe Village is shown in Fig. 1.
From Fig. 1, it can be seen that the carbon sink functional areas in the entire Guanzhong region are the majority, accounting for 41.6%. Next followed by the low carbon optimization areas, which account for 26.5%. The next was followed by the carbon balance areas, which account for 24.6%. Finally are the carbon intensity control areas, which account for 7.3%. Among them, Shenhe Village is located in the southwest of Tongchuan New Area, which belongs to the low carbon optimization areas. It is mainly related to the surrounding environment and local industries [37]. However, there are certain differences between Shenhe Village and the carbon sink functional areas as a whole, which has reference significance for how to optimize the carbon structure distribution of Shenhe Village in the future.
Village Survey Results
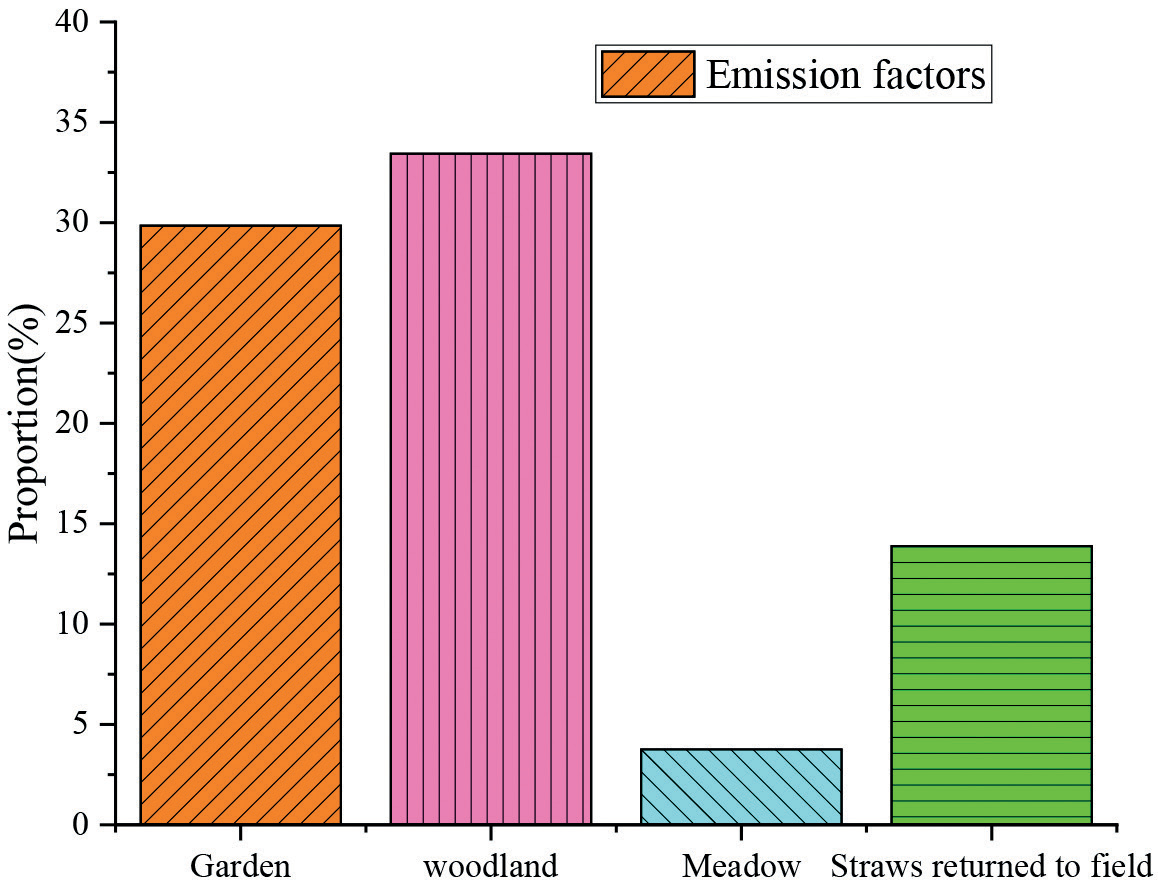
The cultivated land area in 2023 is as follows according to research statistics: woodland area is 197.22 ha; meadow area is 22.19 ha; garden area is 176.06 ha; and water area is 7.51 ha. The village carbon sink is shown in Fig. 2.
It can be seen from Fig. 2 woodland accounts for the majority in Shenhe Village, which accounts for 33.4%. Next followed by garden, with 29.9%. The next, followed by straws returned to the field, with 13.9%. Then finally meadow, with 3.8%. It can be seen that non construction land accounts for 80.9%, while the remaining 19.1% is for construction land. Therefore, overall, Shenhe Village’s carbon sink is higher than its carbon emissions, and the specific carbon sink factors and their proportions are shown in Table 5.
Due to the lack of statistical data from government management departments on the amount of agricultural materials used, it is difficult to conduct actual measurements and research on the amount of agricultural materials used. The average amount of agricultural materials used in different types of farmland has been estimated, and the estimated results are shown in Table 6.
Carbon Emission Calculation
According to the research data and statistical calculations, the carbon sink of the ecological environment in Shenhe Village in 2023 can be obtained as shown in Table 7. In 2023, the CO2 concentration in Shenhe Village was 467.0633 tons. The specific distribution is shown in Table 7.
The calculation results for various carbon emissions are shown in Table 8.
From Table 8, it can be seen that among the six agricultural production activities, the CO2 emissions from the use of fertilizers are 115.678 tons, which account for over 46% of all agricultural carbon emissions, ranking first. Next, the utilization of pesticides and agricultural films results in significant CO2 emissions, which account for 33.2856 tons and 77.6691 tons, respectively, and account for approximately 13.25% and 30.94% of all agricultural carbon emissions. Moreover, different tillage methods not only have a direct impact on carbon emissions [38], but also indirectly affect the carbon emissions of agricultural production due to the different consumption of fertilizers and pesticides [39]. Therefore, it is necessary to consider using green manure and straw instead of chemical fertilizers, using natural enemies and crop rotation instead of pesticides, using less tillage and no tillage instead of tillage, and adopting sustainable agricultural operations to reduce CO2 emissions [40].
Table 5.
Carbon emission intensity of each city.
Table 6.
Estimated results of annual average usage of agricultural materials.
Table 7.
Carbon sequestration.
Table 8.
Carbon emission.
Conclusions
The Guanzhong area of Shaanxi Province was selected as the research object in this paper. The rural carbon emission accounting system and different types of carbon emission accounting models were taken into consideration, discussed and analyzed, and also conducted in-depth research using Shenhe Village as an example. The main conclusions are summarized as follows:
1. Through the construction of a carbon emission accounting model, accurate carbon emission calculations were successfully carried out for villages in different carbon balance zones in the Guanzhong region. The accounting results showed that village carbon emissions are closely related to regional economic activities and energy use.
2. The CO2 concentration in Shenhe Village was 467.0633 tons in 2023. Among the six agricultural production activities, the CO2 emissions from the use of fertilizers are 115.678 tons, which account for over 46% of all agricultural carbon emissions, ranking first. Next, the utilization of pesticides and agricultural films results in significant CO2 emissions, which account for 33.2856 tons and 77.6691 tons, respectively, and account for approximately 13.25% and 30.94% of all agricultural carbon emissions.
3. Different tillage methods not only have a direct impact on carbon emissions, but also indirectly affect the carbon emissions of agricultural production due to the different consumption of fertilizers and pesticides. It is recommended to adopt sustainable agricultural operations to reduce CO2 emissions. It provides methods and reference value for low-carbon development in rural areas.

