


Introduction
Rice is one of the mainstay commodities in Indonesia, serving as a staple food and playing a crucial role in the economy by providing income, creating jobs, alleviating poverty, and enhancing food security. In 2023, Indonesia’s rice production was approximately 53.63 million tons of dry milled rice (DMR), with every ton of DMR generating 1.5 tons of rice straw. In Jambi Province, the rice harvest area is estimated to reach 61.38 thousand hectares, producing around 274.56 thousand tons of DMR [1]. Typically, farmers burn the rice straw on agricultural land, with only a small portion used as animal feed. The burning of rice straw releases particles (PM2.5, PM10) and greenhouse gases (CO, SOx, NOx) into the atmosphere, adversely affecting the environment and human health. This issue requires more in-depth study, especially considering that rice cultivation and biomass burning contribute 97% and 92% to the greenhouse gas (GHG) effect, respectively, with methane emissions from rice fields estimated at over 170 Tg per year [2–4].
Numerous studies have explored the valorization of rice straw for composting, ruminant feed, biofuel production, as an adsorbent, and biochar production. Rice straw can serve as feed for ruminant cattle, such as cows [5]. Cows have fiber-degrading microorganisms in their digestive tracts, allowing them to utilize rice straw, which can reduce feed costs, as feed constitutes nearly 70% of livestock production expenses, providing economic benefits to cattle farmers. In Jambi Province, particularly in Muara Jambi Regency, the average farmer raises 2 to 4 cows per family as a side business.
Rice straw is a cheap, abundant, and practical feed source, with a dry matter content of 84.22%, crude protein of 4.60%, crude fiber of 28.86%, crude fat of 1.52%, and nitrogen-free extract materials of 50.80% [6, 7]. According to [3], rice straw can feed 2–3 beef cattle per hectare per year. However, its high lignin and silica content, low crude protein, poor digestibility, and low palatability limit its use as feed. The type of feed affects the emissions of CH4, N2O, and CO2 from livestock, which are produced by microbial fermentation in the digestive system and manure management [8, 9]. Livestock contributes 9% of CO2 emissions, 37% of CH4, and 65% of anthropogenic N2O globally, totaling 7.1 gigatons of CO2-e per year, or 14.5% of all anthropogenic GHG emissions [10]. Locally estimating the emissions from different livestock types is essential to understanding their GHG contributions. Research indicates that CH4 emissions from livestock manure depend on feed type, physiological status, and manure management, with adult cows producing the highest CH4 and dairy cows the highest N2O [11, 12]. For example, in West Java, livestock emissions in 2022 were reported as 2.49 Gg tons of CO2-e CH4 from enteric fermentation, 0.22 Gg tons of CO2-e CH4 from manure management, and 0.87 Gg tons of CO2-e direct N2O from fertilizer management [10]. Another study reported CH4 emissions from manure management at 0.0239 Gg CH4 per year and direct N2O emissions at 465.85 kg N2O per year [13].
Several studies have measured CH4 and N2O emissions from cattle using Tier 1 methods, but these are limited to livestock populations and emission factors without a specific focus on Balinese cattle fed with rice straw. This study aims to fill this gap by developing an effective strategy to reduce CH4 and N2O emissions from cattle in Muara Jambi Regency, Jambi Province, using rice straw as feed. This approach could increase farmers' income while reducing GHG emissions, representing a novel aspect of this research. Previous research has explored CH4 reduction using feed additives like 3-nitrooxypropanol (3NOP) and halogenated CH4 analogs, achieving reductions of 76% and 98%, respectively [11]. Given the significant contribution of livestock to GHG emissions, this study employs the Analytical Hierarchy Process (AHP) method to develop effective strategies for reducing CH4 and N2O emissions, a gap not addressed in earlier studies [14]. This research aims to develop an effective strategy to reduce CH4 and N2O gas emissions from cattle using rice straw as feed and provide valuable insights for government and policymakers on using rice straw as animal feed and developing effective strategies for emission reduction.
Study Area
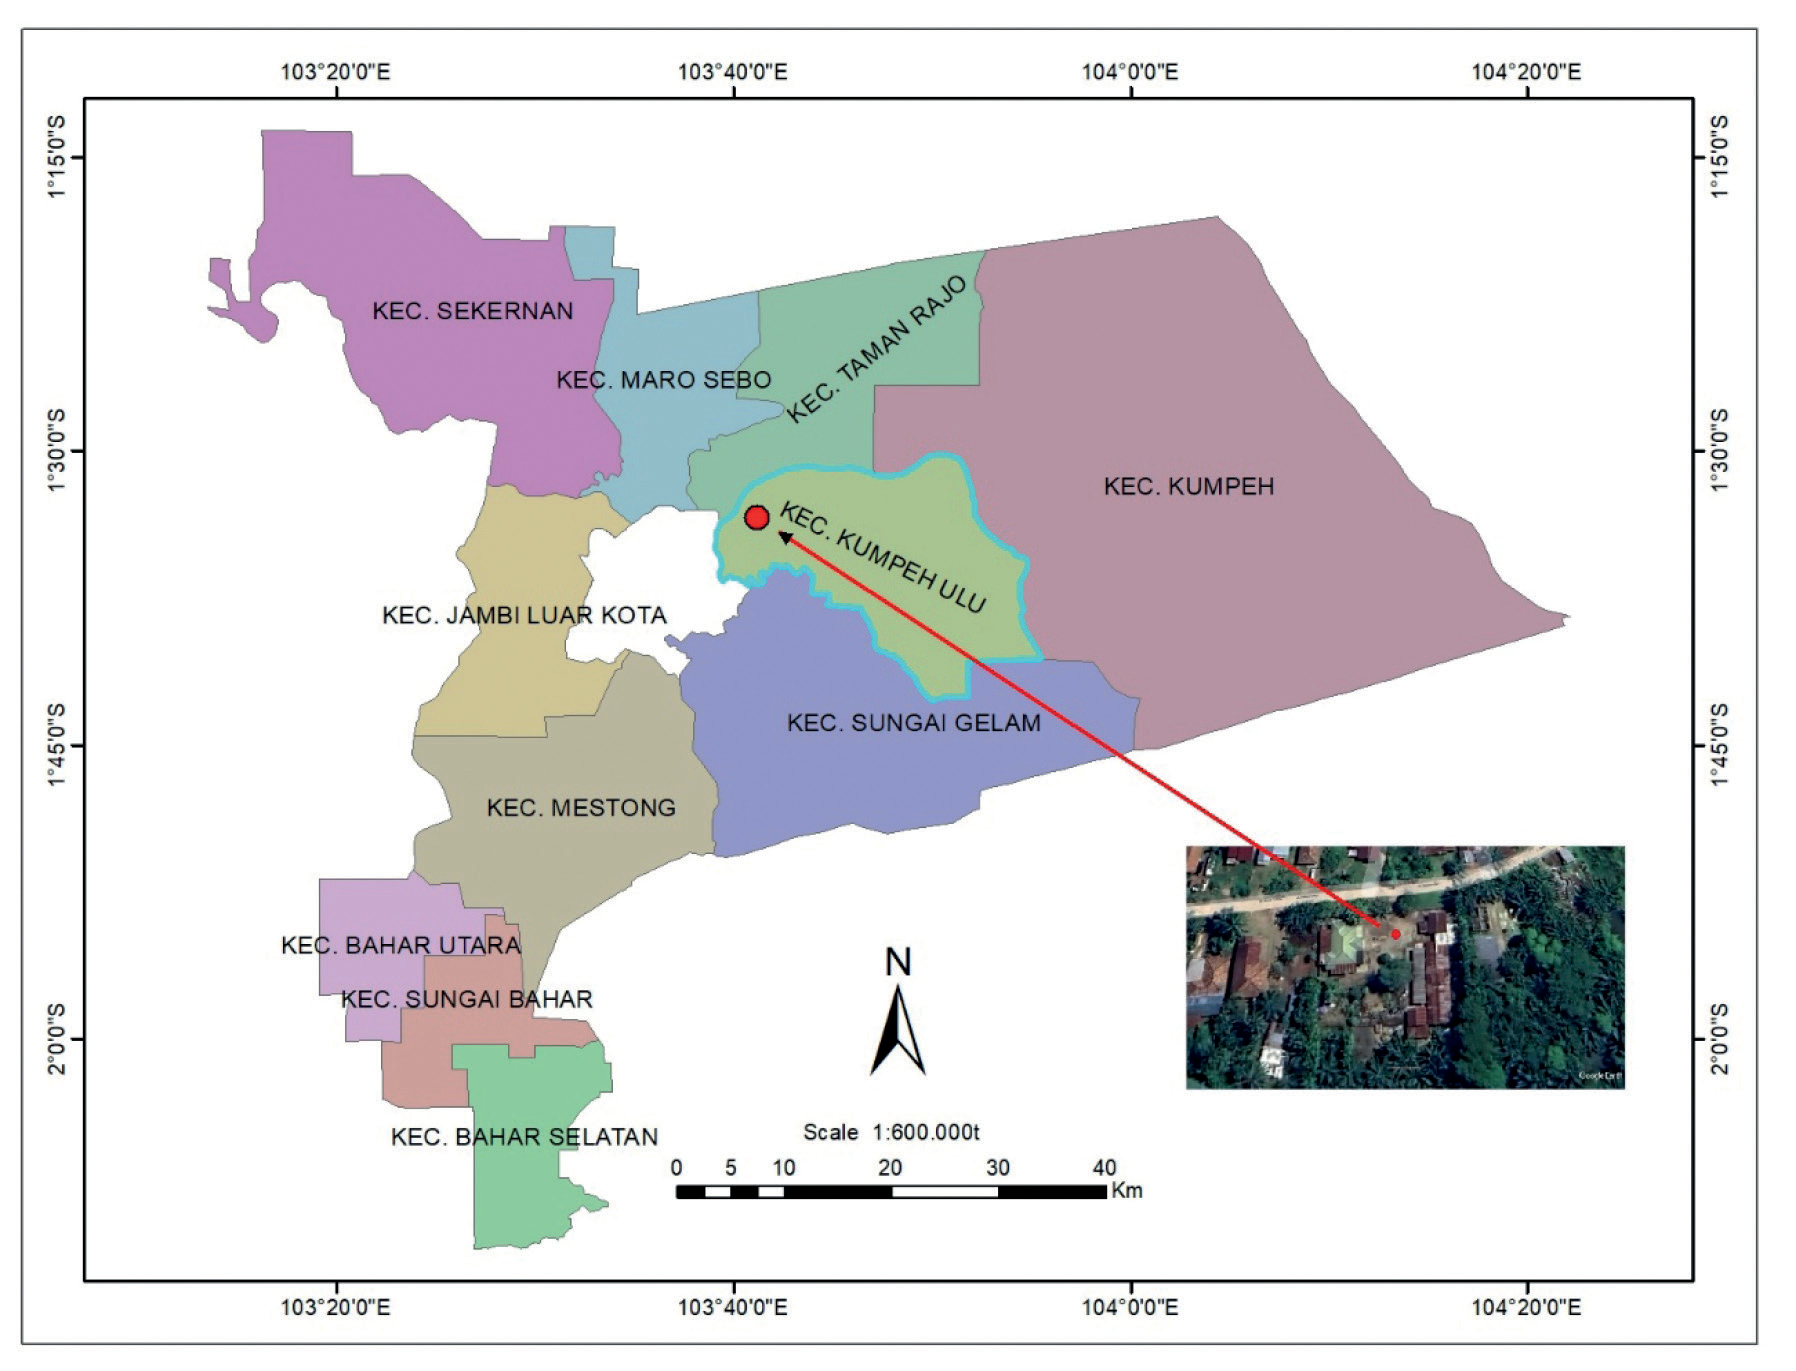
The research was conducted from May 2023 to December 2023 in the cattle breeding area of Pudak Village, Kumpeh Ulu District, covering an area of 16.54 km² [1]. Kumpeh Ulu District is located at 1°33’31.77’’ S and 103° 40’44.24’’ E, with the research site situated at an elevation of 8–13 meters above sea level. The site was deliberately selected based on the following considerations:
2) it includes around 600 hectares of paddy fields; 3) it supports 50 cattle farmers. The map of the research location is shown in Fig. 1.
Data Source
This study was conducted using a descriptive survey approach with 50 farmers who raise cattle traditionally as respondents. The study utilized both primary and secondary data. Primary data was obtained through direct surveys of the respondents. Measurements were taken for temperature and humidity, CH4 and N2O gas emissions, dry matter (DM), crude protein (CP), crude fat, crude fiber (CF), ash, acid detergent fiber (ADF), neutral detergent fiber (NDF), and gross energy (GE) from kumpai grass, rice straw, tofu dregs, and manure. Furthermore, a focus group discussion (FGD) was conducted with respondents to develop an effective strategy for reducing CH4 and N2O emissions from cattle fed with rice straw basal feed. Consultations were also held with key informants to compile priority sequences and pairwise comparisons between indicators in the AHP method, and to determine criteria, sub-criteria, and alternatives in decision-making.
Data Analysis
The determinants of GHG emissions from the livestock sector are influenced by several factors, including livestock population, type of livestock, housing, type of animal feed, manure/waste management, and farmer behavior in cattle cultivation. The formula for calculating greenhouse gas emissions follows the Tier-1 method [15]. To calculate CH4 emissions from the feed fermentation process in the rumen (enteric fermentation), the formula issued in the IPCC guidebook [15, 16] is used:
Where Fee = Enteric emission factor (kg CH4/head/ day), Fem = Emission factor from manure (kg CH4/head/ day), 21/1000 = conversion for CH4 to CO2 and from kg to tons, Fen = N2O emission factor from manure (kg N2O/kg manure/day), 293/1000 = conversion for N2O to CO2 and from kg to tons, 44/28 = Convert from N2O-N to N2O; 0.05 = Average excretion N (kg N/head/year).
To calculate GHG emissions using the Tier-1 method, the IPCC provides default emission factors (FE) for various types of livestock. For Indonesia, the FE values for CH4 emissions from enteric fermentation and manure management are used as the default factors for the entire Asian region [10, 15, 17]. The GHG emissions from the livestock sector are calculated using the IPCC Tier- 1 method in three parts: CH4 emissions from enteric fermentation, CH4 emissions from manure management, and N2O emissions from manure management. By combining these three calculations, the total GHG emissions from the livestock sector can be determined. To analyze the concentrations of CH4 and N2O in samples, gas chromatography is used, equipped with a Flame Ionization Detector (FID) for CH4 and an Electron Capture Detector (ECD) for N2O. The emissions of CH4 and N2O gases are then calculated using established equations [18]:
Table 1.
Scale to compare factors in AHP paired comparison.
| Factor i Compared to Factor j | Quantitative Value |
|---|---|
| Equally important | 1 |
| More important | 3 |
| Much more important | 5 |
| Quite more important | 7 |
| Absolutely more important | 9 |
| Intermediate values | 2, 4, 6, 8 |
Table 2.
Standardized Random Index (RI) values of mean random consistency index.
| Hierarchy Matrix | 1 | 2 | 3 | 4 | 5 | 6 | 7 | 8 | 9 | 10 |
|---|---|---|---|---|---|---|---|---|---|---|
| RI | 0 | 0 | 0,58 | 0,90 | 1,12 | 1,12 | 1,32 | 1,41 | 1,45 | 1,49 |
In the provided equations, E represents the emissions of CH4 and N2O gases, measured in milligrams per square meter per day. The term dc/dt denotes the difference in CH4 and N2O concentration over time, expressed in parts per million per minute. Vch stands for the volume of the chamber box, measured in cubic meters, while Ach represents the area of the chamber box, measured in square meters. The variables mW signify the molecular weight of CH4, measured in grams, with specific values provided for CH4 and N2O at 0°C. The term mV indicates the molecular volume of CH4, measured in liters. Finally, T represents the average temperature during gas sampling, measured in degrees Celsius.
The Analytical Hierarchy Process (AHP) method is used for developing effective strategies in decision-making [19]. This method involves several stages:
Stage 1: Determining critical factors. The AHP method helps establish the sequence of criteria to be considered and make the most reasonable decisions [20, 21]. According [22] to the process, the comparative value of factors is determined based on a priority comparison scale. On this scale (Table 1), pairwise comparisons between equally important factors have a quantitative value of 1. A more important factor has a value of 3, a much more important factor has a value of 5, a quite more important factor has a value of 7, and an absolutely more important factor has a value of 9. Intermediate values of 2, 4, 6, and 8 are used for factors that fall between these levels of importance.
Stage 2: Normalizing the matrix. To normalize the criterion importance matrix, the value of each cell in a column is divided by the total value of that column. The weighted average (Wi) is then calculated by summing the weights of the Xi factor relative to Xj after normalization and dividing by n. To ensure the reliability of the weight (Wi), the consistency index CR (consistency ratio) is calculated. A CR value of less than 0.1 indicates a consistent result. The formula for calculating CR is provided in the corresponding equations.
Where:
The Random Index (RI) is used as a reference value, as shown in Table 2. The eigenvalue of the matrix is denoted as λmax. To calculate the total S value, use the following formula:
Stage 3 involves creating a hierarchy of the total S values. This is achieved by applying reclassification methods and regression algorithms to classify the total S values according to their respective ranges, depending on the study’s content. The hierarchical structure for decision-making, aimed at effectively reducing CH4 and N2O emissions from cattle fed with rice straw, is presented in Fig. 2.
Results and Discussion
Cattle Cattle contribute significantly to global warming by producing methane (CH4) and nitrous oxide (N2O) gases. The greenhouse gas (GHG) effects from livestock are influenced by factors such as livestock type, population, feed management, and manure management. The concentrations of CH4 and N2O gases from manure in 50 cattle sheds were measured using the MQ4 sensor method (Table 3). Methane is produced during the decomposition of organic matter under oxygen-deficient conditions, particularly in enteric fermentation processes, livestock manure, and rice fields [18, 23, 24]. N2O is generated from microbial transformations in soil and livestock manure, with increased emissions occurring when nitrogen availability exceeds plant needs, especially in wet conditions [15].
Fig. 2.
Analytical hierarchical structure of effective strategies for reducing CH4, N2O gas emissions from cattle.
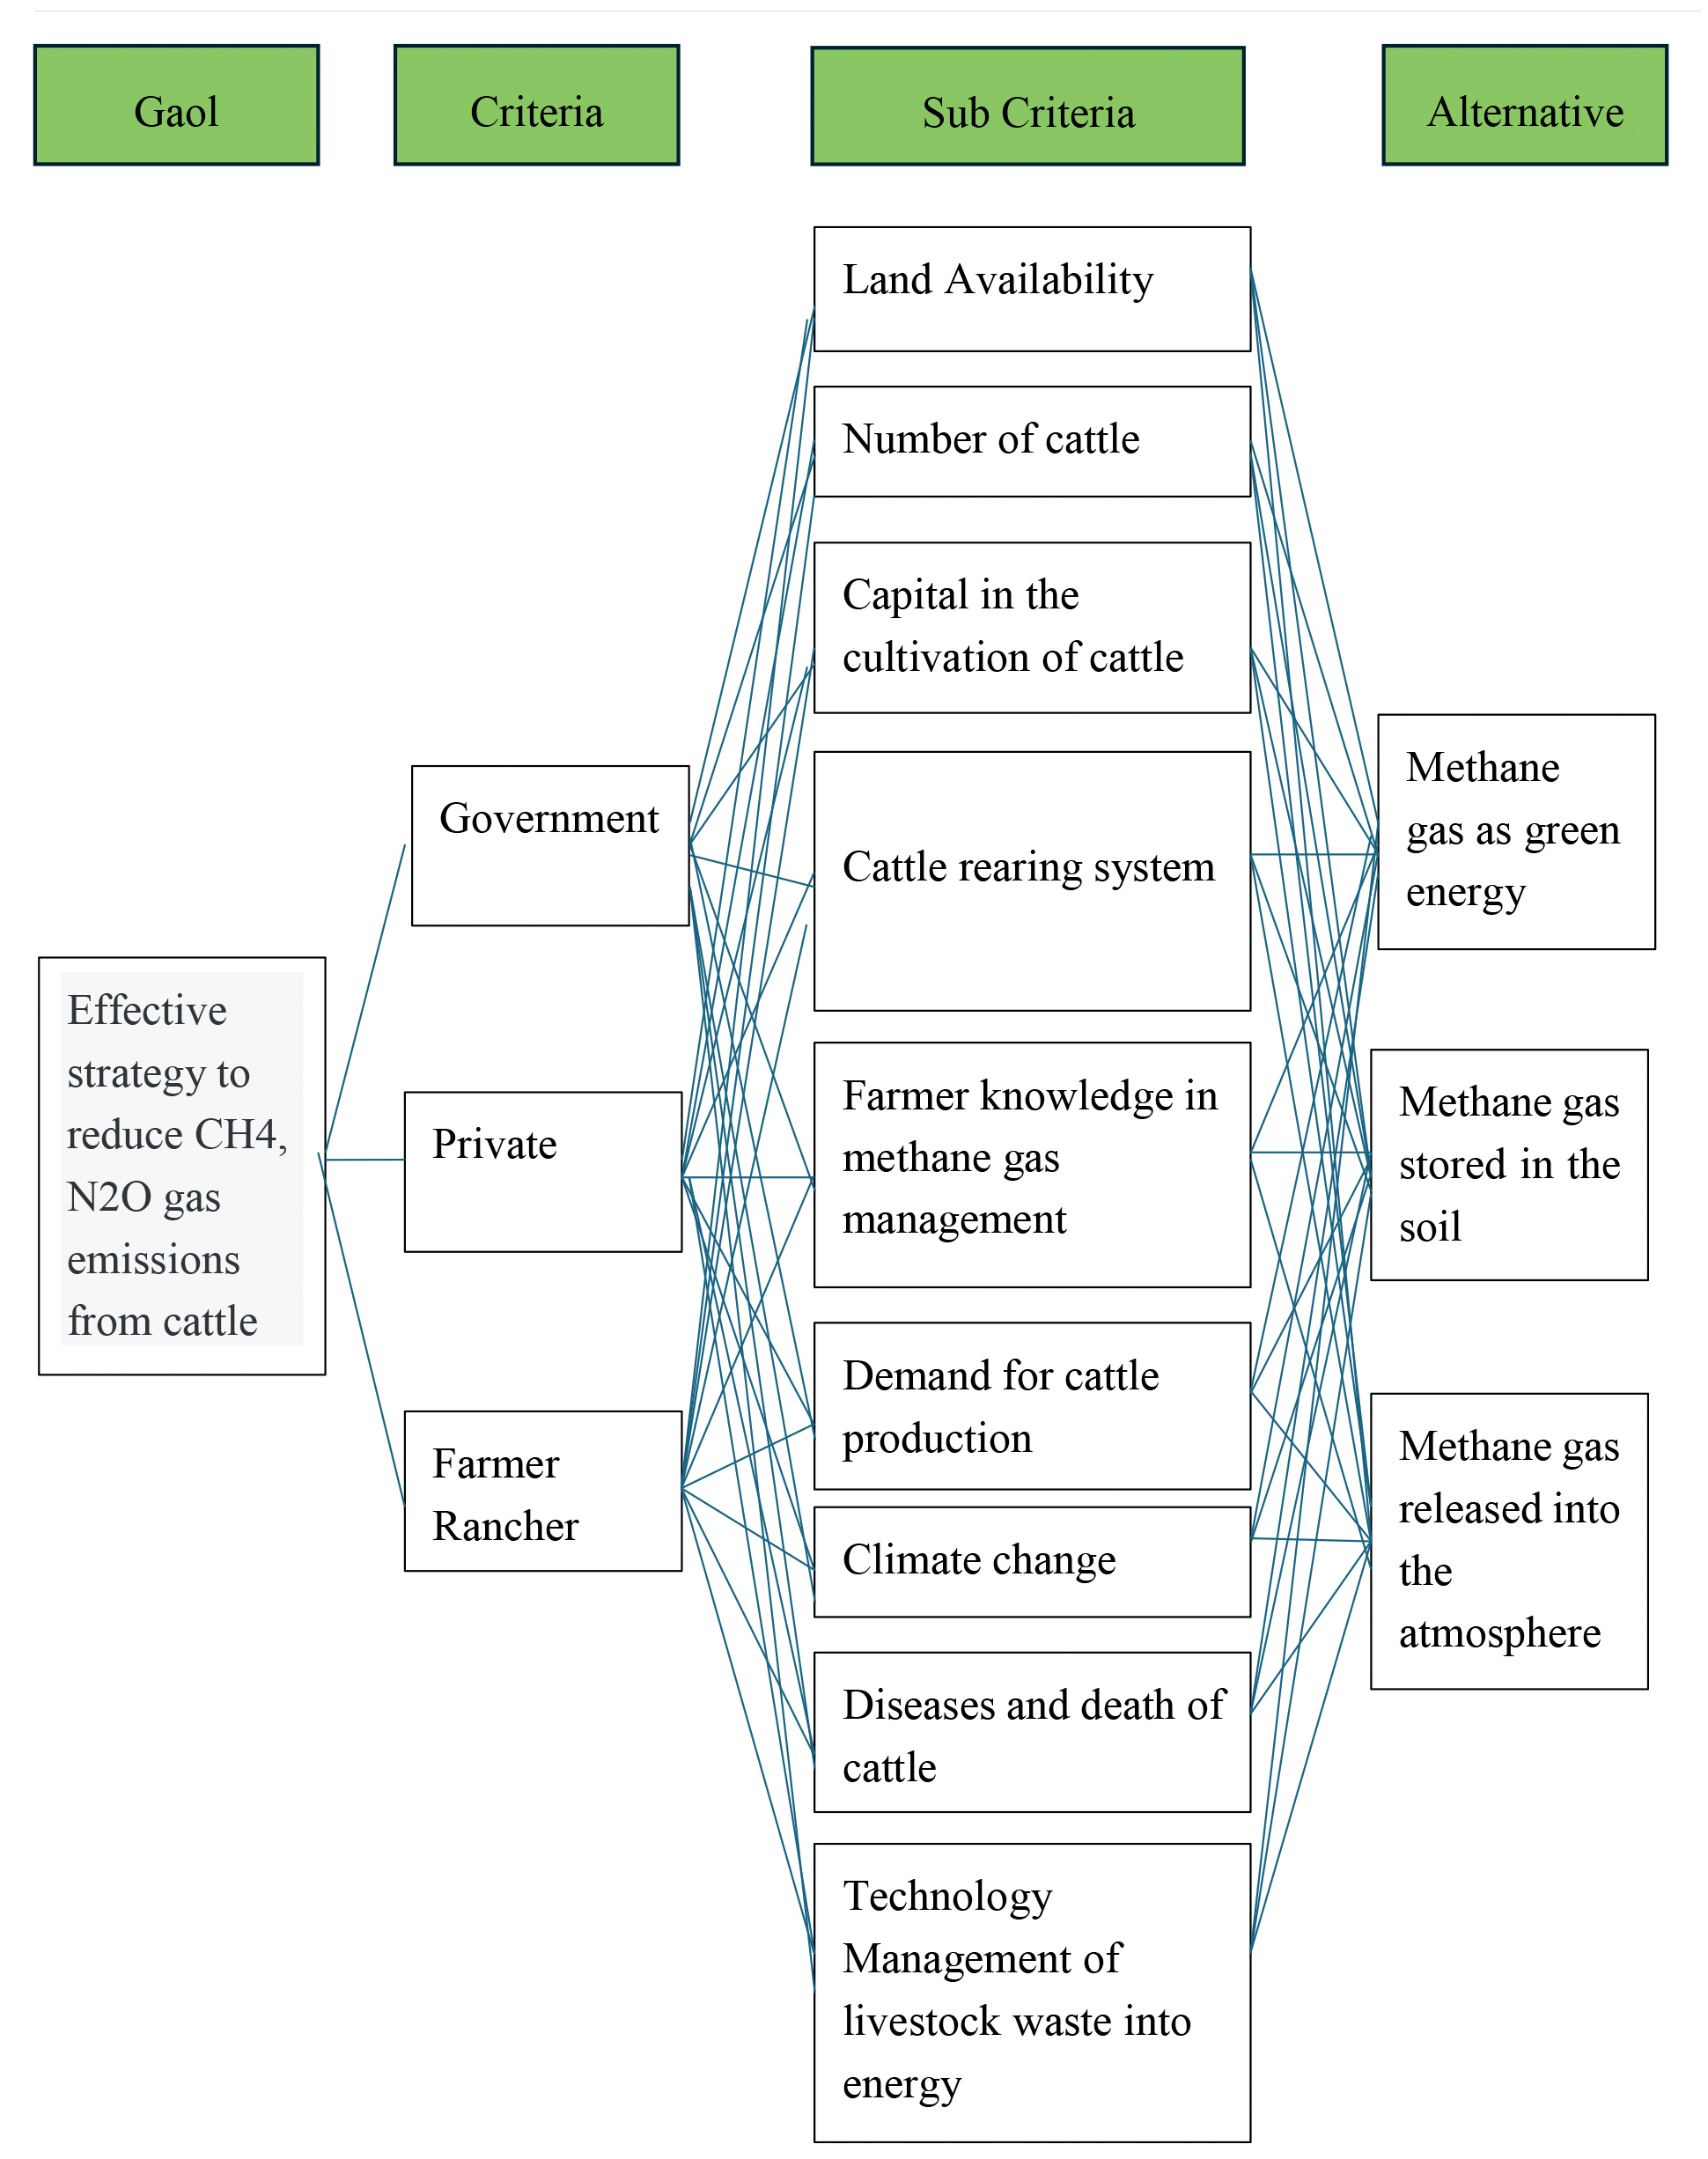
Table 3.
Average Gas Concentrations of CH4, CO2, N2O from the measurement results using MQ4 sensors in 50 cattle sheds.
Table 4.
Results of proximate analysis of feed ingredients and manure during the study.
The emissions of CH4 and N2O gases produced by cattle are also affected by the type of feed consumed, such as forage and concentrates. Common forage includes kumpai grass and rice straw, with additional feed often comprising tofu dregs and solids. CH4 concentrations in manure reached a maximum of 171.321 ppm, while N2O concentrations peaked at 51,053.539 ppm. The production of these gases is influenced by the crude fiber content of the feed, as high crude fiber levels increase methanogenesis activity during digestion [25].
According to studies, CH4 emissions from livestock manure management in Jambi Province were as follows: 2869.38 CO2-e tons per head in 2014, 3060.96 CO2-e tons per head in 2015, 3217.60 CO2-e tons per head in 2016, 3350.47 CO2-e tons per head in 2017, and 3342.95 CO2-e tons per head in 2018 [13]. The proximate analysis of feed ingredients and manure during the study is presented in Table 4.
Table 4 shows that the crude fiber content of kumpai grass and rice straw is high, at 28.859% and 27.646%, respectively. High crude fiber content affects the activity of rumen microbes in degrading fiber, as reflected in the Acid Detergent Fiber (ADF) and Neutral Detergent Fiber (NDF) values. Previous studies report crude fiber content in kumpai grass and rice straw at 32.85% and 32.99%–36.97%, respectively [26–28]. High crude fiber content leads to increased CH4 gas production from enteric fermentation and in manure.
The addition of fatty acids and feed additives can impact methane gas production in ruminants [29–31]. According to research [32], providing fermented tofu dregs significantly reduces CH4 gas flux, as fermented tofu pulp has a higher crude protein content (25.87%) compared to unfermented tofu pulp (21.08%). Emission reduction strategies in small ruminant farming can include improving feed efficiency, providing feed supplements, and utilizing food waste or agro-industrial by-products [33–35].
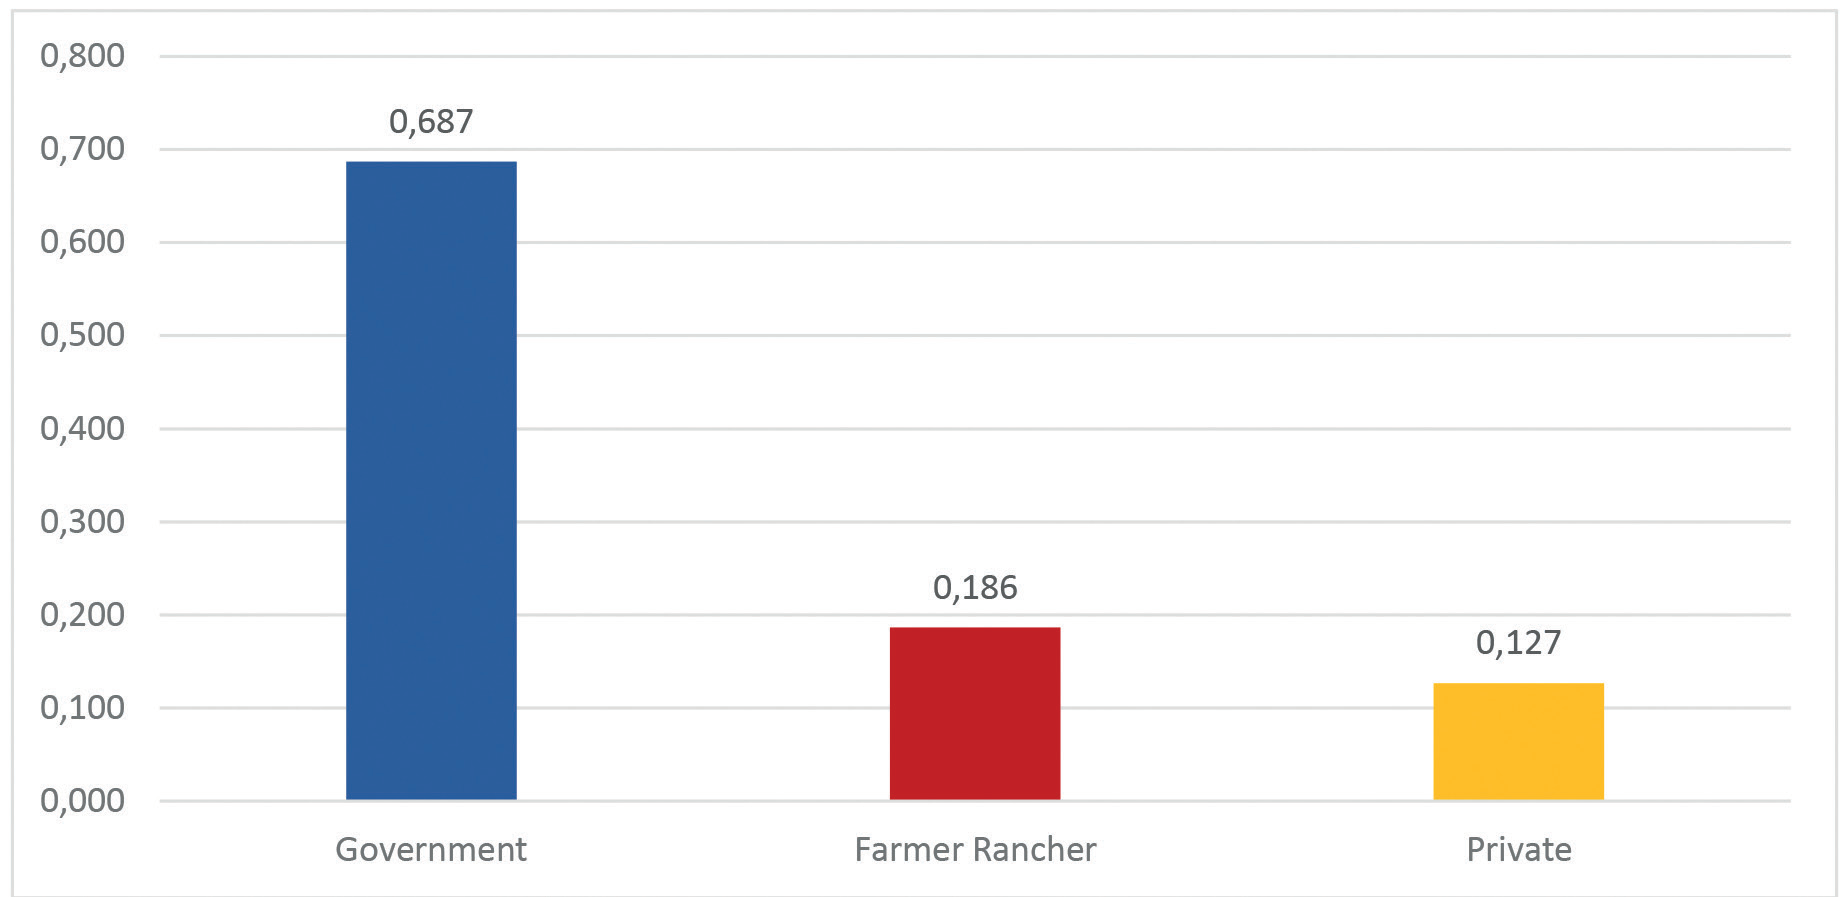
Table 5.
Inconsistency and consistency ratio (CR) values by criteria.
| Criteria | Inconsistency | Consistency (CR) |
|---|---|---|
| Government | 0.09 | 0.91 |
| Private | 0.09 | 0.91 |
| Farmer Rancher | 0.09 | 0.91 |
Effective Strategies to Reduce CH4 and N2O Gases from Manure that Gets Rice Straw Feed
In strategizing the management of CH4 and N2O gas emissions from livestock manure, three key variables are identified: the government, the private sector, and livestock farmers. The government plays a crucial role in decision-making, while the private sector uses livestock products, and livestock farmers manage the cattle. The inconsistency value is 0.09, and the consistency ratio (CR) is 0.91. A high consistency value indicates the validity of the research. The weights of the three variables are illustrated in Fig. 3. Fig. 3 shows that the government has the largest role, with a weight of 0.687, followed by livestock farmers and the private sector. This significant role of the government is due to its involvement in formulating policies, regulations, and decisions for cattle farming and manure management. Manure contains organic matter such as proteins, carbohydrates, and fats, which can be used as a source of feed and energy for anaerobic bacteria growth. Livestock manure is composed of fatty acids, proteins, and carbohydrates, which are easily decomposed [36]. According to Indonesia's policy, the country aims for an unconditional target of a 29% reduction in emissions and a conditional target of up to 41% compared to business-as-usual by 2030 [10]. The inconsistency and consistency ratio values are presented in Table 5.
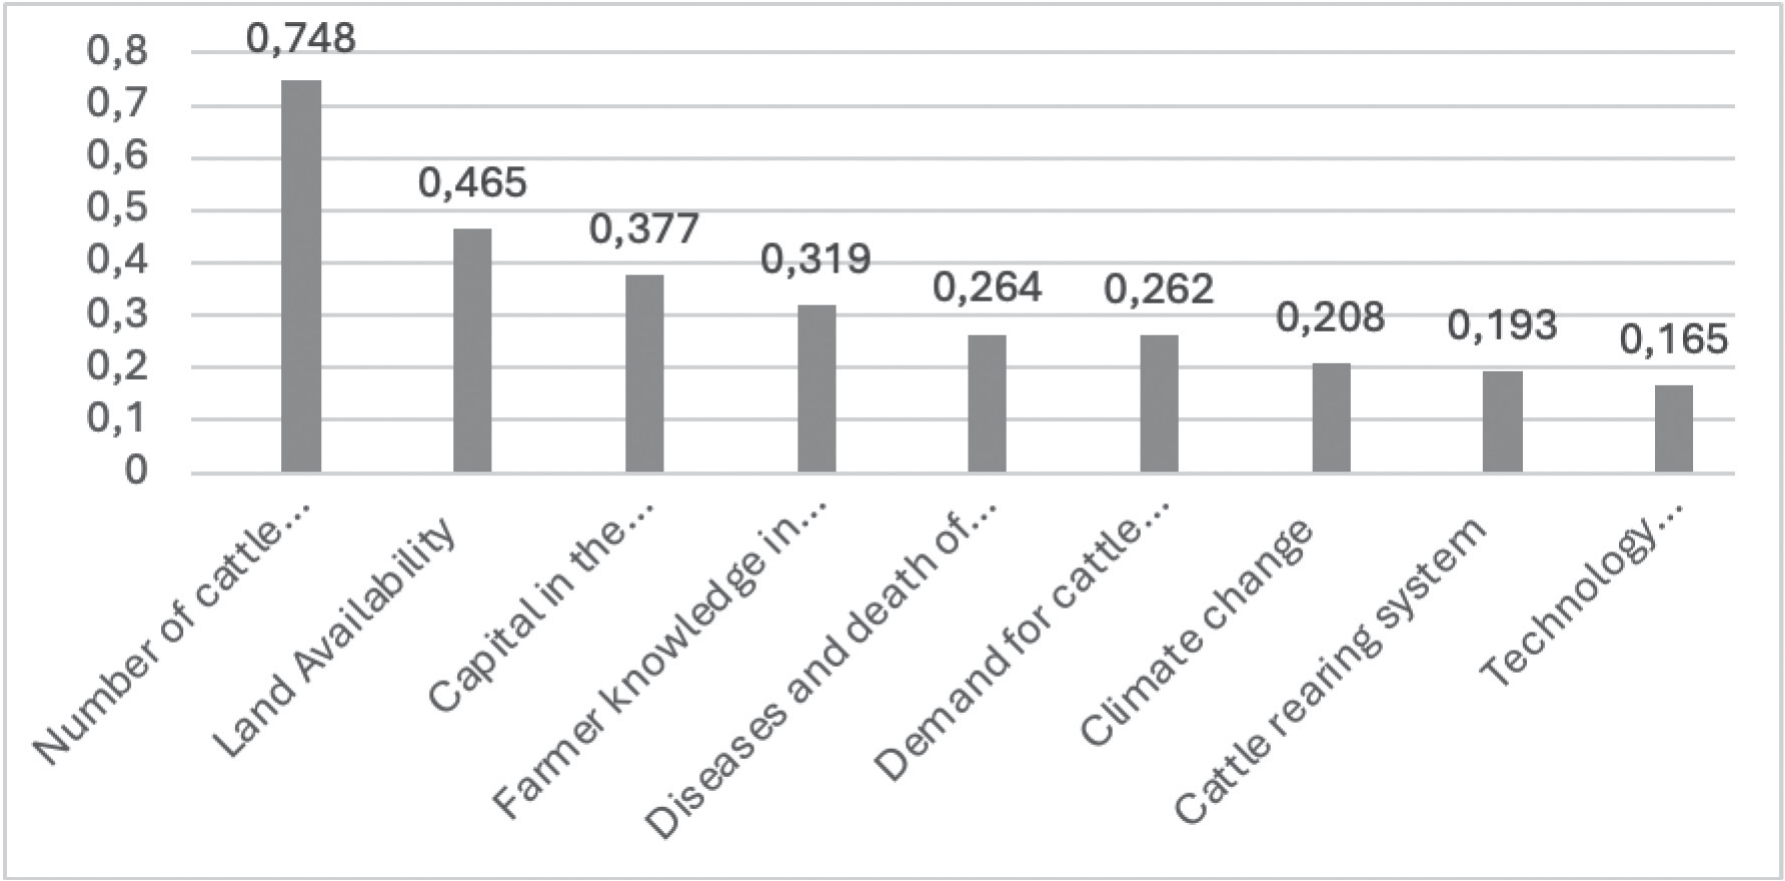
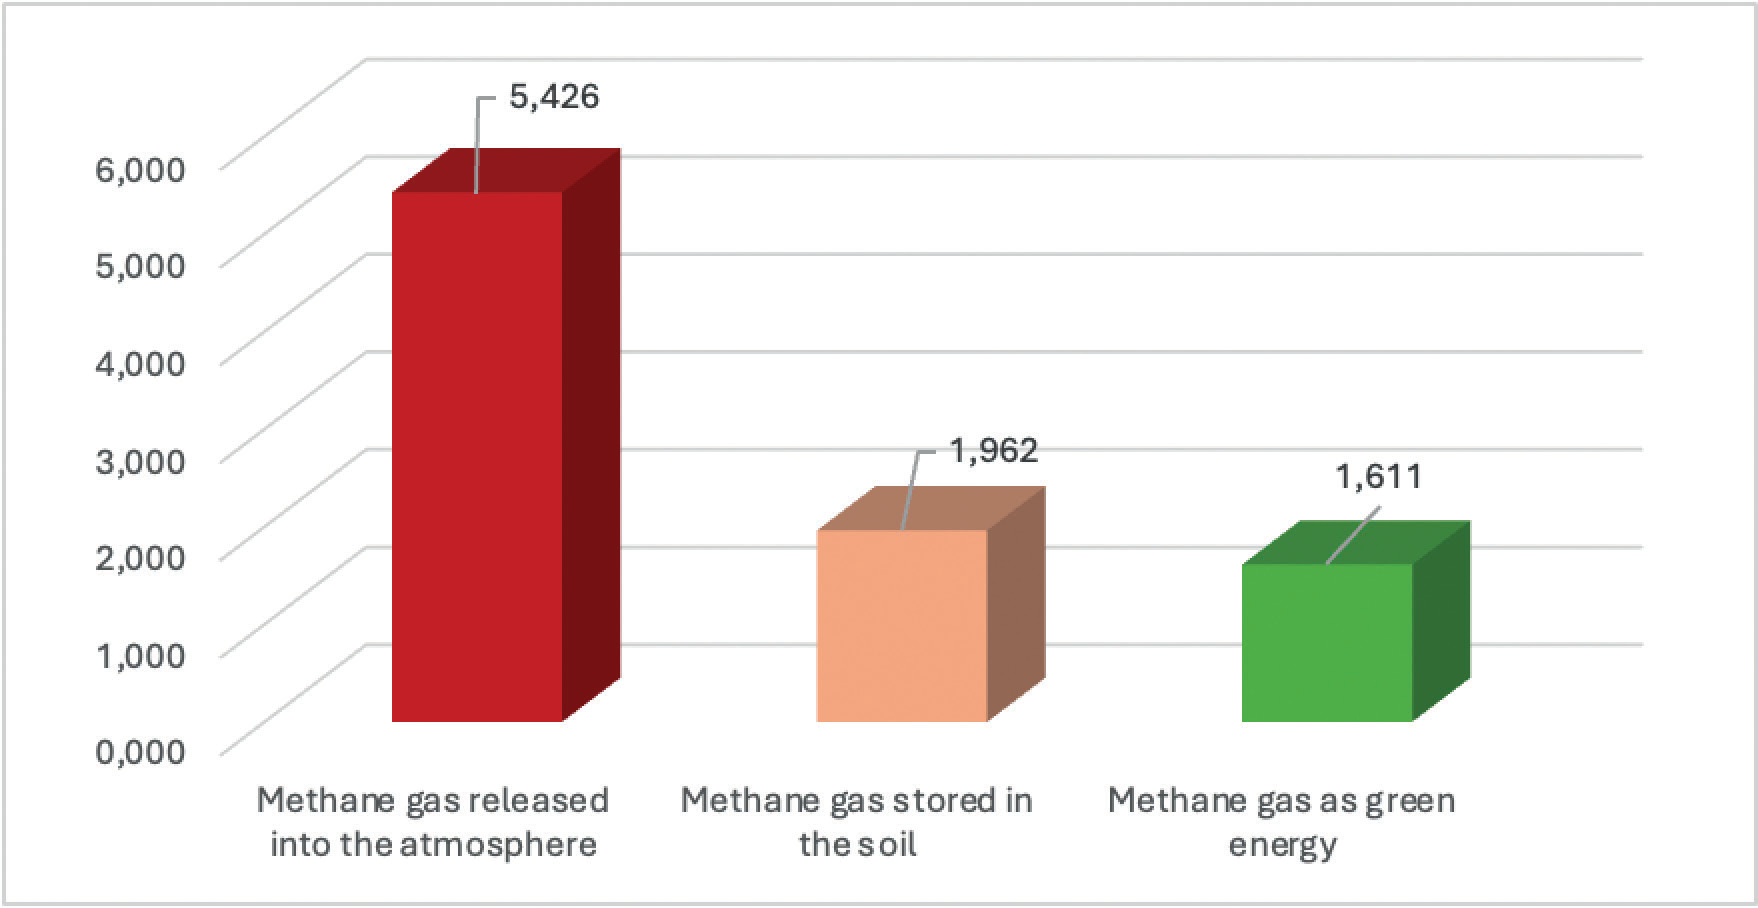
Based on the criteria, nine sub-criteria synergize in managing CH4 gas derived from cow manure. The inconsistency and consistency ratio values are shown in Table 6, and the weight of the sub-criteria is displayed in Fig. 4. Fig. 4 indicates that the number of cattle raised has the highest weight of 0.748, making it the dominant factor in producing CH4 and N2O gas emissions from manure. Livestock production is influenced by host-rumen microbiome-environment linkages, which ultimately benefit the animal's adaptation to the environment [23, 37, 38]. Current technology for managing livestock waste into energy at the research site is minimal. Alternatives for managing CH4 gas are not optimal, as indicated by the pairwise comparison in Fig. 5. Fig. 5 shows that the weight of CH4 gas released directly into the atmosphere is the highest at 5.426, followed by gas stored in the soil (1.962), and the weight for using CH4 as green energy in the form of biogas is only 1.611.
Methane is estimated to contribute about 18% of total expected global warming in the next 50 years [39], with livestock accounting for approximately 9% of total global emissions [15]. Domestic animals contribute about 94% of total global animal emissions [36]. Although emissions per unit of animal product have decreased, total emissions have increased due to the growth in livestock populations worldwide [40]. By 2050, total CH4 emissions from ruminants are expected to increase significantly due to the rising demand for milk and meat [41].
Table 6.
Inconsistency value and consistency ratio of sub-criteria.
To reduce CH4 and N2O gas emissions from manure with rice straw basal feed, several actions can be taken. These include increasing the government's role in promoting and using environmentally friendly energy sources like methane gas, increasing the number of cattle raised, enhancing farmer knowledge, utilizing available land through livestock integration with agriculture and plantations, reducing livestock mortality and disease rates, increasing the use of appropriate technology, assisting in livestock cultivation (e.g., CSR initiatives from private companies), enhancing livestock adaptation to climate changes, and increasing demand for livestock production to meet animal protein needs. Other strategies to reduce CH4 emissions include using CH4 inhibitors, tanniferous forages, electron sinks, oils and fats, and oilseeds, which can decrease daily methane emissions by an average of 21% [42]. The alternative approach is to reduce CH4 gas released directly into the atmosphere by utilizing biogas as a source of green energy. Additionally, cattle feces and urine can be used as organic fertilizers [43]. Cow manure provides essential nutrients for plants, and cow urine can be processed into biourine for plant fertilization or sale [13].
Conclusions
The highest recorded emissions of CH4 and N2O gases were 171.321 ppm and 51.053.539 ppm, respectively, observed under conditions of 29.51°C temperature and 79.21% relative humidity. Effective strategies to reduce these emissions rely significantly on government regulations and policies. Three alternative approaches that have proven effective include reducing the amount of methane released into the atmosphere, storing methane in the soil, and utilizing methane as a source of green energy. Therefore, policymakers should focus on preventing the burning of rice straw and promoting the development of renewable energy sources, such as biogas derived from livestock manure, to mitigate the impact of these harmful emissions.

