


Introduction
The wheat plant is one of the most demanded and consumed cereal crops in the world, due to the growing demand for dietary products among people. The decrease in the productivity of the planting material has increased the attention of this plant. The reason for the decrease in productivity is the occurrence of undesirable environmental conditions, such as abiotic (salt, drought, high temperature, etc.) and biotic factors, as well as the effect of heavy metals (Zn, Cd, etc.). Due to all of these reasons, it is necessary to study the changes that occur in the genome of the wheat plant and the molecular mechanisms that cause these changes. Improvement of new methods in biological science led to considerable achievements in proteomics, metabolomics, next-generation sequencing (NGS), genome editing methods (CRISPR cas9; cas13), epigenetic processes (methylation, histone modifications, transposon activities), and Omics [1].
Epigenetic changes are caused by retrotransposons, which are mobile genetic components found in almost all eukaryotic organisms. It is known that transposable elements present in plants operate primarily on the copy-and-paste principle [2]. They have the ability to affect genes located close to each other in the plant genome due to long terminal repeats (LTR). Some genomic LTR retrotransposons may continue activation and translocation in response to biotic or abiotic stressors, avoiding defense mechanisms [3, 4]. The processes of reactivation of retrotransposons in different plant genomes differ from each other. Expression of reactivated retrotransposons is influenced by transcriptional and post-transcriptional gene silencing mechanisms (including DNA methylation, heterochromatin formation, and RNA interference).
Epigenetic changes caused by various abiotic stresses affect the expression of genes at the transcriptional or translational level. Furthermore, the phenotypic traits resulting from epigenetic changes can create adaptation conditions for plants that are capable of being transmitted to the next generation [5]. Epimutations are known to be transient, unlike mutations in the traditional DNA sequence, allowing them to respond quickly to unexpected environmental pressures. Retrotransposons are activated in response to salt stress and can induce genuine genetic or epigenetic changes, thus improving plant adaptation to abiotic stresses [6]. A series of studies revealed how transposome, transcriptome, translatome, methylome, and small RNA sequence data can influence several steps of retrotransposition by silencing mechanisms in the host genome [7].
According to the literature data, about 6% of the total land area and 20% of irrigated land in the world suffer from salt stress [8]. Currently, global climate change and the rapid increase of soil and water salinity cause commercial losses of wheat plants, posing a serious threat to food security. Therefore, increasing the productivity of the wheat plant by eliminating these negative effects reveals the importance of studying the physiological and molecular mechanisms for obtaining stress-resistant forms at the cellular, tissue, and plant levels [9]. For this purpose, it is recommended by the researchers to cultivate the more resistant wheat genotypes obtained during the research in saline areas [10]. Salinity stress is considered one of the main factors affecting agricultural productivity in arid and semi-arid areas in most countries. When the plant growth process is weakened due to stress, productivity decreases and changes in metabolism occur [11, 12]. To study retrotransposons activities, advanced epigenetic and genetic studies were conducted in tobacco, banana, barley, rice, and other plants under in vivo and in vitro conditions [13, 14]. In most studies, retrotransposon mobility was found to be more active in samples obtained from in vitro tissue culture [15]. In addition to the wheat plant’s own retrotransposons, the identification of retrotransposons belonging to other species revealed that they are active elements [16]. This ensures horizontal transfer (HT) of genetic information in living organisms, its maintenance within populations, and the integrity of species [17]. Thus, the SUKKULA retrotransposon was identified for the first time at the Mlo locus in the barley genome. However, some studies have shown the presence of retrotransposons in different genomic regions based on selection and “host control” pressures over a very long evolutionary time [18].
Both autonomous and nonautonomous processes in the wheat plant in vivo and in vitro tissue culture occur depending on different degrees of stress, tissue culture conditions, and duration. Since somaclonal variations are spontaneous changes in tissue culture conditions, these variations are caused by genetic or epigenetic mechanisms and result in a number of problems in gene transfer applications. For this purpose, the mobility of retrotransposons was studied by the IRAP marker method in in vitro tissue culture and in vivo leaf samples of wheat plants exposed to different concentrations of NaCl.
Materials and Methods
The Gyrmyzy bugda, Jumhuriyet 100, and Nurlu 99 wheat genotypes were used as the research objects. Plant supplies were received from the Research Institute of Crop Husbandry. In vitro callus tissues and in vivo wheat genotype leaves were sampled after 15 and 30 days of treatment with 150 mM and 200 mM NaCl salt. Molecular research was conducted at the Tissue Culture Laboratory of Yıldız Technical University, Faculty of Molecular Biology and Genetics, Istanbul, Republic of Turkey.
Plant Growth Conditions
15- and 30-day-old callus and leaf samples of Jumhuriyet 100, Gyrmyzy bugda, and Nurlu 99 wheat genotypes grown in a selective environment were used in the study.
The grains were taken from the field at the end of the milk ripeness phase and at the beginning of the wax ripeness phase. Immature embryos of 0.8–1.5 mm of explants were used for callus induction. Wheat grains were successively surface sterilized in 70% ethyl alcohol for 5 s and in NaOCl solution containing 5% active ingredient for 18 min. After each stage of sterilization, the grains were washed 3–5 times with the volume of sterile water, and the embryos were separated under aseptic conditions. The manipulations were performed under aseptic conditions in a “Telstar Bio II A” laminar box. For callus induction, immature embryos were cultured in Murashige and Skoog medium [19] containing 0.8% agar and 3% sucrose. Syntenic auxin 2 mg/l 2,4 D-Dichlorophenoxyacetic acid (2,4-D) was added as a callus inducer every 28–30 days, the callus culture was transferred to a new nutrient medium. After obtaining sufficient biomass in two subcultivation periods, the callus culture was transferred to a nutrient medium with 150 mM and 200 mM NaCl. The plant material (grains) collected from the field was transferred to pots. Each pot is filled with clay-based soil. A 1:1:1 mixture of washed sterile sand, soil, and peat-textured soil was used. Wheat grains were planted 2–3 cm deep in each pot. The experiment was carried out under natural conditions (16/8 h of photoperiod, temperature 22–24°C, and humidity 70%). The samples were watered with 150 mM and 200 mM NaCl solution two days apart from the first day of sowing. The control samples were watered with tap water at intervals of three days. Samples after 15 and 30 days of planting were used in comparative studies with callus samples [20].
Molecular Analyses
Genomic DNA isolation: Callus and leaf samples were taken from the 3 wheat genotypes and genomic DNA was isolated [21]. The purity of genomic DNA isolated by the CTAB method was evaluated and it was diluted in a Nanodrop spectrophotometer (NanoDrop 200°C). Thus, primers were added to the diluted DNA samples and amplified in a PCR device using the IRAP method. The samples were then injected into the electrophoresis device.
PCR was carried out in 20-mL reaction mixtures containing 2.5 mL of 25 mmol/L MgCl2, 3 mL of 20 ng/mL template DNA, 2.5 mL of nuclease-free dH2O, 10 mL of 2X Sapphire Amp Fast PCR Master Mix (Takara, RR350A), 2 ml of primer (10 mmol/L). The amplification conditions were as follows: an initial denaturation step at 95°C for 3 min, 95°C for 30 s, 50°C for 30 s, 72°C for 3 min, and 72°C for 10 min (T100TM Thermal Cycler, BioRad). The PCR products were electrophoresed at 120 V for 90 min in 1% agarose gel of 1xTAE buffer. The gel samples obtained from electrophoresis were then washed in 1xTAE solution with ethidium bromide for 180 min and visualized in a UV transilluminator. Band sizes were compared to samples on a 1000 bp (1kb) DNA ladder, and polymorphism values of bands in gel images were calculated using the Jaccard Similarity Coefficient [22].
SUKKULA specific for barley, HOUBA specific for rice, and SIRE1 specific for soybean were used for IRAP-PCR analysis (Table 1).
Results
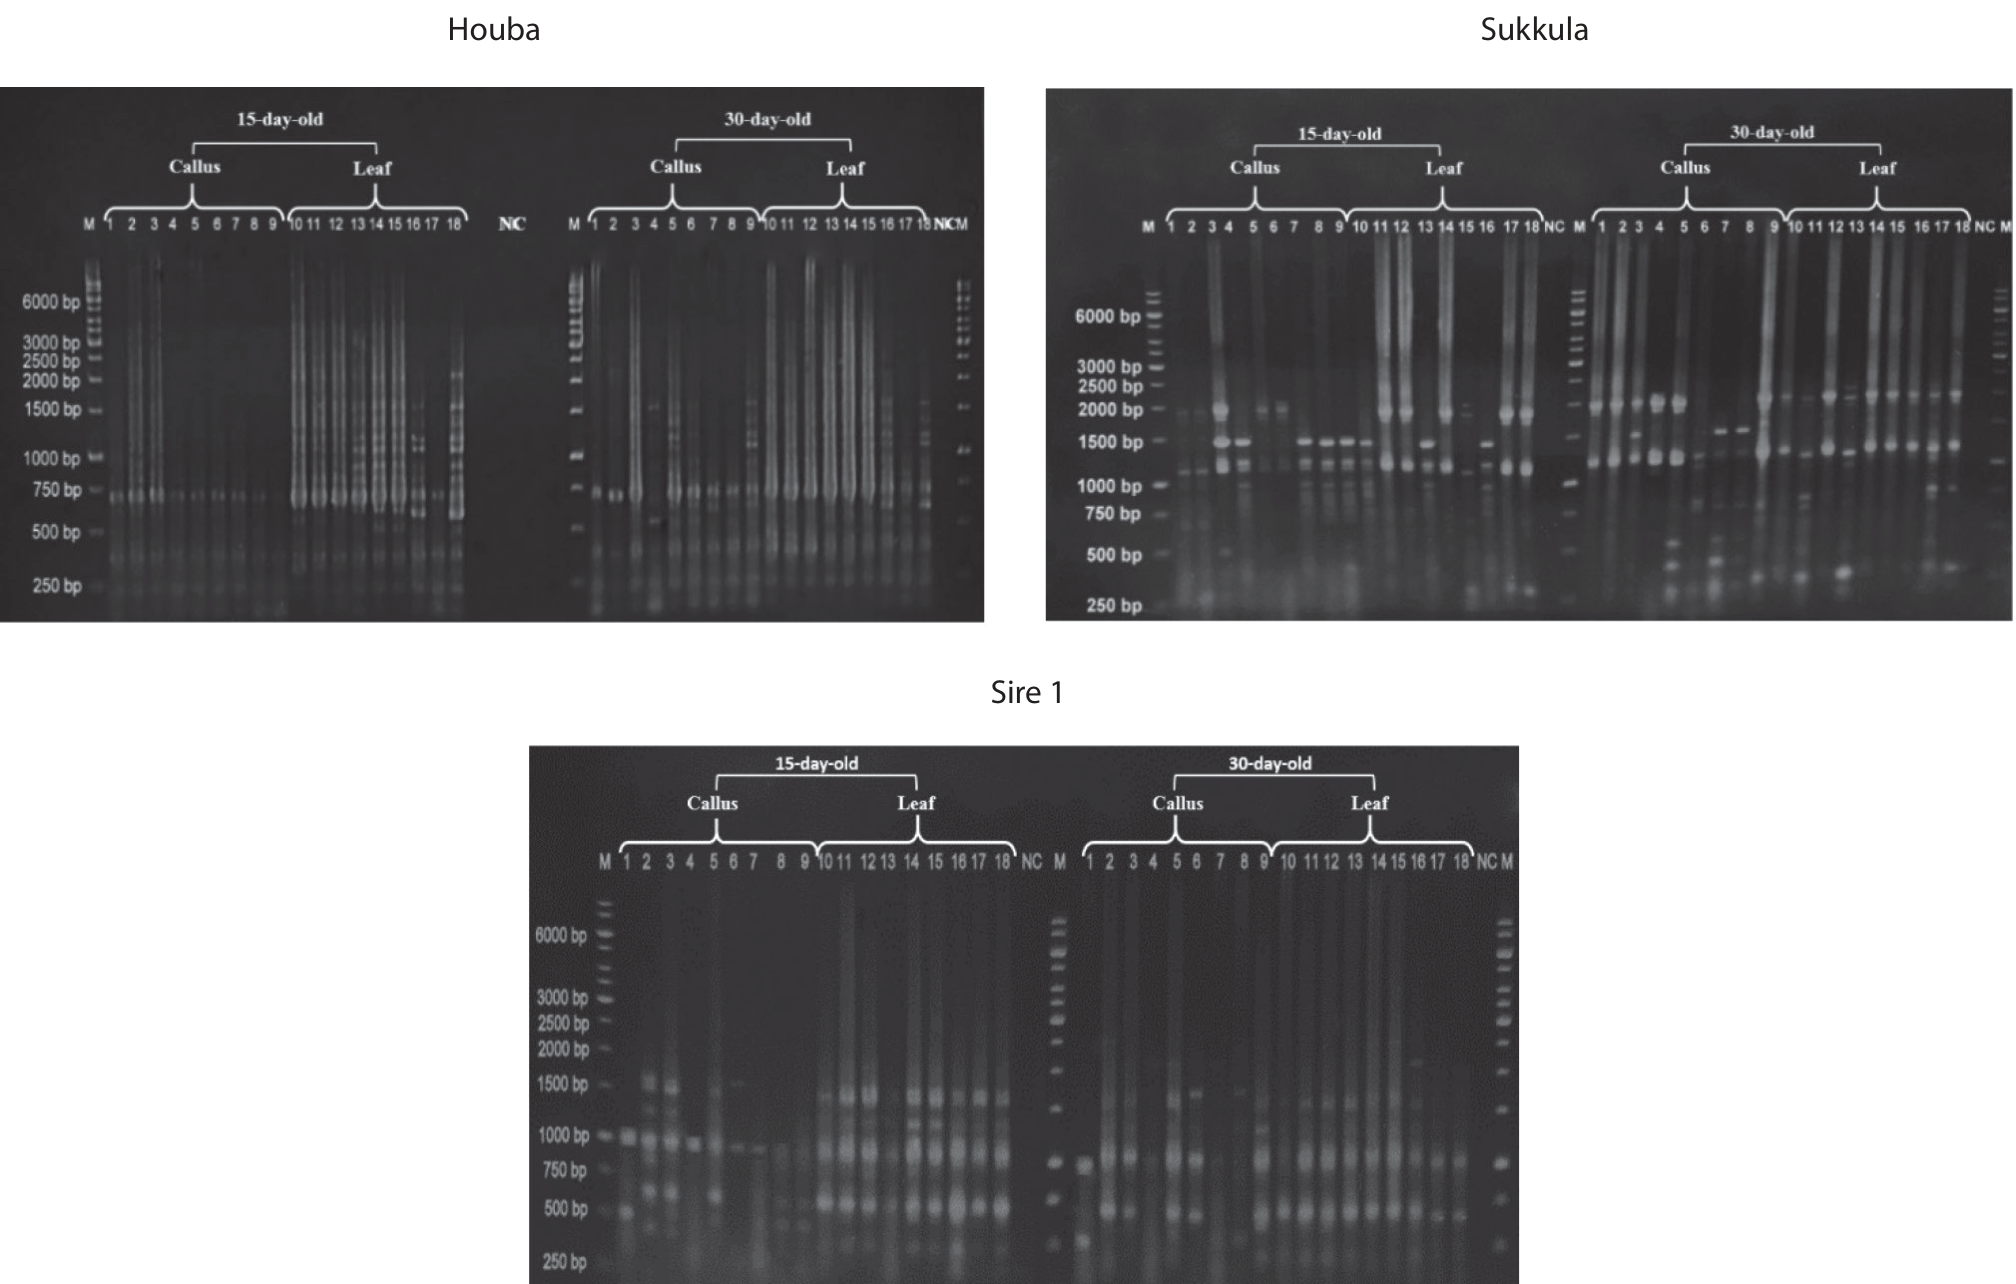
Based on the results of HOUBA retrotransposon gel electrophoresis, 144 bands in the range of 500–2000 bp were detected in 15-day-old callus and leaf samples subjected to salt stress. Of these, 73 polymorphic and 71 monomorphic bands were identified. 144 bands, 72 polymorphic and 72 monomorphic, were recorded in 30-day-old callus and leaf samples in the range of 500–2500 bp. 162 bands, 76 polymorphs, and 86 monomorphs were recorded in the SUKKULA retrotransposon in the range of 300–2000 bp. 162 bands, 58 polymorphs, and 104 monomorphs were identified in the 30-day samples. According to the gel-electrophoresis results of the SIRE1 retrotransposon, a total of 162 bands, 80 polymorphs, and 82 monomorphs in the range of 500–2000 bp were recorded in the samples. In total, 180 bands were recorded in the 30-day samples, of which 78 were polymorphic and 102 were monomorphic (Fig. 1).
Polymorphism ratios of HOUBA retrotransposons specific to rice plants were examined in callus and leaf samples of Jumhuriyet 100, Gyrmyzy bugda, and Nurlu 99 wheat genotypes exposed to salt stress (15 and 30 days) (Table 2). Samples were grown in 150 mM NaCl and 200 mM NaCl concentration medium. Depending on the mobility of retrotransposons, their polymorphism values were compared with control samples.
In 15-day-old callus samples treated with 150 mM NaCl, the polymorphism value was in the range of 0–83% in Jumhuriyet 100, 0–80% in Gyrmyzy bugda and 0–67% in Nurlu 99. In the leaf samples, polymorphism was found to be 0–33% in Jumhuriyet 100, 0–50% in Gyrmyzy bugda, and 0–17% in Nurlu 99.
In 15-day-old callus samples treated with 200 mM NaCl, the polymorphism value in the Jumhuriyet 100 wheat genotype varied from 0 to 67%, in Gyrmyzy bugda from 0 to 83%, and in Nurlu 99 from 0 to 67%. In leaf samples, a polymorphism of 0–33% was found in Jumhuriyet 100, 0–40% in Gyrmyzy bugda and 0–17% in Nurlu 99.
Comparison of 15-day-old callus and leaf samples revealed polymorphism in the range of 17–86% in Jumhuriyet 100, 20–80% in Gyrmyzy bugda, and 67–83% in Nurlu 99.
In 30-day-old callus samples treated with 150 mM NaCl, polymorphism values were 0–86%, 0–50%, and 0–83% in the Jumhuriyet 100, Gyrmyzy bugda, and Nurlu 99 genotypes, respectively. In leaf samples, no polymorphisms were recorded in the Jumhuriyet 100. While a polymorphism of 0–33% was observed in Gyrmyzy bugda, and 0–40% in Nurlu 99.
Table 1.
Primers used in this study.
| No | Primer | Sequence | Reference |
|---|---|---|---|
| 1 | Sukkula | 3’ GGA ACG TCG GCA TCG GGC TG 5’ | [23] |
| 2 | Houba-F Houba-R | 3’ CTT CGA GTG GGC TAA GGC CC 5’ 5’ GTT TCG ACC AAG CAG CCG GTC 3’ | [24] |
| 3 | Sire1 | 5’ CAG TTA TGC AAG TGG GAT CAG CA 3’ | [25] |
Table 2.
HOUBA retrotransposon polymorphism ratios among groups calculated with Jaccard’s coefficient.
Fig. 1.
HOUBA, SUKKULA, SIRE1 IRAP PCR results. Description: A-150 mM NaCl; B-200 mM NaCl; C-control. 1–9 callus, 10–18 leaves (15-day-old). 1–9 callus, 10–18 leaves (30-dayold). M-marker. Jumhuriyet-100 (1 and 10-C, 2 and 11-A, 3 and 12-B), Gyrmyzy bugda (4 and 13-C, 5 and 14-A, 6 and 15-B), Nurlu-99 (7 and 16-C, 8 and 17-A, 9 and 18-B), NC-negative control.
In 30-day-old callus samples treated with 200 mM NaCl, the polymorphism values in the Jumhuriyet 100 and Nurlu 99 wheat genotypes varied from 0 to 83%, and in Gyrmyzy bugda from 0 to 40%. In the leaf samples, no polymorphism was detected in the Jumhuriyet 100 wheat genotype. It was 0–33% in Gyrmyzy bugda, and 0–40% in Nurlu 99.
A comparison of 30-day-old callus and leaf samples did not show polymorphism in Jumhuriyet 100, while the polymorphism rate was in the range of 29–83% in Gyrmyzy bugda 20–86% and in Nurlu 99.
When comparing callus samples of 15- and 30-day-old, polymorphism was recorded in the range of 0–86% in Jumhuriyet 100, 33–86% in Gyrmyzy bugda and 60–100% in Nurlu 99. When comparing leaf samples, in Jumhuriyet 100, the polymorphism was in the range of 0–33%, in Gyrmyzy bugda 0–57%, and in Nurlu 99 17–50%.
The polymorphism ratios of the barley-specific SUKKULA retrotransposon were examined in 15-day-old callus and leaf samples from control and stressed variants of the Jumhuriyet 100, Gyrmyzy bugda, and Nurlu 99 wheat genotypes (Table 3).
In 15-day-old callus samples treated with 150 mM NaCl, the polymorphism value was 0–67% in Jumhuriyet 100, while no polymorphism was observed in Gyrmyzy bugda and Nurlu 99. In leaf samples, the polymorphism value was 0–13% in Jumhuriyet 100, 0–86% in Nurlu 99, and it was not detected in Gyrmyzy bugda.
In 15-day-old callus samples treated with 200 mM NaCl, the polymorphism value was 0–67% in Jumhuriyet 100, while no polymorphism was observed in Gyrmyzy bugda and Nurlu 99.
In leaf samples, a polymorphism of 0–13% was found in Jumhuriyet 100, 0–89% in Nurlu 99, and was not detected in Gyrmyzy bugda.
Comparison of 15- and 30-day-old callus and leaves revealed a polymorphısm of 75–88% polymorphism in Jumhuriyet 100, 0–88% in Gyrmyzy bugda and 0–89% in Nurlu 99.
Polymorphism was not detected at 150 mM NaCl, in Jumhuriyet 100 and Nurlu 99 callus cells in 30-day-old samples, while it was in the range of 0–38% in Gyrmyzy bugda. In leaf samples, no polymorphism was recorded in Jumhuriyet 100 and Gyrmyzy bugda callus cells. Although a 0–50% polymorphism was recorded in Nurlu 99.
No polymorphism was detected at 200 mM NaCl, in 30-day-old callus samples from the Jumhuriyet 100 genotype, while the polymorphism value varied in the range of 0–88% in Gyrmyzy bugda and 0–75% in Nurlu 99. In leaf samples, polymorphism was not detected in Jumhuriyet 100 and Gyrmyzy bugda genotypes, while, in Nurlu 99, it was in the range of 0–50% in Jumhuriyet 100, while in Gyrmyzy bugda and Nurlu 99, polymorphism was in the range of 75–88% and 0–75%, respectively.
Table 3.
SUKKULA retrotransposon polymorphism ratios among groups calculated with Jaccard’s coefficient.
When comparing 15- and 30-day-old callus cells, a polymorphism of 0–67% was found in Jumhuriyet 100, 75–88% in Gyrmyzy bugda and 50–88% in Nurlu 99. When leaf samples were compared, 86–88% polymorphism was found in 15- and 30-day-old Jumhuriyet 100, 88% in Gyrmyzy bugda, and 11–88% in Nurlu 99.
Polymorphism for the SIRE1 retrotransposon was not recorded in the Jumhuriyet 100 and Nurlu 99 wheat callus samples subjected to 150 mM NaCl for 15 days. In Gyrmyzy bugda, polymorphism was observed in the range of 0–75%. In leaf samples, the polymorphism value was 0–83% in Jumhuriyet 100, 0–86% in Gyrmyzy bugda, and 0–88% in Nurlu 99 (Table 4).
In 15-day-old callus samples subjected to 200 mM NaCl stress, polymorphism value was 0–50% in the Jumhuriyet 100 genotype, 0–71% polymorphism in Gyrmyzy bugda, and 0–14% polymorphism was recorded in Nurlu 99. The polymorphism ratio of leaf samples was in the range of 0–100% in Jumhuriyet 100, 0–78% in Gyrmyzy bugda, and 0–88% in Nurlu 99.
The comparison of 15-day-old callus and leaf samples revealed 0–100% polymorphism in Jumhuriyet 100, 17–89% in Gyrmyzy bugda, and 0–89% in Nurlu 99.
In 30-day-old samples (150 mM NaCl), no polymorphism was recorded in Cumhuriyet-100 and Nurlu 99, while it was in the range of 0–50% in Gyrmyzy bugda. In leaf samples, 0–40% polymorphism was detected in Jumhuriyet 100 and 0–67% in Nurlu 99. Polymorphism was not recorded in Gyrmyzy bugda.
In 30-day-old callus samples treated with 200 mM NaCl, the polymorphism changed in the range of 0–25%, 0–80%, and 0–57% in the Jumhuriyet 100, Gyrmyzy bugda, and Nurlu 99 genotypes, respectively. In the leaf samples, no polymorphism was detected in the Gyrmyzy bugda genotype, found in the range of 0–25% in Jumhuriyet 100 and 0–56% in Nurlu 99.
Comparison of 30-day-old callus and leaf samples revealed polymorphism in the range of 0–50% in Jumhuriyet 100, 0–80% in Gyrmyzy bugda, and 40–86% in Nurlu 99.
When comparing 15- and 30-day-old callus cells, polymorphism 0–50% was detected in Jumhuriyet100, 40–80% in Gyrmyzy bugda, and 43–67% in Nurlu 99. Comparison of leaf samples revealed a polymorphism of 0–100% in 15- and 30-day-old Jumhuriyet, 33–88% in Gyrmyzy bugda, and 0–88% in Nurlu 99.
Based on cluster analysis with the Jaccard similarity index, the samples were grouped into six main groups. In vitro, 15- and 30-day-old callus samples were subjected to salt stress at various NaCl concentrations (150 and 200 mM NaCl).
Callus samples No. 4, 6, and 1 were grouped individually in each of clusters 1, 4, and 6. Samples 2 and 9 were placed in the 2nd group, 7 and 8 in the 3rd group, and 2 and 3 in the 5th group (Fig. 2). Based on the results of the analysis, the lowest genetic distance index was between samples 1 and 7 with a value of 0.24. The next lowest similarity was equal to the distance index of 0.25 in samples 2 and 7. Finally, the highest genetic distance index was recorded between samples 2 and 3, with a value of 0.76.
Based on the Jaccard similarity index, leaf samples treated with 150 and 200 mM NaCl for 15 and 30 days were grouped into four main groups. In each of the first and third groups, leaf samples No. 8 and 4 were grouped individually (Fig. 2). Samples No. 7 and 9 were located in the second group, and samples No. 2, 3, 5, 6, and 1 were located in the largest group, the 4th group.
Statistical analysis showed the lowest genetic distance index between samples 1 and 8 with a value of 0.32. The next-low similarity was equal to a distance index of 0.36 between samples 4 and 8. The highest genetic distance index was found to be between samples 2 and 3, with a value of 0.92.
Fig. 2.
Dendrogram of wheat callus culture and leaf generated by Cluster Analysis using the UPGMA method based on HOUBA, SUKKULA, and SIRE 1 primers. Description: Jumhuriyet 100 (1-control, 2–150mM NaCl, 3- 200mM NaCl); Gyrmyzy bugda (4-control, 5–150mM NaCl, 6- 200mM NaCl); Nurlu 99 (7-control, 8–150mM NaCl, 9- 200mM NaCl).
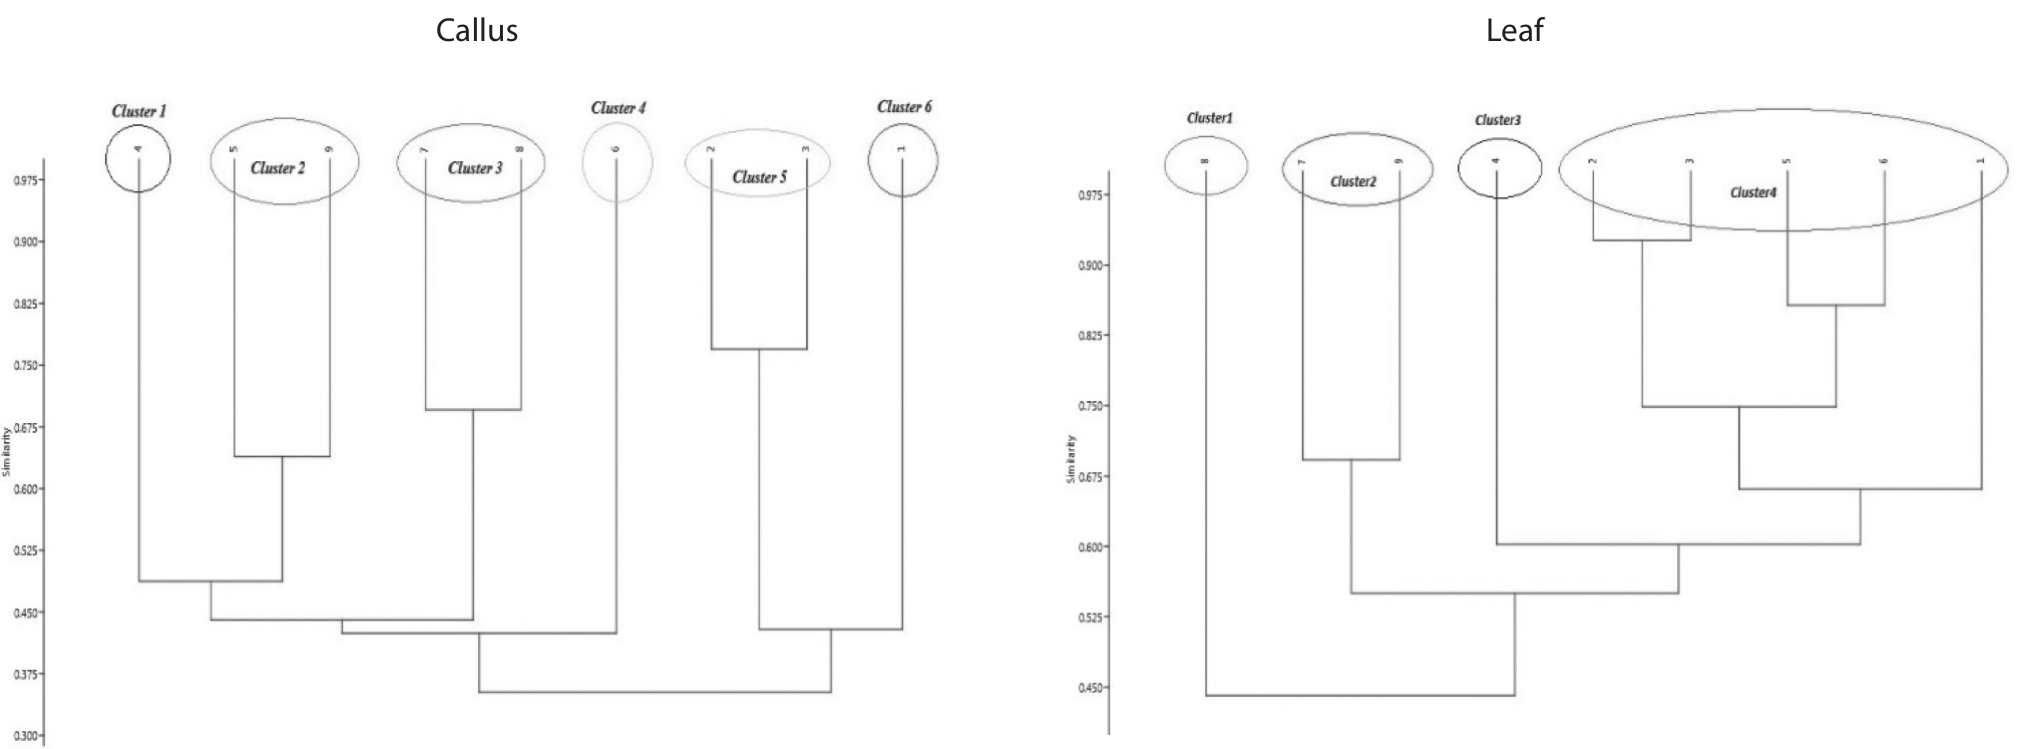
Table 4.
SIRE1 retrotransposon polymorphism ratios among groups calculated with Jaccard’s coefficient.
Discussion
During the ontogeny of the plant, retrotransposons maintain their silent state, and this inactivity is disturbed by the effect of stress, bringing them to an active state. In addition to abiotic and biotic factors, in vitro cultivation is also considered a stress factor for retrotransposons. This may reflect a survival strategy based on plant biology, and may also be a stress-induced generator of genomic diversity [26, 27]. This idea was also confirmed in our research, as the determination of the polymorphism activity of retrotransposons in callus culture and intact plants grown in both control and stress media under in vivo and in vitro conditions showed that in both leaf and tissue cultures of wheat plants, both autonomously or non-autonomous processes occurred depending on different concentrations of salt stress, tissue culture conditions, and duration.
Salt stress affects both in vitro cultured callus cells and plant growth and development in soil. In this study, concentrations of NaCl of 150 mM and 200 mM did not have a dramatic effect on callus proliferation and biomass accumulation dynamics, as well as plant growth and development.
The proliferation of the Nurlu 99 genotype callus culture was intensified from the middle of the second subculture under control conditions, as well as under salt stress conditions.
The polymorphism values of rice-specific HOUBA, barley-specific SUKKULA, and soybean-specific SIRE 1 retrotransposons again demonstrate that in vitro cultivation conditions are stress conditions that increase retrotransposonsˈ mobility. Therefore, the polymorphism indicators at NaCl concentrations of 150 mM and 200 mM in 15- and 30-day-old callus cultures were significantly higher than those in intact plants grown in vivo at the same concentration.
The fact that retrotransposons are more active in callus culture confirms again that in vitro conditions are stressful. High indicators of callus tissue can be explained by the presence of dual stress. Thus, both in vitro conditions and the use of NaCl salt increased the stress.
Analysis of intact plants showed that retrotransposon mobility was not detected on the 30th day of stress in the sensitive Jumhuriyet 100 genotype. On the contrary, the percentage of polymorphism increased on the 30th day in the tolerant Nurlu 99 variety. Gyrmyzy bugda, a durum wheat genotype, is considered a medium-tolerant plant. On the 30th day of exposure to stress, the percentage of polymorphism was significantly reduced in this genotype. In our opinion, increased or decreased retrotransposon activity under the influence of stress factors may be related to the salinity resistance characteristics of genotypes.
Based on the research results of Yuzbashioglu et al., the maximum polymorphism value of Houba retrotransposons studied by the IRAP marker method in the callus samples of the plant was 52% [28]. In another study by Kartal-Alacam et al., the value of polymorphism of Sukkula retratransposon in callus tissue samples of barley plants was calculated to be 61% [29]. Although these results are close to our results, they are relatively low. We can attribute this to twofold stress factors and genotypic characteristics because both cultural conditions and the influence of the selective environment affect the plant more as a stress factor.
These processes that occur under in vitro cultivation conditions can be explained by the destabilization of the genetic and epigenetic program of the plant tissue. This can lead to chromosomal changes (small insertions/ deletions) that induce somaclonal variations, as well as DNA sequence methylation and transposon activation [30, 31]. Changes in the genome as a result of increased mobility of retrotransposons in in vitro culture can lead to phenotypic and genotypic diversity of plants. If we take into account epigenetic changes as the main source of reconstruction of plant-regenerants under these conditions, then the idea that these changes are supported by the activity of retrotransposons is confirmed. According to Reinders et al., retrotransposons are activated in response to salt stress and increase the adaptation of plants to abiotic stresses by causing genuine genetic or epigenetic changes [6]. So, in our study, the location of callus No 1, 4, and 6, and leaf sample No 8 and 4 in a single cluster allows us to say that they are more tolerant compared to other samples. Therefore, the control variants of Jumhuriyet 100 and Gyrmyzy bugda, Nurlu 99 callus samples treated with 200 mM NaCl were more tolerant. We can also say that Nurlu 99 leaf samples treated with 150 mM salt and Gyrmyzy bugda control variants were more tolerant forms compared to others.
Based on the fact that retrotransposons, SUKKULA specific for barley, HOUBA specific for rice, and SIRE1 specific for soybean were detected in the three wheat genotypes using the IRAP marker method. It can be suggested that these mobile elements might enter the genome sequence during the evolution of the plant when wheat was domesticated. Therefore, horizontal transfer (HT) of genetic information through reproduction serves to protect the integrity of eukaryotes as well as plant species [32]. Although horizontal transfer mechanisms in plants are still not fully elucidated, according to Hou et al., HT is considered an important pathway for the innovation and evolution of host genomes [33]. In our studies, the detection of retrotransposons of rice, barley, and soybean in the genome of wheat cultivars allowed the creation of homomorphic band profiles. Avni’s view that this event was the major event in wheat genome formation, along with allopolyploidization, is consistent with our reasoning [34]. However, currently, there is insufficient information on the determination of retrotransposons characteristic of other plants in the wheat genome. Therefore, further genomic analyses are needed to determine at what time these specific retrotransposons entered the wheat genome.
Conclusions
The study of epigenetic changes in plants and the analysis of the results revealed the presence of SUKKULA, HOUBA, and SIRE1 retrotransposons specific for barley, rice, and soybean, respectively, in the wheat genome for the first time. Based on the results of the research, the determination of the activity of retrotransposon polymorphism in both leaf and tissue culture of the wheat plant has been confirmed. The idea that it occurs depending on concentrations, tissue culture conditions, and time has been confirmed. Activation of retrotransposons in response to salt stress and the ability to induce genetic or epigenetic changes increases the adaptation of plants to abiotic stresses.

