

Introduction
Ecosystem services are an important support for economic activities, and including them in Total Factor Productivity (TFP) and increasing Ecological Total Factor Productivity (EcoTFP) are essential to achieving economic transformation. With the increasing capacity of human beings to change nature and the long-standing pursuit of economic value, ecological space with natural resources such as clean water, soil, and the atmosphere is becoming increasingly scarce, and how to manage the waste of resources and environmental pollution in the process of rapid economic growth is a topic of general concern for scholars and society. Therefore, evaluating and guiding economic development by accounting for TFP and reflecting on resource inputs and environmental changes is necessary for promoting high-quality economic development and sustainable development of human society.
Accurate measurement of resource consumption and environmental change is key to accounting for EcoTFP, and ecological space with land as the carrier can well represent the resource consumption of economic inputs and environmental change in economic outputs. From an ecological space perspective, the relationship between economic activities and natural resources and environmental bodies is expressed as ecological services and ecological occupancy; that is, natural resources and the environment provide ecological services for economic activities, and the impact of economic activities on natural resources and the environment is expressed as ecological occupancy. Hayward posits that the occupancy of ecological space is expressed as an Ecological Footprint (EF) and that the EF fully reflects the use of resources and environmental impact [1]. Kolers suggests defining land use in terms of EF and argues that taxes based on the EF promote equity and land use [2]. The EF refers to the standard productive land required to provide resources for human consumption and to absorb waste emitted by humans and can be used to express not only the resource consumption of production activities but also the demand for environmental capacity of outputs [3], thus linking the natural resource environment and the socio-economy, which can reflect the sustainability of economic systems and the circularity of ecosystems. Relevant research also argued that the EF describes the impact of human land use behavior on ecosystems, expressing various natural capital as land and providing humans with independent productivity, and is an important indicator in the study of sustainable development [4, 5]. Therefore, the neglected service functions of ecosystems must be considered when accounting for productivity. Studying the relationship between ecological services and economic growth based on the EF and improving the accounting of TFP would fill a gap in the literature.
Next, the content of this paper is arranged as follows: firstly, the theoretical background, analyzing the development stages and different methods of TFP accounting through literature and pointing out the innovation of this paper; then, the research method and data sources of the article are introduced, and finally, the empirical results, including the spatio-temporal characteristics of EcoTFP and further analysis of convergence, and the discussion in comparison with the related studies. On this basis, summarize the research conclusions and propose policy recommendations, as well as the limitations of this article and future research prospects.
Theoretical Background
Two Stages of TFP Measurement
When environmental factors are considered, academic research on TFP can be broadly divided into two stages. The first stage is based on traditional economics, which does not consider the demand for resources and the impact of environmental changes on economic development, in which the demand for natural resources is used as an intermediate input and environmental changes are ignored, and TFP accounting does not consider them. Tinbergen was the first to introduce TFP to denote the growth of output due to all other factors of production except labor and capital, and it was used to measure the quality of economic development [6]. Solow distinguishes the quantitative increase of labor and capital in economic growth from technological progress (TP), defines TFP theoretically, and argues that the core of economic growth is the growth of TFP [7]. Jorgenson measures TFP by subdividing input factors into labor, capital, and land; decomposes the contribution of factor inputs to economic growth into quantitative growth and qualitative growth; and subdivides the TFP growth rate into savings in size, improvements in allocation, and advances in knowledge [8]. However, such research assumes that natural resources and environmental space are abundant and that economic growth is less constrained or negligible because of natural resources and the environment. With the increasing prominence of natural resource scarcity and environmental degradation, the sustainable development of the economy is experiencing serious challenges; ignoring the impact of natural resources and environmental factors on economic growth can lead to biased productivity measures. Thus, TFP research has entered a second stage based on the economics of sustainable development, which builds a unified analytical framework of resource-environmental and socio-economic integration to study the impact of natural resource depletion and environmental change on economic growth. Pittman was the first to include natural resource-environmental factors in the productivity measurement using the cost of pollution remediation as a proxy for undesired output [9], which provides a basis for measuring TFP and offers new ideas [10, 11].
Two Methods of TFP Measurement
From the input–output process of the natural resource environment and economic activities, energy conservation and emission reduction are two basic means of environmental management; thus, two methods have been used to measure TFP after considering resource-environment factors. One method is to control and reduce the undesired output in the output process, mainly using CO2, SO2, and COD as pollution proxies to account for pollution emissions such as non-consensual outputs [12]. The methodology of these studies mainly applies the directional distance function and the Malmquist–Luenberger productivity index to incorporate TFP and environmental pollution into a unified framework by increasing consensual output and decreasing non-consensual output to measure TFP [13, 14]. Although decreasing non-consensual output can achieve pollution control, another possibility is to reduce production and increase the burden on firms by taking inputs that would have been used to produce the desired output.
The second method considers natural resources and environmental costs in the input chain. In terms of indicator selection, energy consumption is used mainly as an input indicator [15], and some use pollution emissions as an input indicator [16]. Although accounting for TFP is treated differently, TFP measurement gradually incorporates natural resources and environmental factors into the analytical framework, compared with traditional studies that consider only capital and labor factor inputs. Notably, these studies have only considered natural resources and environmental factors in one chain of input or output in terms of indicator selection and measurement methods, not the simultaneous impact of both resource consumption and environmental changes on economic growth. In addition, these studies redefine TFP after considering environmental factors, such as environmental TFP [17, 18] and green TFP [19-21].
EF and TFP Measurement
The comprehensive measurement of EcoTFP from both input and output links not only reflects the process of economic activity but can also reflect the contribution of resource inputs and the cost of environmental change. Li et al. construct eco-environmental evaluation indicators from the two dimensions of environmental damage and environmental construction using the environmental construction index as an input item and the environmental damage index as an undesirable output to define and measure EcoTFP [22]. However, this indicator does not reflect the role of the ecosystem but the input of ecosystem restoration and does not reflect the contribution of ecological services to economic activities. Ecological services supply natural resource factors and play the role of cleaning up pollution and regulating the environment; thus, this indicator is ideal for integrating resource inputs and environmental costs from both input and output, which should be included in the EcoTFP accounting framework. However, because most natural capital and ecosystem service contributions are not marketed [23], quantifying them is key to scientifically measuring EcoTFP.
The current research has quantified mainly ecological services by using the EF and improving TFP accounting. Yue et al. argue that traditional single-factor eco-efficiency only considers ecological inputs and ignores other key inputs such as capital and labor, while total factor energy efficiency ignores other ecological inputs such as land and water, thus proposing a new total factor eco-efficiency indicator by including the EF with capital and labor as multiple inputs [24]. Xing et al. argue that the economic value of production activities is the result of the combined effect of ecological services and factors such as labor and capital and use the EF as an indicator to incorporate the production function and total factor analysis framework as inputs to construct the total factor eco-efficiency and total factor eco-productivity indexes [25]. Shen et al. define and construct sustainable TFP indices that incorporate two combined indicators (i.e., the EF and Human Development Index) into the traditional TFP framework by considering ecological inputs (e.g., energy consumption and building land) and the combined outputs of economic growth, life expectancy, and educational attainment to measure sustainable growth [26]. Although these studies have used the EF to quantify the ecological services in the input chain, they have not considered the changes in the EF of the output chain. The EF that exceeds the Ecological Carrying Capacity (EC) is expressed as an Ecological Deficit (ED), which can better reflect the environmental costs of economic activities, and its inclusion in the EcoTFP accounting framework can fully reflect the interlinkages among resources, the environment, and economic development from the input–output process.
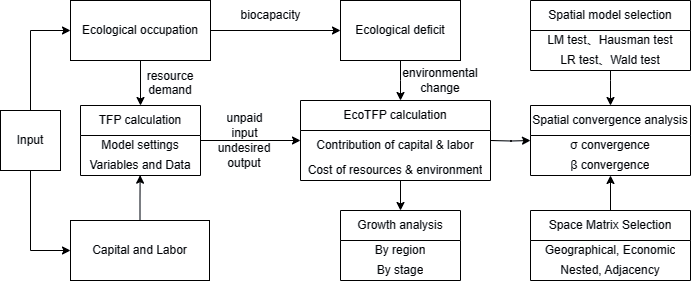
Thus, based on calculating the EF and ED of 30 provincial regions in mainland China from 1998 to 2017, this paper first considers the EF in the input link to account for TFP and then further considers the ED in the output link, defining and measuring EcoTFP to study the impact of ecological services and EF changes on economic growth and compare EcoTFP and its trends across regions, as presented in Fig. 1.
The two main innovations are as follows. First, the EF is used to represent the demand for natural resources by economic growth; the ED is used to represent the impact of economic growth on environmental change, and the ecological service functions of ecosystems in providing natural resources and purifying the environmental pollution for economic activities are measured such that the contributions and constraints of ecosystems to economic growth are reflected in the input–output process. Second, the EF and ED are integrated into the TFP accounting system to build a unified analytical framework for resources, the environment, and economics; EcoTFP as productivity is defined after deducting the contribution of resources and other factors in the input chain and the environmental costs in the output chain and innovating the TFP accounting method; and the regional and stage characteristics of China’s economic growth under resource and environmental constraints are comprehensively analyzed.
Materials and Methods
Stochastic Frontier Analysis
Stochastic frontier analysis (SFA) is a common measure of TFP [27, 28], and the model can be represented as:
Where Yit represents the output of i production unit at period t, Xit represents the factor input, t represents the time trend of technological progress (TP), and F[-] represents the leading edge of producer technology, that is, the maximum output with full efficiency. ϑ is the random error term, which represents the external influence factors of the economic system and the statistical error of the data. μ is the term for technical inefficiency, a non-negative random variable that measures the distance between the actual output Yit caused by technical inefficiency and the maximum possible output F[-], and exp(-μ) is the production technical efficiency (TE).
The trans-log production function considers not only the factors of technological progress but also the interactive effects of technological progress and input factors and the substitution effect between input factors, which can better avoid the estimation bias due to the incorrect setting of the form of the production function and thus improve the accuracy of the estimation. Therefore, the trans-log production function is a suitable expression for SFA, and the SFA based on the trans-log production function can be expressed as:
Where Y represents total output, X represents capital, labor, and resource input, and m and its alias n represent the type of factor. t is the time trend variable introduced to examine the changes in TP over time. The parameter βm is the output coefficient of each element, βmm represents the interaction between the elements, βmm is generally considered to be the strengthening effect of the factor input, and βtm measures the interaction effect of capital, labor, and resource factors and TP.
TFP Calculations and Decompositions
The growth of TFP can be decomposed into TP, technical efficiency change (TEC), scale efficiency (SE), and allocation efficiency (AE); among them, TP refers to the rate at which the technological frontier changes over time after other factors are controlled. To obtain the partial derivative of time t from Equation (2), TP can be obtained:
The change in TE also affects the growth of TFP. To obtain the partial derivative of time t for TE, TEC can be obtained:
The production scale and the allocation of factors are important in determining output. To obtain the partial derivative of the logarithmic form of factor input from Equation (2), the output elasticity of factor X can be obtained:
Additionally, SE and AE are defined as:
Where
According to the definition of TFP, the change in TFP measures the output growth rate after eliminating the contribution of factor input growth, which can be expressed as the “Solow Residual” in growth accounting. Based on the aforementioned definitions and calculations, namely, Eqs. (3)-(7), to obtain the total differential of formula (2), TFP can be obtained as:
EcoTFP Calculations
With the introduction of ecological services into the TFP accounting framework, the outputs of productive activities involve both economic systems and ecosystems, that is, desired economic outputs and undesired environmental changes. Similar to natural resources, the environment and the social economy are interrelated and mutually restricted to form an organic whole; thus, economic growth must consider both the sustainability of economic output and the circularity of ecological factors. Economic security and ecological security can be ensured, but only if the economic growth rate is coordinated with the self-healing of the ecosystem. If the desired output grows permanently faster than the renewal rate of factor supply, the balance between the systems may be disturbed, leading to uncontrolled growth of undesired output.
Assuming that N types of inputs x are in the production process, yielding desired “good outputs” y and undesired “bad outputs” z. The production set can be represented as:
The output constraint is the equilibrium between the supply and demand of factors of production, which generally refers to labor and capital, and either a labor shortage or capital shortage may make production unsustainable. In this paper, we mainly consider the supply and demand of ecological services factors, where the demand for ecological services is expressed as the Ecological Footprint (EF) and the supply is expressed as the Ecological Carrying Capacity (EC). Thus, the constraints on sustainable production can be expressed as:
The environmental change in the ecosystem is manifested as an Ecological Deficit (ED) or an ecological surplus. According to the relevant calculation method of the EF, the ED is the difference between the EC and the EF:
When the EF is below the EC, the ecosystem has a surplus and does not produce undesired outputs; when the EF exceeds the EC, the ecosystem has a deficit and forms undesired outputs. This paper refers to the United Nations System of Integrated Economic and Environmental Accounting’s idea of green economy accounting, which deducts resource and environmental depletion, uses undesired output (d) to represent resource and environmental depletion, and defines green output as the production of expected output minus undesired output; that is, the undesired output requires some compensation of expected output. Thus, green output (G) can be expressed as:
If the ecosystem has a surplus, that is, there is no undesired output, then the green output is equal to the expected output, and its dynamic growth rate is also the same; that is, the TFP growth rate is the same as the EcoTFP growth rate. If the ecosystem has a deficit, the growth rate of green output is the difference between the growth rate of expected output
Considering the different EC endowments in different regions, to conduct the most effective comparison of ecosystem changes across regions, this paper uses the deficit ratio instead of deficit volume to measure undesired output. The ED ratio is the ratio of ED and EC, and this paper defines resource and environmental depletion as ED change, which is:
Based on the definition of TFP and the accounting method, this paper defines EcoTFP as the productivity of economic growth after deducting the contribution of factor inputs and the depletion of resources and the environment; that is, the growth of undesired output is deducted from the growth of TFP. In this manner, not only the value of resources but also the environmental costs are deducted from the output, which can reflect the economic growth and ecological services more comprehensively. Based on the aforementioned analysis, the growth rate of EcoTFP can be expressed as:
Variables and Data
Selection of Variables
(1) Economic output: The gross national economic output measure is generally real GDP at comparable prices, which is more consistent with macro studies. This paper converts nominal GDP into real GDP for each provincial administrative district at comparable prices (100 in 1997).
(2) Capital: Capital inputs are defined as the services the capital stock provides, but the actual available data do not make such measurements and require theoretical derivation. In TFP studies, capital stock indicators are often chosen, usually using the perpetual inventory method, and this paper refers to Shan [29] and extends the regional capital stock to 2017.
(3) Labor: Labor input should be the flow of services provided by factors over a certain period of time, not merely the amount of the factor input but also related to factors such as the quality and efficiency of utilization. Accounting involves working hours and labor wages; however, the relevant data in China are either unavailable or their accuracy is unknown. Therefore, this paper uses the approach most of the literature adopts, that is, using the number of employed laborers.
(4) Ecological services: Ecological services are generally expressed as resource inputs and environmental outputs. In this paper, the EF measures the inputs of natural resource factors, and the ED represents the environmental changes caused by undesired outputs. Thus, both the actual resource inputs and the ecological services demanded by the purification of undesired outputs can be considered.
Data Sources and Processing
The data were obtained from the China Statistical Yearbook, China Agricultural Yearbook, China Rural Statistical Yearbook, China Energy Statistical Yearbook, and China Population and Employment Statistical Yearbook from 1997 to 2018 (https://data.cnki.net/).
This paper’s EF calculation includes two parts: the biological EF and the energy EF. One part is the biological EF, which calculates the land demand based on the consumption of major agricultural products, including crops such as grain, vegetables, vegetable oil, wine, and cotton for cropland, livestock products such as pork, beef, lamb, poultry, eggs, and milk for grassland, and melons, fruits, and timber for forest land. The other part is the energy EF, accounting for the land required to absorb CO2 emissions from the consumption of coal, coke, crude oil, gasoline, kerosene, diesel, fuel oil, and natural gas. EF’s calculation method and parameter selection refer to some related research [30-32].
Results and Discussion
Parameter Estimates
Table 1 reports the parameter estimation results for the SFA model based on the trans-log production function derived using Frontier4.1 and Stata16. Only the labor and ecological interaction terms are nonsignificant, and all explanatory variables are significant at the 1% level except for the ecological self-interaction term and the constant term. The variance of the inefficiency term accounts for γ and is close to 1, suggesting that efficiency losses have a large impact on real output and that using an SFA model that considers the inefficiency of the production technology is appropriate.
TFP and EcoTFP
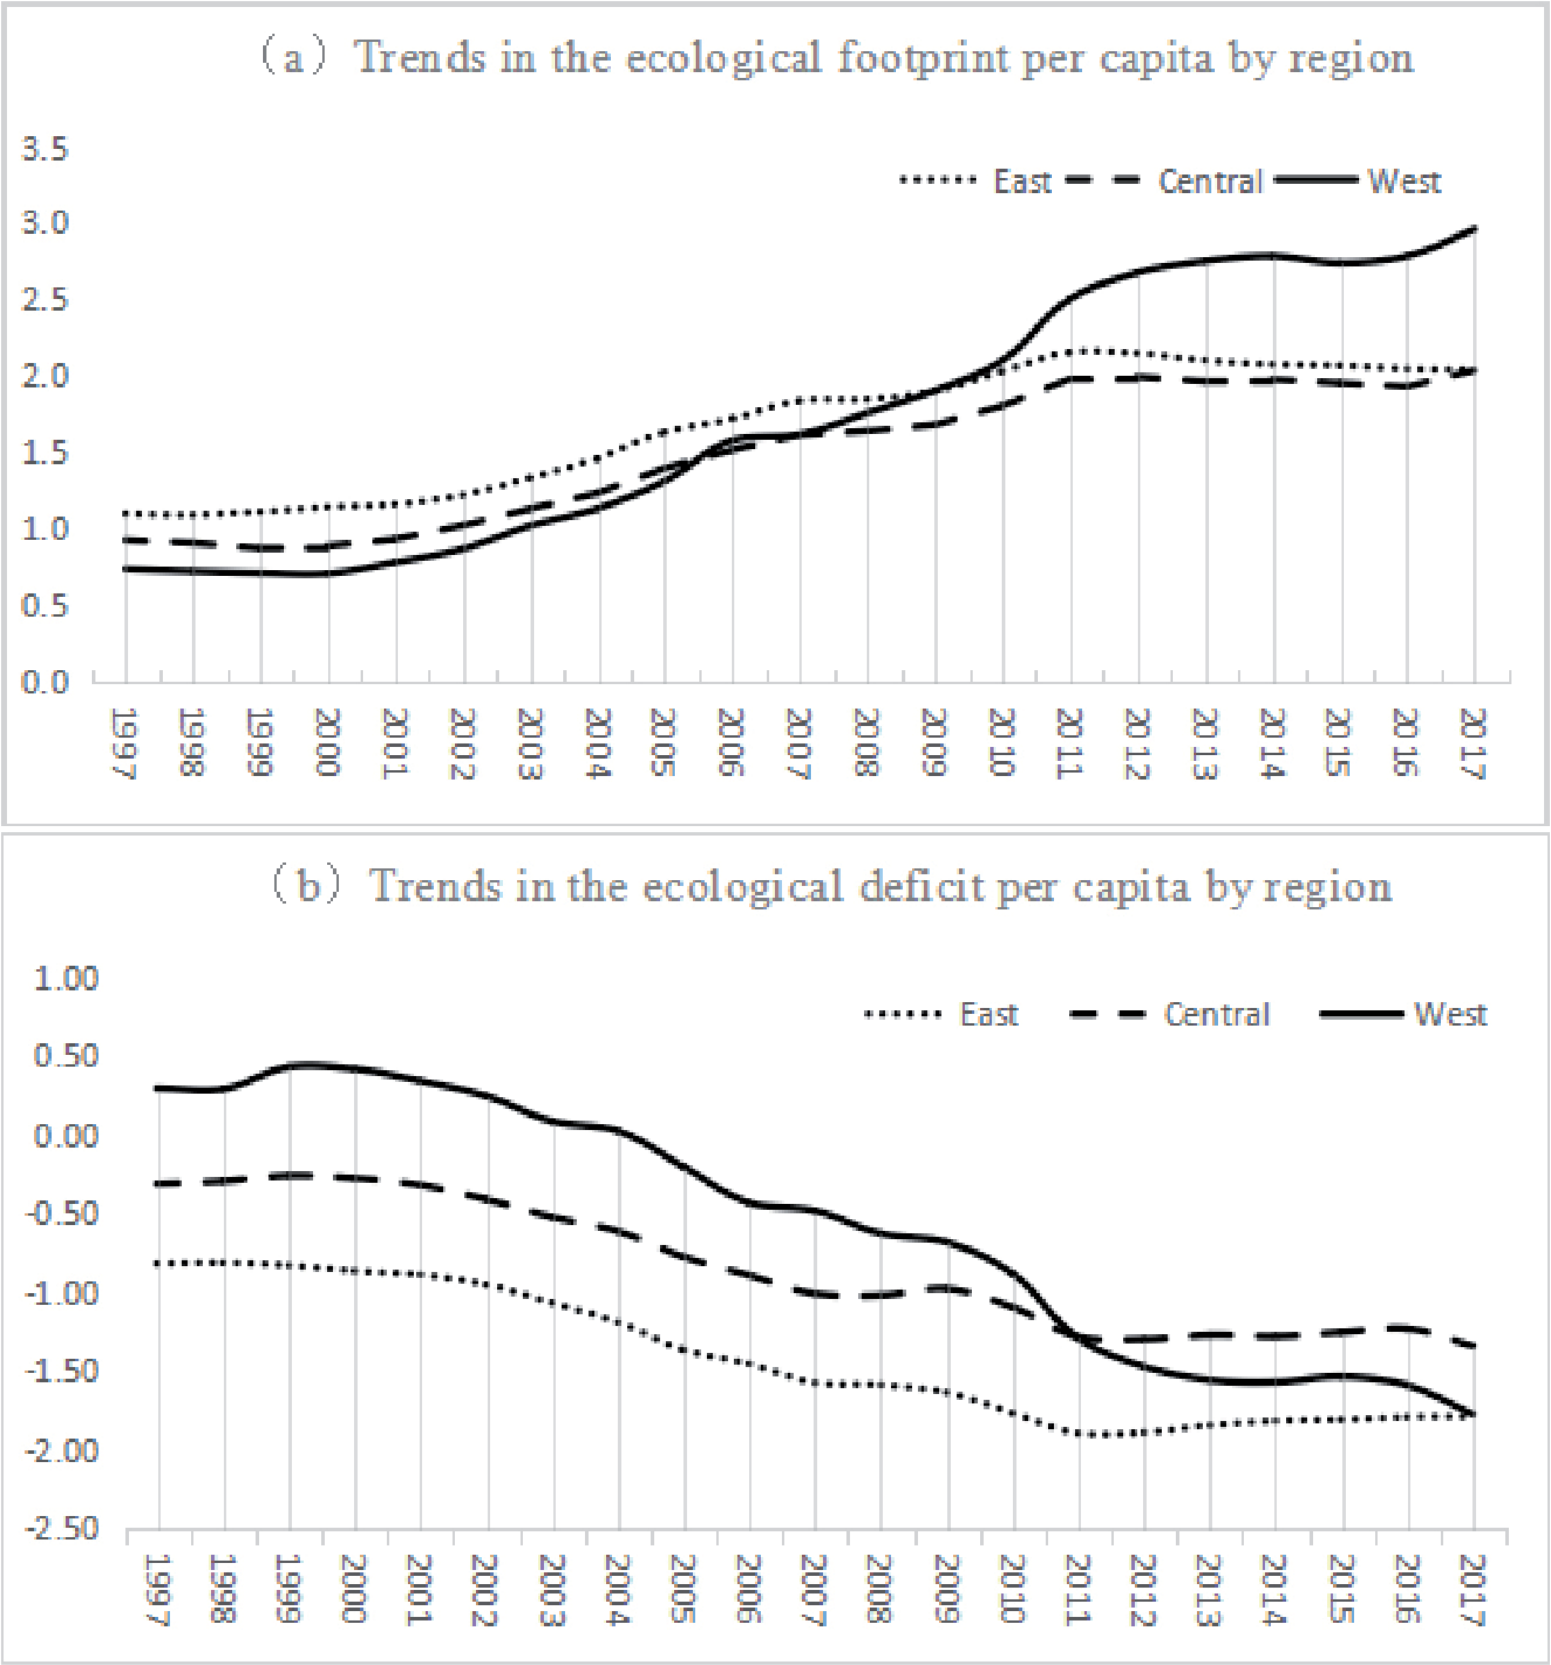
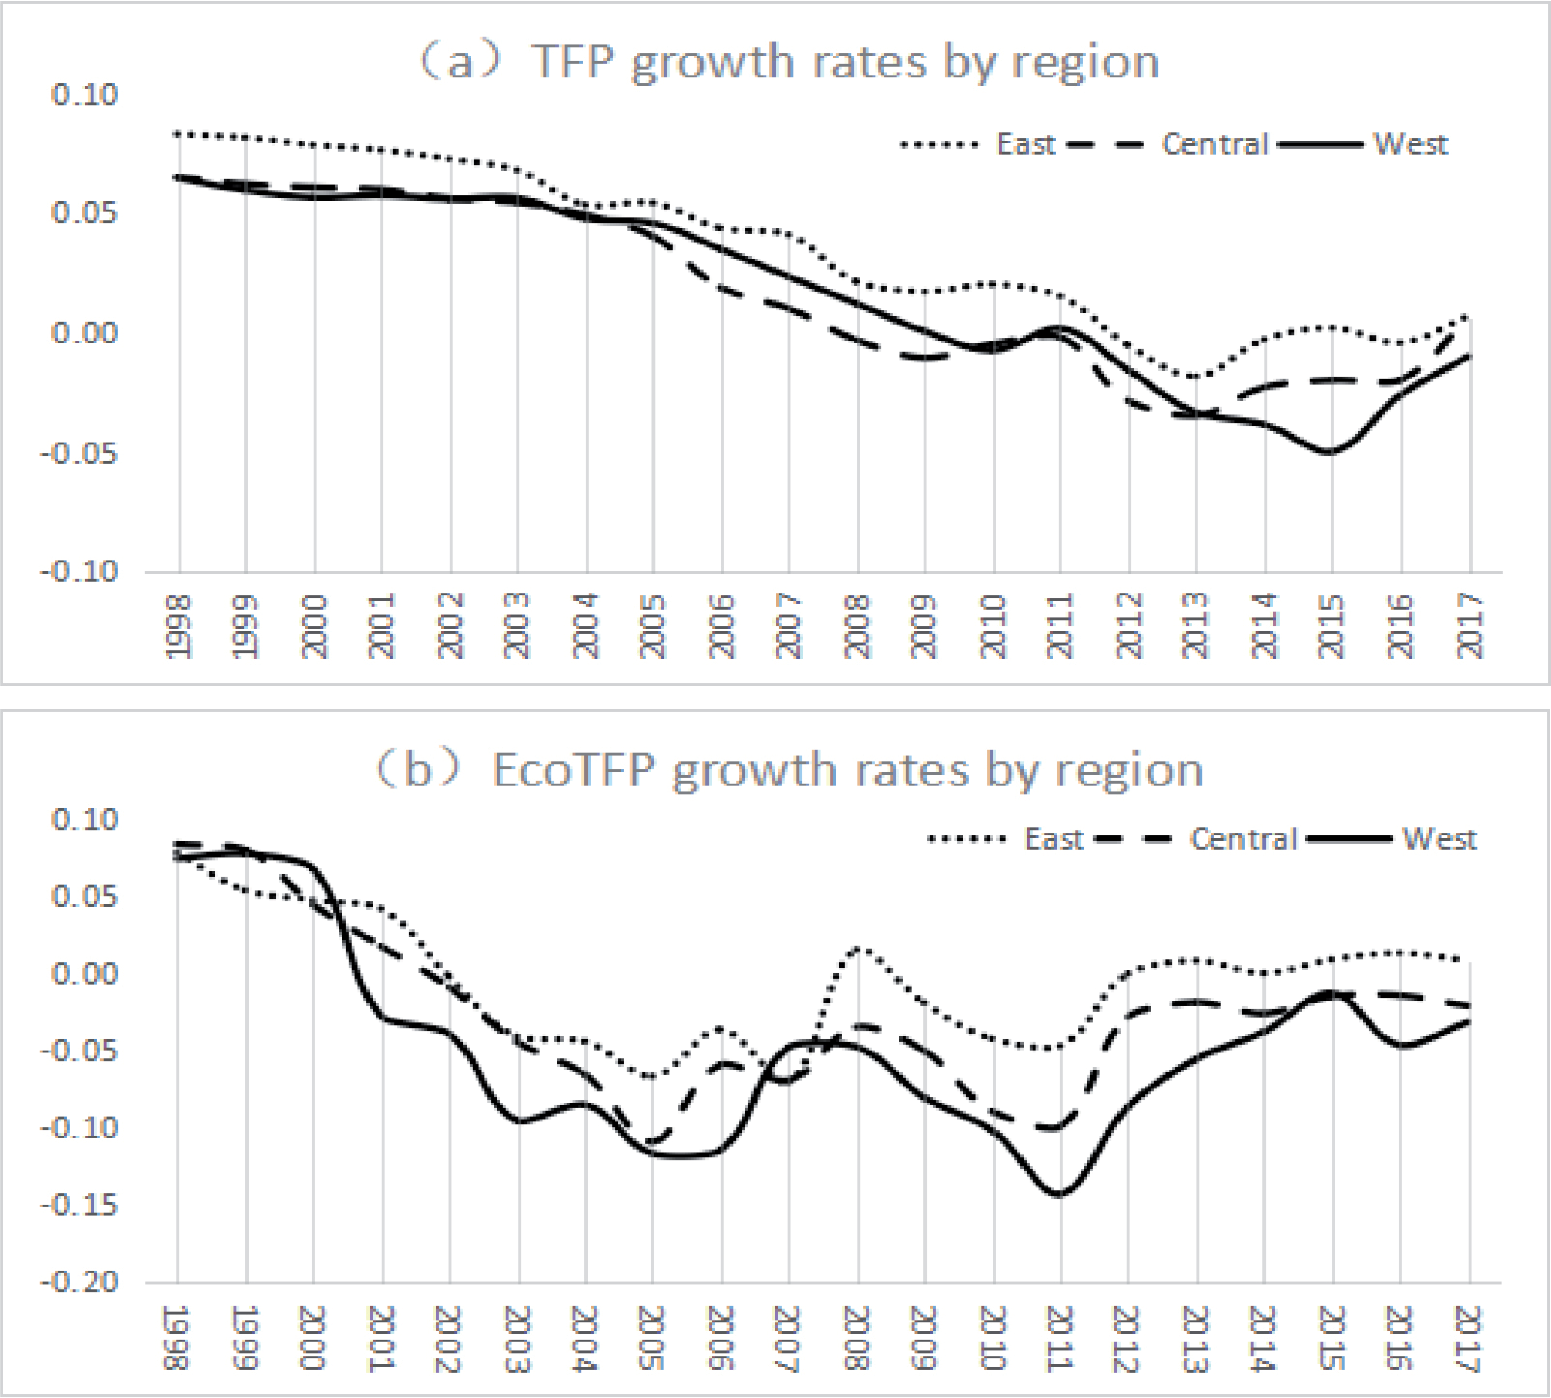
According to the aforementioned calculation and formula (8), TFP can be obtained, and EcoTFP can be further acquired according to formulas (11) and (12). Fig. 2 shows the trends in EF and ED per capita by region. Fig. 3 shows the trends in TFP and EcoTFP growth rates by region. Fig. 4 shows the average annual TFP growth rate and EcoTFP growth rate for the three periods 1998- 2003, 2004-2010, and 2011-2017 for all regions of the country.
Table 1.
Results for the SFA model based on the trans-log production function.
TFP Growth
After considering the contribution of ecological services to the economic growth process, the TFP growth rate calculated in this paper shows a decreasing trend (Fig. 3a)). Compared with the traditional TFP growth without considering ecological services, the TFP growth rate in this paper is relatively lower, and the downward trend is more obvious. The three regions— east, central, and west—started to show negative growth in 2012, 2008, and 2010, respectively, with the east and central regions reaching the lowest point in 2013 and the west reaching the lowest point in 2015, after which the degree of decline gradually diminished and showed a recovery trend. In terms of regions, TFP growth in the east is always higher than that in the central and west, with Hainan and Shanghai having relatively high average levels and Shanxi, Henan, and Yunnan having lower levels. In terms of staged characteristics, the national average growth rate was approximately 6.9% in the early stage; Hainan and Shanghai were as high as 10.18% and 9.27%, respectively, and Guizhou was the lowest at 4.34%. The medium-stage average growth rate was approximately 2.5%; Hainan and Shanghai were as high as 5.86% and 5.79%, respectively, and Guangxi was the lowest at -0.30%. The average growth rate in the later stage was approximately -1.41%, with the highest being 3.09 in Shanghai and the lowest being -7.75% in Yunnan. In terms of the composition of TFP, because of the continuous decline in TE and negative growth in SE, although TP has maintained a high level and continued to grow, the growth of TFP is mainly contributed to by TP.
EcoTFP Growth
Considering the impact of the ED on economic growth, the EcoTFP growth rate (Fig. 3b)) is lower than the TFP growth rate, indicating that the ED is still growing. The trend of EcoTFP growth in the three regions—east, central, and west—is relatively consistent, experiencing a W-shaped fluctuation, with inflection points occurring in 2005, 2008, and 2011. Comparing the growth rates of TFP and EcoTFP shows that China’s environmental policy to intervene in economic growth was strengthened in 2005, which curbed the growth of ecological occupation. Still, after 2008, the intensity of environmental regulation decreased for a short period, and the growth of ecological occupation led to a decline in the growth rate of EcoTFP.
After 2011, environmental policies restrained ecological occupancy for a short period, and the downward trend of the EcoTFP growth rate rebounded; however, the EcoTFP growth rate remained stable while the TFP growth rate increased, indicating that environmental policies were ineffective in restraining ecological occupancy after 2012. Because the growth of ED in various regions was not effectively controlled, EcoTFP began to show negative growth after 2000, indicating that economic growth has incurred large resource and environmental costs, the growth of ED exceeds the growth of economic output, the corresponding ecological depletion is not reflected in the traditional GDP and TFP accounting, and the repair of these ED exceeds the material wealth created by ecological consumption.
According to the average level of each region, the east and west have the highest and lowest growth rates of EcoTFP, respectively. From 1998 to 2005, the growth rate of EcoTFP in each region declined for the first time, with the West experiencing the greatest decline. Correspondingly, China began implementing the Western Development Strategy, and the EF increased annually. Since then, China has officially joined the WTO. The industry is opening to the outside world, and its development is accelerating; thus, we can infer that the decline in the growth rate of EcoTFP at this stage is because of the increase in the ED. After 2005, the downward trend of the EcoTFP growth rate in various regions of China began to recover, which continued until the 2008 financial crisis. During this period, China’s economic growth was guided by the concept of scientific development, and it was committed to building a resource-saving and environmentally friendly society. Although the growth of TFP declined during this period, the growth of the ED rate was controlled, thus achieving the growth of EcoTFP. After 2008, the growth rate of EcoTFP declined for the second time, which may be due to the impact of a 4 trillion yuan stimulus investment during the financial crisis and the rapid development of the real estate market, which led to an increase in ecological occupation. After 2011, the growth rate of EcoTFP rebounded. With the promotion of ecological civilization construction in China, the growth rate of EcoTFP increased slowly, and from 2012, the East began to achieve positive growth.
At the provincial level, Beijing, Shanghai, and Tianjin achieved EcoTFP growth with average annual growth rates of 7.26%, 5.89%, and 1.82%, respectively. However, the amount of ED per capita is relatively high in these regions, and this growth only indicates that the growth of the ED in the region is under control. Among these locations, the regional ED in Beijing decreased from 2006.36 million hectares in 1997 to 14.672 million hectares in 2017; the ED per capita decreased annually; the corresponding time EF per capita decreased from 1.72 hectares to 0.75 hectares; and the ED per capita decreased from 1.62 hectares to 0.68 hectares. EcoTFP showed negative growth only in 2004. The relatively low growth rate of EcoTFP is mainly in the western regions such as Inner Mongolia, Ningxia, and Shaanxi, where the ED per capita has increased annually and led to negative growth of EcoTFP, with average annual growth rates of -8.71%, -8.48%, and -6.16%, respectively. Among these locations, Inner Mongolia started to experience ED in 2005, declining from an ecological surplus area of 29.35 million hectares in 1997 to an ED area of 106.98 million hectares in 2017. The EF per capita during the corresponding time increased from 1.27 hectares to 7.34 hectares, and the ecological balance decreased from an ecological surplus of 1.26 hectares per person to an ED of 4.24 hectares per person. From these data, we observe that although all regions in China have ED in their economic growth, only Beijing and Shanghai have effectively controlled their ED. However, the West’s development in recent years still has extensive growth that destroys the ecological environment.
To make the observed EcoTFP more stable, this paper divides the observation period into three stages bounded by 2003 and 2010 and calculates the average value of each stage, as presented in Fig. 4. The national EcoTFP growth rate was 2.26%, -6.27%, and -3.02% in the three stages, indicating that the EcoTFP growth has declined and rebounded, while the TFP growth has been declining over the same period, with growth rates of 6.52%, 2.50%, and 1.41% over the three periods; thus, the EcoTFP growth in the third stage has benefited from the control of the ED.
In the first stage, the growth rates of EcoTFP in the east, central, and west were 3.03%, 2.93%, and 1.00%, respectively, with the highest growth rate in Beijing and the lowest in Ningxia, 9.81% and -9.99%, respectively, which was mainly due to the rapid growth of the ecological occupation in Ningxia from 2001 to 2003. In the second stage, the growth rates of EcoTFP in the east, central, and west were -3.73%, -6.78%, and -8.46%, respectively, with the highest growth rate in Shanghai and the lowest in Inner Mongolia, respectively, 6.16% and -17.75%, which was due to the continued rapid growth of the ecological occupation in Inner Mongolia from 2003 to 2008, and especially in 2006, the growth rate of EcoTFP in the third stage was 58.23%. In the third stage, the growth rates of EcoTFP in the east, central, and west were -0.07%, -3.14%, and -5.88%, respectively, with the highest EcoTFP growth rate in Beijing and the lowest in Xinjiang, respectively, 6.52% and -10.56%, which was due to the rapid growth of the ecological occupation in Xinjiang from 2004 to 2013, with an average annual growth rate of 12.16%.
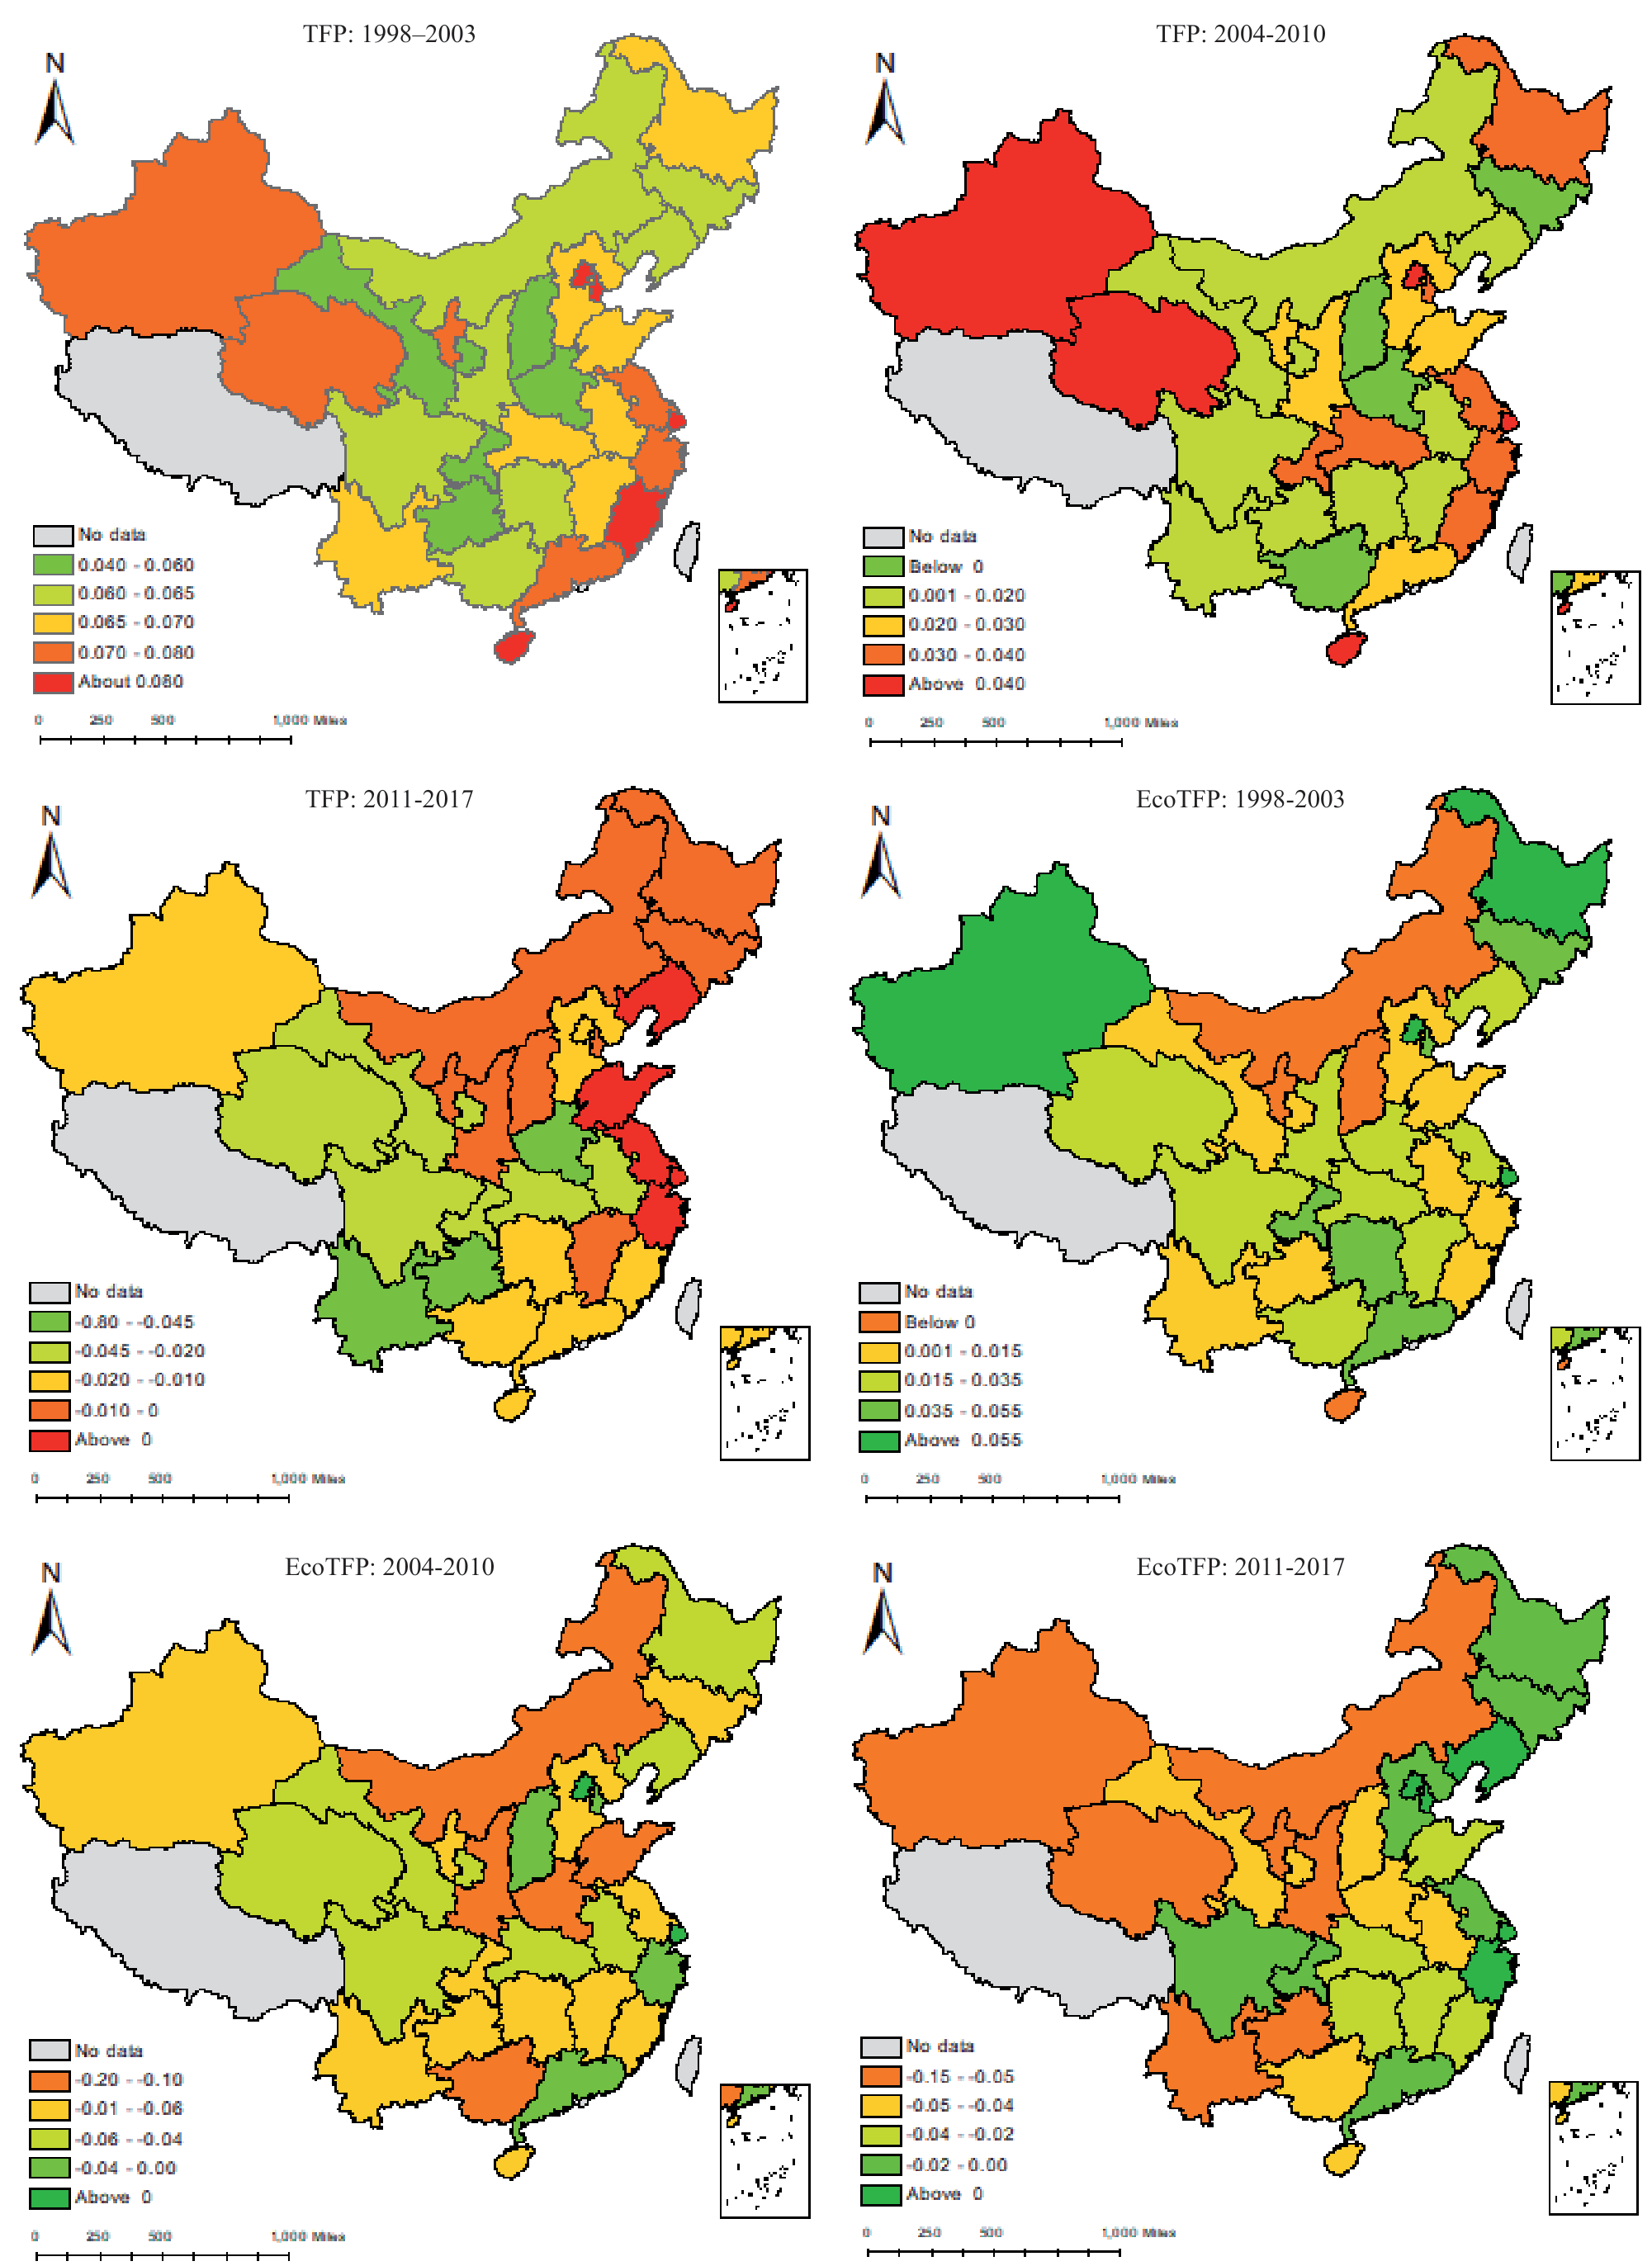
The characteristics of the three stages indicate that the higher EcoTFP growth rate is mainly in the east and lower in the west. Among them, Beijing is only lower than Shanghai in the second stage, probably because of the increased ecological occupation by the development of Olympic project-related industries during this period. The relatively low EcoTFP growth rate in the West is mainly in resource-based regions because of the rapid growth of ecological occupation driven by the rapid economic development and the relocation of industries in the East. As of 2017, only Qinghai had an ecological surplus nationwide, while Inner Mongolia, Heilongjiang, Xinjiang, Guangxi, and Yunnan began to experience ED in 2005, leading to a decrease in the EcoTFP growth rate. Additionally, the higher EcoTFP growth rate in the east is in the context of generally higher ED. The growth of EcoTFP benefited from the growth of TFP in the early stage and was mainly affected by the ED in the later stage.
Further Analysis
In order to further analyze the trend of EcoTFP growth among regions, this study will employ spatial econometric methods to conduct convergence tests and analyze the spatial differences and correlations in economic ecological development among regions. Common convergence methods include σ-convergence and β-convergence.
σ-convergence
σ-convergence refers to the trend and process of decreasing dispersion over time. The σ-convergence feature of EcoTFP growth rate can be determined by the temporal variation of the standard deviation coefficient σ. The formula for calculating the σ coefficient is as follows:
In the formula, EcoTFPij represents the EcoTFP of province i in region j,
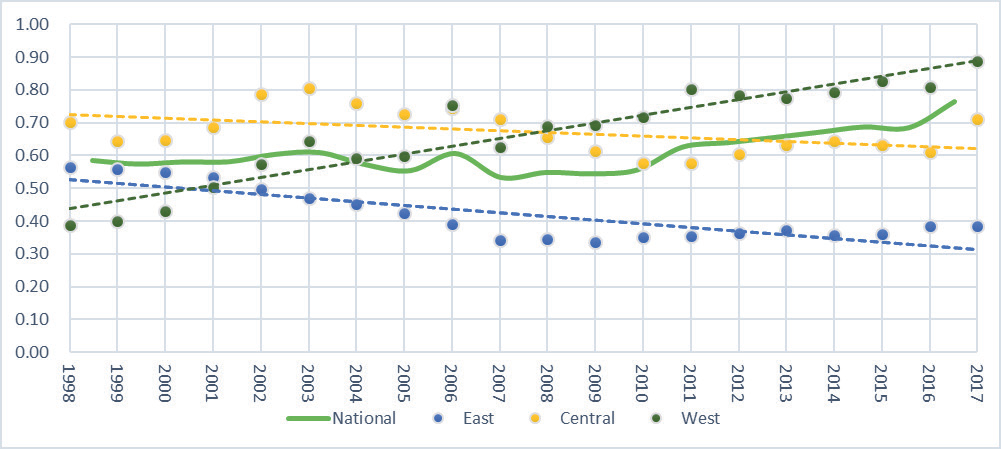
From the evolution trend of the coefficient of variation (Fig. 5), there are significant differences in the performance of the whole country and the three major regions of the East, Central, and West. The Eastern region shows a clear downward trend, indicating a convergence in ecological efficiency. The coefficient of variation in the whole country and the Western region shows an upward trend during the sample period, indicating a divergent characteristic in ecological efficiency, i.e., there is no σ-convergence, and the divergence trend in the Western region is the most significant, which greatly affects the ecological efficiency of the entire country. The coefficient of variation in the Central region does not show a clear upward or downward trend, indicating no obvious convergence or divergence characteristics. However, there is a clear convergence trend between 2003 and 2011 and a divergence trend before 2003 and after 2011, indicating that a consistent σ-convergence has not yet been formed during the sample period.
In conclusion, the gap in ecological efficiency in the Eastern region gradually narrows over time, the long-term convergence trend in the Central region is offset by the later rebounding divergence, and the inherent imbalance in the Western region continues to expand, evolving from the smallest gap among the three major regions to the largest gap.
β-convergence
β-convergence means that inefficient regions keep catching up with efficient regions at higher growth rates, i.e., the gap between the productivity of different regions gradually narrows and eventually converges to the same steady-state level. With the acceleration of resource flows and the enhancement of inter-regional interaction effects, it is necessary to incorporate spatial effects in constructing β-convergence. In this paper, the spatial panel Durbin model is introduced for the β-convergence analysis and assumes that EcoTFP growth also exhibits a convergence trend when not controlling for the effects of relevant socio-economic features. In other words, absolute β-convergence analysis is adopted. The model is as follows:
(17)
In the Equation, EcoTFPi,t and EcoTFPi,t+1 represent the values of EcoTFP in region i at time t and t+1, respectively. Wij is the spatial distance matrix, ρ is the spatial autoregressive coefficient, θ is the spatial spillover coefficient, μi, ωt and εit represent the regional effect, time effect, and random disturbance term, respectively. β is the convergence coefficient. If β<0, there is a negative correlation between the initial value of the explanatory variable and its growth rate, indicating a convergence trend in regional EcoTFP growth. Conversely, if β>0, there is a divergence trend. The convergence speed s during the observation period t can be calculated using the following formula:
For the selection of the spatial econometric model, the Moran index indicated the presence of spatial autocorrelation and the LM test determined that the spatial Durbin model (SDM) was applicable, while model screening based on the LR statistic and the Wald statistic rejected the null hypothesis that the SDM could be simplified to a spatial lag model (SAR) or a spatial error model (SEM), and, based on the Huasman test, the spatial and temporally fixed spatial Durbin model was selected. In order to test the robustness of the model based on the geographical distance matrix, this paper further uses the adjacency matrix, the economic distance matrix, and the nested matrix, respectively (Table 2), and finds that the direction, size, and degree of significance of the convergence coefficient β do not undergo any major changes when different weight matrices are used, and therefore the model is robust, and the empirical results are highly credible.
The Stata16 software fitting results (Table 3) indicate that the convergence coefficient β is significantly negative at a 1% confidence level. This suggests that, under the influence of geographical distance, the overall national EcoTFP growth and the growth in the eastern, central, and western regions will converge towards their respective steady-state levels. In other words, when not considering a series of economic, social, and other related factors that affect EcoTFP, regions with lower EcoTFP will experience faster growth, leading to a narrowing gap with regions with higher EcoTFP. Further analysis of the convergence rates in the three major regions reveals that the eastern and central regions have higher convergence rates than the national average, while the western region has a lower convergence rate. Specifically, the eastern region has the highest convergence rate (0.051), followed by the central region (0.043), and the western region has the lowest convergence rate (0.028). On a national level, the spatial autoregressive coefficient ρ is significantly negative, indicating that the global effect of the neighboring regions is negative, i.e., there is a competitive relationship between the regions in terms of efficiency enhancement, while the spillover effect θ of the spatial lagged value to other regions is significantly positive, indicating that the local effect of the neighboring regions is positive. Further, the decomposition of the SDM shows that the indirect effect is also significantly positive, indicating that the growth of EcoTFP in other regions is beneficial for improving local ecological efficiency.
Discussion
Measuring TFP from an ecological perspective is a new approach, and existing studies on ecological TFP do not provide a clear definition or quantify ecological occupation in economic activities [33-35], which is essentially no different from environmental TFP, resource TFP, green TFP, and sustainable TFP. In this paper, the EF is used to characterize the inputs of natural resources, and the ED is used to express the environmental changes in the output link, which is then incorporated into the TFP accounting system to measure the ecological services function of ecosystems in providing natural resources and purifying environmental pollution for economic activities. EcoTFP is further defined as productivity after deducting the contribution of factors such as resources in the input chain and environmental costs in the output chain. In addition, this study finds that national and regional EcoTFP growth exhibits a β-convergence trend, with the Eastern region showing the fastest and the Western region showing the slowest, which is contrary to the results of most literature [36, 37] but consistent with research on the convergence of energy efficiency and technological resource allocation [38, 39]. This indicates that there is a low-to-high accelerated catch-up effect within each region. Still, the highly efficient eastern regions are more likely to be influenced by knowledge and technological spillovers from neighboring areas. In contrast, despite starting with a larger initial gap and maintaining a catch-up trend, the western region still lags behind in terms of the speed of ecological efficiency improvement of its incremental outputs due to technological constraints and other factors. Meanwhile, only the eastern regions have a trend of σ-convergence, indicating that the improvement of its ecological efficiency is stable and continuous, while in the central and western parts of the country, due to resource endowment and economic and technological conditions [40-42], it is difficult for low-level regions to catch up with high-level regions, resulting in widening internal differences, and this is also true across the country.
Conclusions
In this paper, the ecosystem service function is incorporated into TFP accounting by quantifying the demand-side ecological occupancy, and EcoTFP is further defined and measured according to the decomposition of TFP and the introduction of ED as a non-desired output, based on which the convergence of EcoTFP growth is analyzed by using spatial measurement methods. The main conclusions are as follows:
(1) The EcoTFP growth rate was lower than the TFP growth rate, in which the TFP growth rate trended downward and eventually rebounded slightly, while the EcoGTFP growth rate experienced a W-shaped fluctuation. This finding indicates that economic growth imposes a high environmental cost, that the growth of the ED exceeds the growth of economic output, and that reducing the ecological occupation above the EC through the efficient use of natural resource inputs is necessary. Additionally, the difference between the TFP and EcoTFP growth rate fluctuations indicates that EcoTFP growth benefits from TFP growth in the early stages and is mainly influenced by the growth of ED in the later stages.
(2) EcoTFP growth rates are regionally distinct, with the eastern region having the relatively highest and the western region having the lowest in terms of convergence. However, there is a tendency for eco-efficiency of incremental outputs to catch up in the western region, and the regional convergence speed is slower than that in the eastern region. This finding indicates that the East has gradually realized transformation in the process of long-term leading economic growth and has been effective in transforming the growth mode and environmental regulation; the West, with a low growth rate of EcoTFP, is mainly a resource-based region driven by rapid economic development and industrial shift in the East, leading to the rapid growth of ecological occupancy. Moreover, the development of mineral extraction, real estate development, and other related industries has damaged the EC, further leading to the growth of ED.
Table 3.
Fitting Results of the Spatial Panel Model.
(3) The EcoTFP growth rate in Beijing and Shanghai is ahead of the rest of the country. With inter-regional industrial shifts and industrial transformation in developed regions, the growth of ED in regions that originally had high ED has gradually slowed, and regions that originally had ecological surpluses have begun to experience deficits and grow rapidly. Among them, Shanghai has controlled the continued rise of ED, Beijing has realized the reduction of ED annually, and the green pursuit of major projects such as the Olympic Games and World Expo is an effective vehicle to guide the transformation of growth patterns. In Western regions such as Inner Mongolia, Ningxia, and Shaanxi, where ED is low but growing too fast, the extensive growth mode that causes ecological depletion is unsustainable, and the government should control ED. The latecomer advantage will eventually degenerate into a latecomer disadvantage, forming a trap for the extensive development system.
In summary, this paper introduces ecological services into the TFP accounting system. We first consider the EF in the input link to account for TFP and then the ED in the output link, defining and measuring EcoTFP and thus innovating the TFP accounting method. By constructing a unified analytical framework for natural resources’ input, environmental change, and economic activities, this research method comprehensively reflects the intrinsic connection between natural resources, the environment, and economic development, which is of substantial significance for studying ecological services and economic growth. The results of this study not only reflect the contributions and constraints of ecosystems to economic growth in the input-output process but also the regional and stage characteristics of economic growth under the constraints of natural resources and the environment.
Policy Implications
(1) Controlling the growth of the ecological deficit. The top priority for China’s future development is to control the continued growth of the ED, gradually restore the service function of the ecosystem and the supply capacity of ecological products, and enhance the protection and construction of ecological functional areas through the mechanism of realizing the value of ecological products. Regions that have controlled the growth of their ecological deficits should adhere to environmental regulations, optimize their industrial structures, and promote high-quality development; regions that have not yet controlled the growth of their ecological deficits should seize the opportunity for transformation, change their growth patterns, and promote sustainable development.
(2) Leading green development with EcopTFP as the evaluation index. As the supply of a beautiful ecological environment becomes increasingly scarce and its demand grows, economic development should pay more attention to its quality and sustainability. It needs to be evaluated and guided more scientifically based on improving green indicators such as EcoTFP for economic transformation. All regions should maintain the strength and stability of their environmental regulatory policies and need to highlight environmental requirements in the construction of major projects and promote and guide green development through the construction of ecological and environmental protection demonstration projects.
(3) Improve EcoTFP according to local conditions. The eastern regions should control the ecological deficit in terms of volume, promote the reduction of construction land, and improve the efficiency of land use, and at the same time, give full play to their advantages in capital, technology, and talents and improve their economic performance through innovation drive. The central and western regions need to control the growth of ecological deficits in terms of speed while strengthening exchanges and cooperation with the developed regions in the east, focusing on the introduction of technology-intensive industries, the promotion of advanced technological achievements, and the improvement or elimination of outdated industries, in order to strike a balance between economic growth and environmental protection.
Limitations and Prospects
A more prominent limitation of this paper is that the data for the study is up to 2017; this is because the National Bureau of Statistics no longer publishes Fixed Capital Formation after 2018, making it difficult to calculate capital formation. Current studies on the subject have seldom been updated beyond 2018. Even though other methods can estimate it, there will be errors and inconsistencies.
In future research, EcoTFP can be updated using data and measured more accurately using a variety of methods. It can also be measured on smaller scales, such as the city level, so that the factors affecting EcoTFP can be better grasped through comparisons and empirical analyses.

