

Introduction
The Ba Ria – Vung Tau (BRVT) province in Vietnam has undergone substantial socio-economic growth, propelled largely by the rapid expansion of heavy industries, particularly steel production. This industrialization surge has been a linchpin in the region’s development but has concurrently brought about environmental challenges, notably regarding air pollution from steel factories. The steel industry, recognized for producing steel and steel billets from scrap, has become a central concern due to its significant impact on air quality in Phu My town. Despite the implementation of exhaust gas treatment facilities, questions linger about the effectiveness of these measures, leading to elevated levels of air pollution and prompting a localized assessment of their impact on the environment [1].
The investigation of air pollution within the steel industry has been the subject of extensive research, providing valuable insights into its complexities. In particular, studies have employed advanced models such as Long Short-Term Memory (LSTM), WRF-FLEXPART, CAMx, PHAST, ChemSTEER, and Gauss to simulate and analyze various aspects of air pollution associated with steel production. For instance, the estimation of the intricate relationship between steel production, economic growth, and emissions of CO2 and PM2.5 has been approached through the utilization of LSTM models [2]. Similarly, the diffusion of air pollution from specific steel mills, such as Jingtang and Wenfeng in Beijing and Tianjin, China, has been simulated using the WRF-FLEXPART model [3]. Furthermore, investigations have extended to different geographical contexts, with studies applying models like CAMx, PHAST, and ChemSTEER to simulate air pollutant concentrations from steel mills in China [4] and Iran [5, 6]. Notably, one study utilized the PHAST model to simulate concentrations of CO, SO2, and NO2 from the Takestan steel mill in Iran [5], while another employed the ChemSTEER model to study air pollution from the Iranian Ghadir steel plant [6].
In addition, a Gauss model was used to simulate PM10 emissions from a steel mill in Volta Redonda, Brazil [7] and in India [8]. Collectively, this body of research contributes significantly to our understanding of the diverse impacts of steel production-related air pollution on both the environment and human health. Beyond emissions, the studies also explore the ramifications for the health of both factory workers and individuals residing in proximity to steel factories [9]. The multifaceted consequences of steel production, as illuminated by this extensive research, underscore the need for comprehensive strategies to address the environmental and public health challenges associated with the steel industry.
In the wider context of global endeavors aimed at addressing climate change, the recent COP26 conference has underscored the pressing need to tackle environmental issues. The involvement of the steel industry in exacerbating air pollution resonates with the discourse and pledges articulated at COP26. Acknowledging the imperative of concerted efforts, the international community emphasized the significance of mitigating industrial emissions to advance toward overarching global climate objectives [10].
There are many model systems that can be used to simulate air quality on different scales, the most popular of which include: MM5-CMAQ [11]; FVM-TAPOM [12]; WRF-CMAQ, WRF-Chem; WRF-CAMx [13]; TAPM-AERMOD [14, 15]; TAMP-CALPUFF [16], etc.
In addition to utilizing models for assessing air pollution dispersion, investigations into determining the safe distance for the air environment have garnered considerable interest. This safe distance is crucial to ensuring that emissions from production activities do not adversely impact the daily lives and health of communities residing near the emission sources. Relevant studies include TAPM-AERMOD model system, which was employed to simulate air pollution dispersion from activities at Tan Tao Industrial Park, Ho Chi Minh City (Vietnam) [17]. This study aimed to establish the environmental safety distance for the surrounding area. Similarly, another study used the TAPM-AERMOD model system, to simulate the dispersion of air pollution from pig farming activities in Ho Chi Minh City (Vietnam) [18]. The objective was to determine the environmental safety distance for residential areas surrounding these activities. While existing research has laid the foundation by examining various aspects of air pollution, emissions, and their impact on health and the environment, a comprehensive and localized assessment specific to this region is lacking.
This study addresses this gap by integrating simulations, empirical data, and regulatory benchmarks. Its primary goal is to provide novel insights into the severity of air pollution, propose effective mitigation strategies, and define safety distances crucial for protecting the health and well-being of communities residing near steel production facilities. These contributions are not only essential for environmental policymakers and industry stakeholders but also for fostering sustainable industrial growth while ensuring the preservation of a healthy living environment.
Methodology
Study Area
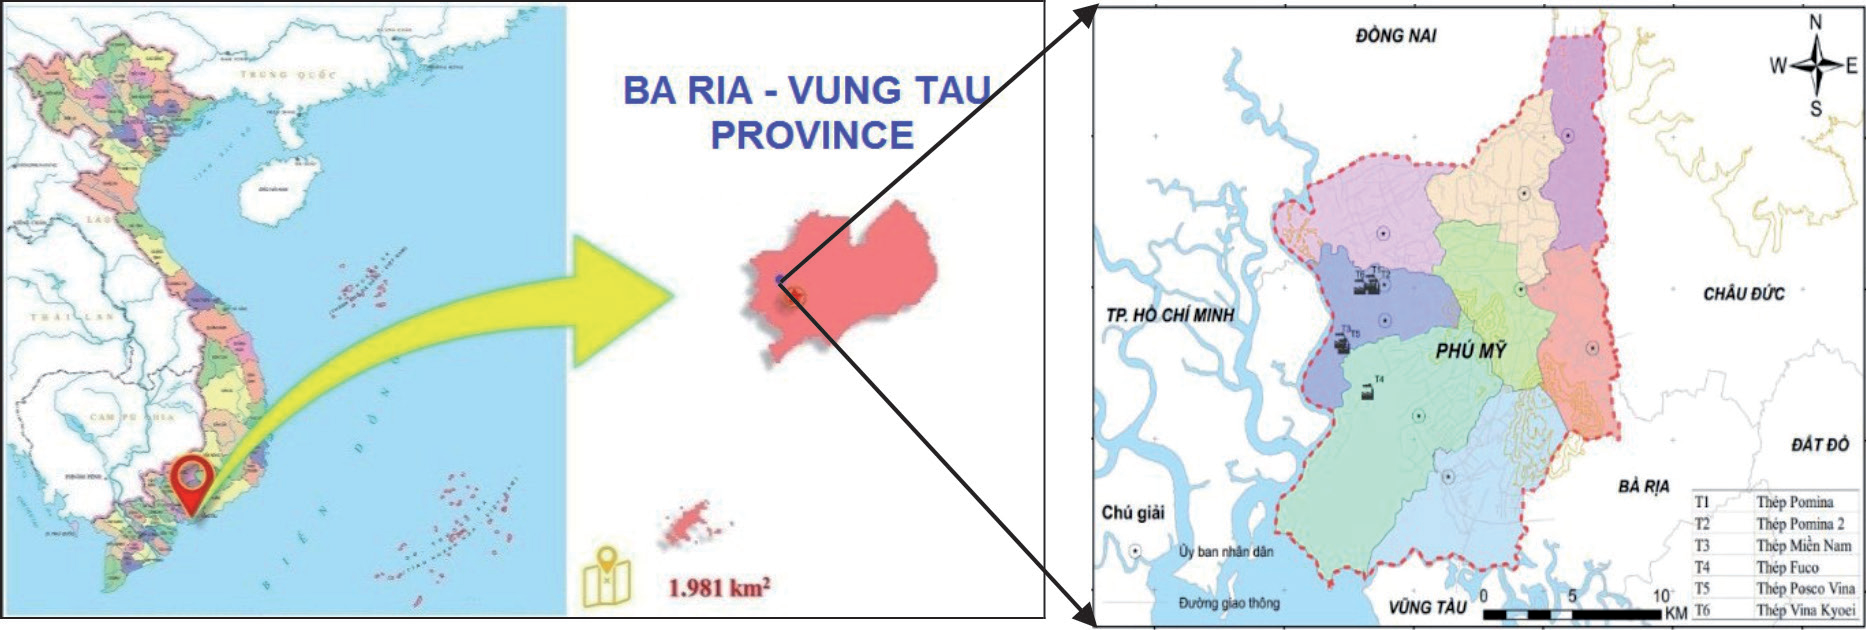
In Phu My town, there are now 6 steel production factories (smelting billet from scrap). In this study, we will investigate and calculate emissions for all 6 factories (Fig. 1), but only simulate air quality for 01 representative steel factory (NM1) located in Phu My 2 industrial park, because this steel factory has the same production technology as other steel factories, has a large capacity, and is generally representative of 6 factories. Air pollutants selected in the study include PM2.5, PM10, TSP, NOx, CO, and SO2.
Methodology
Collecting Data and Information
The data were collected from various sources as follows: Emission status data in the study area; Data on enterprises generating emissions from steel factories in Phu My 1 and Phu My 2 industrial parks; air quality moni toring data from companies in 2022; and meteorological data for the study area.
Investigation and Field Survey
Develop questionnaires, conduct surveys, and collect actual data at factories. The information that needs to be collected from surveys and interviews is mainly: Production technology, production capacity, fuel used in production, use of scrap to make steel, and information about exhaust gas treatment systems.
Calculating the Emissions Load
Calculate emissions based on emission factors as a formula:
Where E is the emission level (kg/year); EF is the emission factor (kg/ton); A: fuel used (tons/year) or products produced annually (tons/year); ER: efficiency of the air pollution treatment system (%). Emission factors are used from AP42 and EMEP/EEA.
Simulation of Air Pollution
From the overview of the above studies, it shows that each type of model has its own advantages and disadvantages. In this study, the TAPM-AERMOD model system was chosen because: The TAPM model is a model that runs on computers with the widely popular Microsoft Windows, forecasting all parameters meteorological (model using global meteorological data provided by the Australian Bureau of Meteorology); Easy-to-use modeling interface combined with GIS for easy-to-observe results; The AERMOD air quality propagation model is a widely used and popular model. The propagation simulation results are highly accurate.
– The TAPM model: this is used to simulate meteorological factors as input data for the AERMOD model. The Air Pollution Model (TAPM) is a model of the Australian Scientific and Industrial Research Organization (CSIRO). The input data of the TAPM model is global meteorological observation data and information about the simulation area such as coordinates, location, and terrain. The TAPM model simulates detailed meteorology using nested grid cells. In this study, the number of simulation domains chosen is 3 in size, from large to small: The first domain is with 40 x 40 grid cells and each grid cell size is 20km x 20km. The second domain is with 40 x 40 grid cells and each grid cell size is 10km x 10km. The final domain is with 40 x 40 grid cells and each grid cell size is 5km x 5km. The number of grid cells according to altitude in this study is taken from 10m to 8,000m and is divided into 25 vertical grid cells (nz = 25).
– AERMOD model: used to simulate air pollution dispersion at the steel factory selected in the study. The AERMOD model is an abbreviation for the AMS/ EPA Regulatory Model (AERMOD) and is specifically designed to support the EPA‘s management program. The input data of the AERMOD includes emission source data, meteorological data, and terrain data.
Calibrate and verify the model: Statistical formulas are used to evaluate the accuracy of the model with Pi as the simulated value, and Oi as the observed value.
Simulation error (S) %:
Correlation coefficient (R):
Using meteorological monitoring data from the automatic air monitoring station of the Toc Tien centralized waste treatment area to verify the TAMP model, and using additional monitoring data in the area and periodic monitoring data of steel plants to verify the AERMOD model.
The simulation period is 2022, in the dry season (in March) and the rainy season (in October).
Calculate the Environmental Safe Distance to the Surrounding Area
Based on the simulation results, take the following steps: Delineate areas with simulated pollutant concentrations higher than the allowable limit. Use the comparison method with QCVN 05:2023/BTNMT [19] to determine the boundary where the concentration reaches the allowable limit and calculate the safe distance from the waste source (factory). Areas with simulation results of concentrations of air pollutants exceeding QCVN 05:2023/BTNMT will be zoned and presented as a pollution distribution map. From the pollution distribution map by concentration, the safe isolation distances are determined more specifically according to the 1-hour average, 24-hour average concentration values, etc. Finally, after considering sensitive objects around the factory, a hygienic protective distance will be proposed to be applied.
Results and Discussion
Current Status of Operations and Air Pollution Control of Steel Factories in Phu My Town
Current Status of Steel Mill Operations
Based on the 2022 statistical data, Bà Rịa-Vũng Tàu (BRVT) province hosts six steel bille refining factories, collectively possessing a total steel production capacity of 2,174,549 tons per year. Specifically, the production of steel billets amounts to approximately 4,715,000 tons annually. These statistics highlight BRVT province as one of the nation‘s leading regions in steel production, particularly in the technology employed for manufacturing steel billets from scrap iron and steel. In this study, NM1 was chosen as a representative case to simulate air quality, focusing on the technological process involved in producing steel billets. The process entails the following stages: Scrap (alongside auxiliary materials) → Feeding house → Feeding line (comprising raw material tanks and rack lines) → Electric Arc Furnace (EAF) → Ladle Furnace (LF) → Intermediate tank → Continuous Casting Machine (CCM) → Resulting steel billet. Similarly, the technological sequence for producing shaped and round steel involves: Steel billet → Raw material house → Billet loading table → Billet furnace → Roller conveyor system and billet guide clamp → Shaped steel rolling line → Final products.
Measures to Control Air Pollution in Steel Billet Factories
Given the characteristics of the activities associated with emissions, all steel billet factories have installed exhaust gas treatment facilities. The particulate matter and exhaust constituents primarily stem from various stages of the steelmaking process, notably the loading process, EAF, LF, and internal operations within the factory premises. With production and exhaust gas treatment technologies in place, typically implemented through dust collector bag filter systems, under normal operating conditions and with production capacities not yet reaching their designed levels, these factories demonstrate compliance with the parameters outlined in QCVN 51:2017/BTNMT [20] during monitoring periods. However, upon reaching their designed production capacities, emissions predominantly comprise particulate matter, thereby exerting varying degrees of influence on the immediate environmental surroundings of the steel billet factories.
Some Issues with Air Pollution Control from Steel Mill Operations
According to the calculation results of the Steel Association and documents on cleaner production technology of the Ministry of Industry and Trade for the steel billet industry from scrap using electric arc furnaces, the amount of furnace dust generated is about 1-2% steel billet refining capacity. Therefore, with the current steel billet refining capacity of 6 factories being 4.715 million tons of products/year, the volume of furnace dust generated is about 47,150-94,300 tons per year. This shows that dust is the main source of pollution. In addition, due to difficulties in the site clearance process, industrial parks do not have protection corridors, ensuring enough safe distance from residential areas, so air pollution from steel factories is a pressing issue that the government is facing. The locality does not have sufficient scientific basis to take measures to completely resolve this situation.
Results of Exhaust Gas Emissions from Steel Factories
Currently, the fuels commonly used in steel plants are coal and CNG (used for the EAF and the LF). Emission calculation results show that the main emissions come from the use of coal, accounting for a high proportion of SO2 and NOx emissions as shown in Table 1.
Simulation Results of Air Quality Using the TAPM-AERMOD Model System
Meteorological Simulation Using the TAPM Model
To verify the TAPM meteorological model, surface temperature and wind speed are selected. The verified results show that the simulated temperature and wind speed values through the TAPM meteorological model are close to the observed values with an R2 coefficient of 0.78. The results of verifying the simulated TAPM model for the Phu My town area, show that the simulation results can be used as input data for the AERMOD model.
Table 1.
Emission load from point sources (smelter + kiln).
Simulate Air Quality Using the AERMOD Model
Air quality simulation results from the AERMOD are calibrated and verified with periodic monitoring data of Phu My 2 industrial park at the location: Outside Phu My 2 industrial park (X = 1171080, Y = 423817). Calculation results of the simulation error between the simulated value and the observed value (ranging from -14% to -8%). This error is within ±15%. Therefore, the AERMOD model is capable of simulating pollution dispersion for this study.
Assess the Current Status of Air Pollution from NM1 to the Surrounding Area
In the Current Situation (Exhaust Gas Treatment Systems Operate Stably)
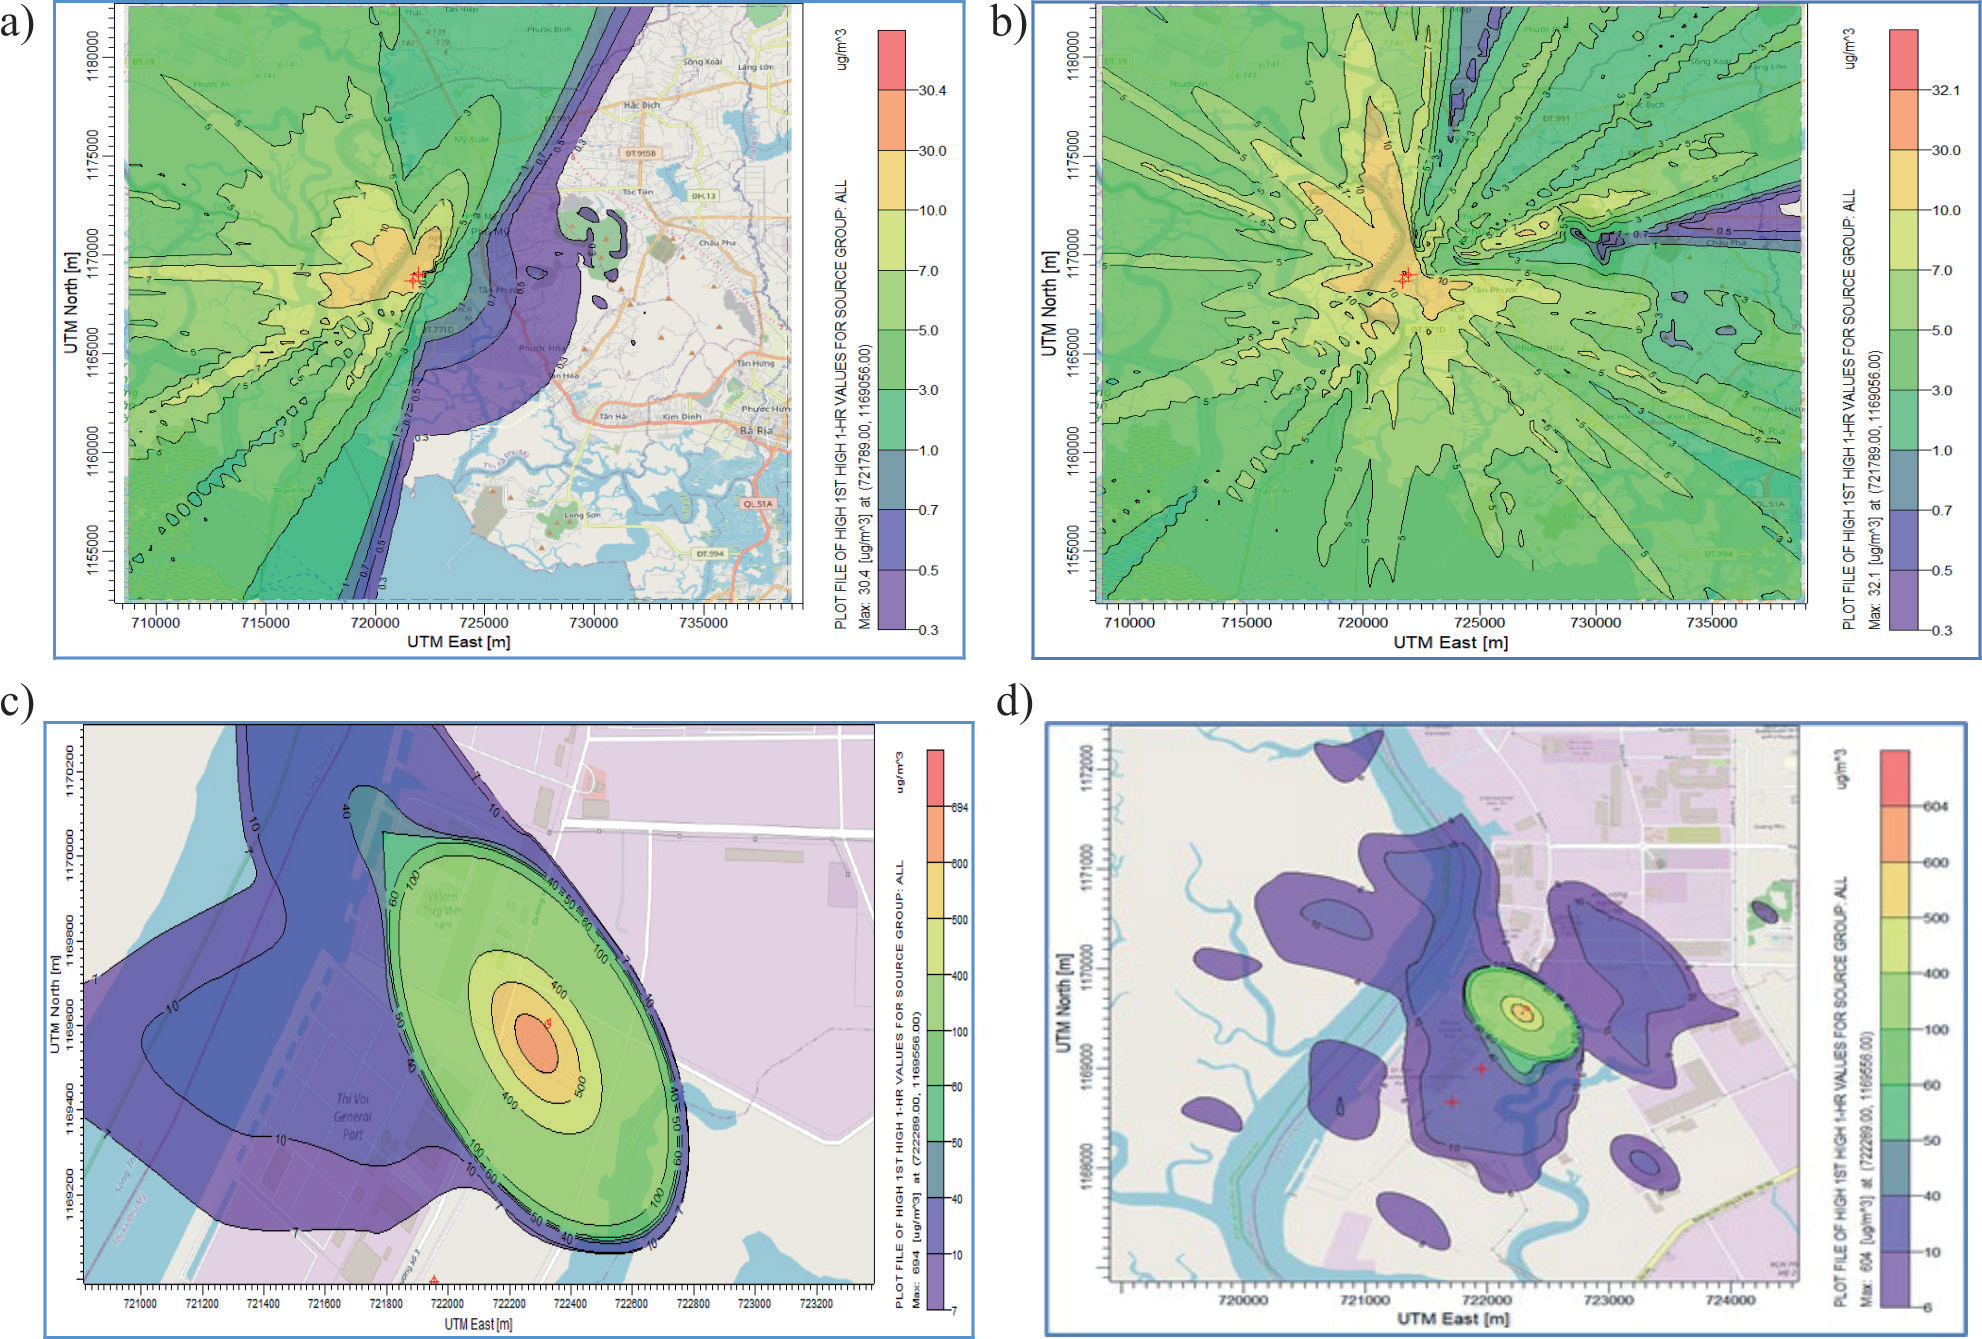
The simulated gas emissions are illustrated in Fig. 2.
NO2: The highest 1-hour average NO2 concentration (30.4 µg/m3 in the dry season and 32.1 µg/m3 in the rainy season) and the highest 24-hour average (5.73 µg/m3 in the dry season and 5.52 µg/m3 in the rainy season) both meet QCVN 05:2023/BTNMT (200 µg/m3 and 100 µg/m3, respectively).
SO2: The highest 1-hour average SO2 concentration (19.5 µg/m3 in the dry season and 17.3 µg/m3 in the rainy season), and the highest 24-hour average (3.01 µg/m3 in the dry season and 2.25 µg/m3 in the rainy season) all meet QCVN 05:2023/BTNMT (350 µg/m3 and 125 µg/m3, respectively).
CO: The highest 1-hour average CO concentration (13.3 µg/m3 in the dry season and 14.0 µg/m3 in the rainy season) and the highest 8-hour average (5.38 µg/m3 in the dry season and 4.71 µg/m3 in the rainy season) are both lower than QCVN 05:2023/BTNMT (30,000 µg/m3 and 10,000 µg/m3, respectively).
TSP: The highest 1-hour average TSP concentration is 694 µg/m3 (in the dry season) and 604 µg/m3 (in the rainy season), 2.3 times and 2.0 times higher than QCVN 05:2023/BTNMT (300 µg/m3), and the highest 24-hour average concentration is 33.2 µg/m3 (in the dry season) and 32.7 µg/m3 (in the rainy season), reaching QCVN 05:2023/BTNMT (200 µg/m3). The areas recording the highest 1-hour and 24-hour average concentrations of TSP were both within the plant area. In surrounding areas (within a radius of 1-2 km from the center of the factory), the 1-hour average concentration of TSP ranges from 400-600 µg/m3, exceeding QCVN 05:2023/BTNMT by 1.3-2.0 times. This shows that emissions from area sources (from production) have the impact of causing local TSP pollution in the factory and surrounding areas.
PM10: The highest 24-hour average PM10 concentration in the dry season is 19.6 µg/m3 and in the rainy season is 19.3 µg/m3, both reaching QCVN 05:2023/BTNMT (150 µg/m3).
PM2.5: The highest 24-hour average PM2.5 concentration in the dry season is 15.2 µg/m3 and in the rainy season is 15.0 µg/m3, both reach QCVN 05:2023/ BTNMT (50 µg/m3).
The simulation results have been calculated based on the background concentrations of air pollutants in the study area (using air quality monitoring data at the automatic air quality monitoring station, Toc Tien centralized waste treatment area, Phu My town, BRVT province).
Comparison with research conducted in Iran (Table 2) indicates that the concentrations of air pollutants in our study generally exceed those reported in other studies, albeit still within permissible limits. Notably, the TSP concentration in our study substantially exceeds that observed in previous research, suggesting that emissions from area sources, particularly those associated with production processes–especially the utilization of scrap steel–exert a significant influence, leading to localized TSP pollution within the factory and its surrounding areas.
In the Case of an Incident Scenario
In this study, an incident scenario is selected when the exhaust gas treatment systems do not reach their current treatment capacity. The proposed treatment efficiency is reduced by 50% compared to the current treatment efficiency. Simulation results of air quality in the NM1 area in the event of an incident show that the highest 1-hour average and the highest 24-hour average concentrations of PM10, PM2.5, SO2, NO2, and CO reached QCVN 05:2023/BTNMT in both seasons. Meanwhile, the highest 1-hour average concentration of TSP exceeds QCVN 05:2023/BTNMT, higher than 2.3 times (in the dry season) and 2.0 times (in the rainy season) at some times of the year. The 24-hour average concentration of TSP still reached QCVN 05:2023/ BTNMT. The areas with air pollutant concentrations exceeding standards are within the factory‘s boundaries. It can be considered that activities generating pollutants from area sources have an impact on surrounding air quality because they have not been thoroughly controlled.
Calculate the Air Environmental Safety Distance for the Surrounding Area
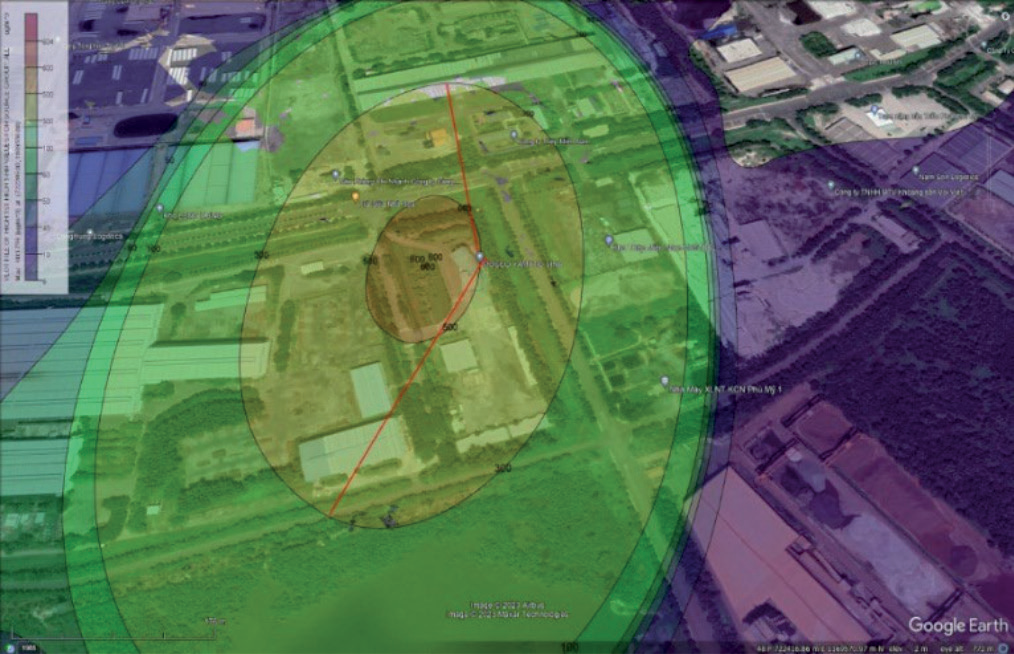
Simulation results of the dispersion of air pollutants PM10, PM2.5, NO2, SO2, and CO (1-hour average, 24-hour average, and 8-hour average) respectively show results reached to QCVN 05:2023/BTNMT at different distances from the factory, only the TSP exceeds to QCVN 05:2023/BTNMT (Fig. 3.). Based on these simulation results, the safe distance for sensitive objects, such as surrounding residential areas, is determined to be the furthest distance from the edge of the factory to the boundary between the exceeding and permitted standards in QCVN 05:2023/BTNMT. Determining such a hygienic distance is reasonable so that the activities of sensitive objects are within the range guaranteed in terms of health protection when exposed to concentrations of pollution indicators below the acceptable threshold according to QCVN 05:2023/ BTNMT.
Within the scope of this study, the principle of building environmental safety distance standards must be based on specific statistical distances, as shown in Table 3. Thus, the appropriate environmental safety distance for steel plants is determined. determined to be a minimum of 500 m in all directions.
Propose Measures to Reduce Air Pollution from Steel Factories
The current management of the air environment around steel factories faces many difficulties, especially in the inspection and handling of violations of air pollution issues by businesses. To overcome those difficulties, the following solutions are needed:
(i) It is necessary to agree on the issuance of safety corridors around industrial parks with heavy industrial activities such as steel production for management; (ii) Improve efficiency in environmental management by unifying the focal point for checking and inspecting environmental protection work to avoid overlap; (iii) Apply information technology and 4.0 technology in environmental management and build an information connection network between departments and agencies such as the Industrial Park Management Board, Infrastructure Development Company, and other agencies; (iv) Strengthen the inspection and examination of environmental protection work at companies and businesses, especially those in the group of businesses with a high risk of causing environmental pollution, such as steel production; (v) Require steel factories to maintain the operation of automatic gas monitoring stations and send results directly to the management unit so that they can directly monitor exhaust gas quality; (vi) Through simulation results, it is found that the TSP dust content generated at NM1 exceeds QCVN 05:2023/ BTNMT. In addition to dust generated from smelters that have gone through the kilns and discharged through chimneys, part of the dust comes from sources such as loading and unloading and screening scrap to remove impurities. Therefore, to limit the amount of dust generated, steel factories need to limit the loading and unloading of scrap and screening of scrap during strong winds, and at the same time do it in closed warehouses to avoid the influence of wind that can spread dust into the environment; (vii) Mobilize companies and factories to conduct emissions audits, promote cleaner production, and improve new treatment technology to reduce air pollutants. Recommend businesses to use clean energy and limit the use of fossil fuels; (viii) There must be strict penalties for businesses that do not ensure full compliance with environmental protection; (ix) Strengthen supervision and inspection of the operation process of enterprises to ensure that enterprises perform well at exhaust gas treatment facilities; (x) In addition, managing units need to regularly propagate and organize training sessions on environmental law or environmental protection at enterprises to raise the sense of responsibility of enterprises towards environmental protection. environment in production activities.
Table 2.
Comparison of average air pollutant concentrations between this steel plant and other studies.
Table 3.
TSP concentration and environmental safety distance are suitable for NM1 (µg/m3).
Conclusions
The study evaluated the current status of air environment management at steel factories in Phu My town. In addition, the actual survey also shows that air pollution from scrap storage and unloading activities in some factories also contributes to local air pollution in the factory area and around the area. The air quality simulation results at NM1 show that the highest 1-hour average and 24-hour average concentrations of PM10, PM2.5, SO2, NO2, and CO reach QCVN 05:2023/BTNMT in both seasons. Meanwhile, the highest 1-hour average concentration of TSP exceeds QCVN 05:2023/BTNMT, higher than 2.3 times (in the dry season) and 2.0 times (in the rainy season). Areas with pollutant concentrations exceeding standards are within the factory‘s boundaries. The study also performed simulations in case incident scenarios. In addition, based on the simulation results, the study also calculated the environmental safety distance for the area surrounding the factory. From research results, the proposed solutions aim to improve air quality in the area and ensure the health of people living around active steel and steel manufacturing plants, ensuring harmony in production activities and the safety of the living environment of people in neighboring areas. However, in reality, manufacturing plants cannot be completely separated in industrial parks, so the problem of air pollution is very difficult to completely separate which factory the surrounding air pollution comes from. Therefore, it is necessary to expand research into clusters of factories to improve and have more accurate and comprehensive assessment results.

