

Introduction
At the 75th United Nations General Assembly, the Chinese government declared its intention to attain carbon neutrality by 2060 and carbon peaking by 2030. In pursuit of this objective, the investigation and evaluation of carbon sequestration mechanisms in terrestrial ecosystems have emerged as the most pressing issues [1]. The utility of carbon storage within ecosystems was identified as a significant ecosystem service by the United Nations Millennium Ecosystem Assessment report [2–4]. Land use and land cover changes (LULCC) are among the most significant determinants of terrestrial ecosystem carbon storage. By altering the carbon stocks of vegetation and soil, land use change influences the spatial distribution of carbon storage and carbon stock in regional ecosystems; consequently, this impacts the ecosystems’ structure, function, and carbon cycle [5, 6]. In light of the Chinese government’s endeavors to attain carbon neutrality and carbon peaking, investigating the mechanism by which LULCC reacts to the spatial distribution of carbon stocks in basin ecosystems is crucial.
Land use multi-scenario modeling is a highly effective approach to investigating how policies affect ecosystem services [7, 8]. Land use multi-scenario simulations can be used to detect LULCC at a certain scale by employing multi-scale geospatial data. This is particularly evident in the case of changes brought about by regional-scale human activities (such as settlement expansion, afforestation, and crop expansion) and regional policies (including environmental and economic development policies) [9–12]. Due to the fact that LUCC is influenced by both natural and anthropogenic factors, its mechanism and formation processes are intricate. Academic research has primarily concentrated on the primary mechanisms of land use change, land use classification, and land use change simulation in order to more accurately assess and simulate LULCC. The research models utilized to this end include the CA model, the SD model, the CLUE-S model, the FLUS model, and the PLUS model, among others [13–18]. Barredo et al. [19] simulated variations in urban land use expansion in Dublin over the next three decades using a CA model. Scholars have made improvements to the conventional CA model in response to its inadequate simulation accuracy and failure to incorporate the fundamental logic of the driving mechanisms of land use change [20]. The SD model was developed by scholars affiliated with the Massachusetts Institute of Technology (MIT). It aims to illustrate the interplay between land use change elements that are dynamic, nonlinear, and systematic [21]. Based on system theory, Verburg et al. [22] developed the CLUE-S model, which can more accurately simulate land use change at the regional scale. By incorporating an adaptive inertia mechanism and neural network (ANN) into the CA metacellular machine, the Future Land-Use Simulation (FLUS) model [20] is capable of efficiently resolving the competitive relationship among the primary land use categories.
The Patch-Generating Land Use Simulation (PLUS) model, introduced by Liang et al. [20], is a cellular automata (CA) model based on raster data. Its purpose is to analyze the non-linear relationships that underlie the expansion factors of various land classes, simulate the landscape at the patch level, and investigate the driving factors of land class expansion. A Markov chain built into the PLUS model enables the precise forecasting of the expansion rates of various land classifications [20]. In this paper, land use changes in the Lhasa River Basin in Tibet over the next two decades are simulated using the PLUS model, and the regional LULCC pattern under various development modes is investigated.
Current LULCC methods for assessing the carbon stock of ecosystems fall primarily into four categories: field surveys, empirical statistical models, remote sensing models for net primary production (NPP), and ecosystem simulation models [23-25]. Field surveys are appropriate for estimating carbon stocks at small to medium scales; however, they are not capable of capturing the spatial patterns and long-term dynamics of carbon stock changes in ecosystems [26]. Due to the constraints imposed by the computational mechanisms and architecture of ecosystem statistical models, investigations into regional carbon stocks in ecosystems vary considerably [27, 28]. Sharp et al. demonstrated that the Integrated Valuation of Ecosystem Services and Trade-offs (IVEST) model is inadequate for approximating carbon stocks in small- and medium-scale ecosystems. Furthermore, the study fails to account for the spatial patterns and dynamic changes in carbon stocks over extended time periods [29]. InVEST is a suitable model for undertaking a visual appraisal of the functional value of ecosystem services across various scales. It is especially well-suited to examining how changes in land use affect watersheds and the spatial distribution of carbon stocks in ecosystems.
The Lhasa River basin, situated in the central hinterland of the Tibet Autonomous Region (TAR), holds significant agricultural and livestock production value for the TAR. Lhasa, the most populous central city of the TAR, is situated within the basin and comprises 21.3% of its area, while the basin comprises 3.02% of the region’s total area. Due to accelerated socioeconomic development and increased anthropogenic disturbances over the past two decades, the basin has been subjected to numerous ecological issues, including soil erosion, grassland degradation, and so forth, which have resulted in a decline in the value of ecosystem services and functions [30]. Upon reflection, the majority of pertinent research conducted in the Lhasa River Basin has centered on the natural ecological milieu. This study simulated the spatial pattern of ecosystem carbon stocks and the mechanisms by which they respond to land use change in the Lhasa River Basin under a future multi-scenario development mode using the PLUS and InVEST models.
Materials and Methods
A Summary of the Survey Region
The Lhasa River Basin is a first-class tributary of the Yarlung Tsangpo River and is located in the central hinterland of the Tibet Autonomous Region (90°05′– 90°20′ E, 29°20′–31°15′ N). The Lhasa River flows through Nagqu City’s Gyali County, Lhasa City’s Lhunzhub County, Maizhokunggar County, Dazi District, Chengguan District, and Quxu County, as well as 10 additional districts and counties (Fig. 1). The terrain in the Lhasa River basin has a high degree of undulation (7074– 3568 m), with an average elevation of 4300 m; the basin belongs to a typical plateau temperate semi-arid climate zone, with an average annual temperature of −7–9.2 °C and an average precipitation of 340–700 mm, mostly concentrated in the rainfall area. The average evaporation for many years has been 1500–2200 mm; the vegetation is mainly alpine meadows and alpine grassland, the soil types are meadow soil and grass felt soil, and the soil’s organic matter content is higher.
As the principal portion of the Qinghai-Tibet Plateau, the majority of the Tibet Autonomous Region is underdeveloped, with protective development serving as the primary focus and a lack of capacity and ability for independent development. Other characteristics of the region include high altitude, a harsh climate, a sparse population, arid and low rainfall, infertile soil, and a lack of natural geographic conditions for large-scale development. The Lhasa River basin is situated in the Tibet Autonomous Region’s central hinterland. It encompasses the middle and lower reaches of the basin valley on both sides of the terrace development and is considered a typical wide valley river section. The land is relatively broad and flat, with a high soil organic matter content and a mild climate. The basin is highly populated and economically developed, with a high density of towns and citIes, a high road network density, and the Tibet Autonomous Region serving as an important area for agricultural and animal husbandry production. The greatest central city of the Tibet Autonomous Region is Lhasa, which is located in the basin. Although the basin area only makes up 3.02% of the region’s total territory, its population makes up 21.3% of the region’s total population. The basin has seen significant development over the last 20 years, and the Tibet Autonomous Region now relies heavily on it as its economic center. However, the basin is experiencing a number of ecological and environmental issues brought on by the reverse evolution of grassland, the worsening of soil erosion, and the decline in resource and environmental carrying capacity. These issues have resulted from the rapid economic development of the basin and the intensification of anthropogenic activities. In hindsight, the majority of relevant research in the Lhasa River Basin is concerned with studying the natural ecological environment. In order to provide helpful guidance and support for the sustainable development of the high intensity development region of the plateau, this study used the PLUS model and the InVEST model to simulate the spatial pattern of ecosystem carbon stock and its land use change response mechanism in the Lhasa River Basin under the future multi-scenario development mode [30].
Data Capturing
The study identified 14 factors, including natural geographic factors (desiccation, elevation, distance from the river, precipitation, etc.) and human environment factors (population, night lighting, GDP, etc.), as the drivers of land use change in the Tibetan Plateau. Temperature, ecological functional zoning, and elevation were selected as limiting factors in relation to the natural geography of watershed development and regional development policies. LULCC is a complex, dynamic change process that is driven by both the natural environment and anthropogenic effects. This study has identified a complex, dynamic process of change that is driven by both the natural environment and anthropogenic effects (Table 1).
(1) Nine periods of land use data, at a 30 m resolution, were taken from the Resource and Environmental Science Data Centre of the Chinese Academy of Sciences (https://www.resdc.cn, access date: 2023) and used as LULC datasets for the region in question. To assess the accuracy of the data, they were supplemented with visual interpretation, field surveys, and confusion matrix judgments. Ultimately, the watershed’s total categorization accuracy exceeded 90%. According to the primary and secondary classification standards of land use in the People’s Republic of China, combined with the land cover status of the watershed, the watershed region was classified into seven categories: cropland, shrub, waters, grassland, forest, constructed, and bare land. (2) Digital elevation data were obtained from the Geospatial Data Cloud Platform (https://www.gscloud.cn, access date: 16 May 2023; https://www.tpdc.ac.cn, access date: 16 May 2023), and slope extraction was completed on the basis of the DEM data, with a spatial resolution of 30 m. (3) Precipitation, dryness, and average annual temperature data were obtained from the Meteorological Bureau of the Tibet Autonomous Region, with a spatial resolution of 30 m, and the soil and soil erosion data were obtained from the National Tibetan Plateau Science Data Centre (https:// www.tpdc.ac.cn, access date: 16 May 2023); soil and soil erosion data were obtained from the National Tibetan Plateau Science Data Centre (https://www.tpdc.ac.cn), with a spatial resolution of 30 m. The Chinese Academy of Sciences Resource and Environmental Science Data Centre (https://www.resdc.cn, accessed 16 May 2023) provided four sets of socioeconomic data, primarily focusing on the spatial distribution of GDP and population; Open Street Map (https://www.openstreetmap.org) provided vector data useful for calculating the distances to roads; the National Geographic Information Resource Service (https://www.webmap.cn) provided vector data for watershed streams; the World Food Organization’s FAO’s Livestock Density Dataset (https:///data.apps.fao. org/) used grazing data, and the National Tibetan Plateau Science Data Centre (https://www.tpdc.ac.cn) provided night lighting data. (5) A database of the carbon density of the soil and vegetation in the watershed was created by combining pertinent experimental data with data on the carbon density of the terrestrial ecosystems found in scholarly publications published between 2000 and 2022. Furthermore, a uniform spatial resolution of 30 m was applied for raster data resampling.
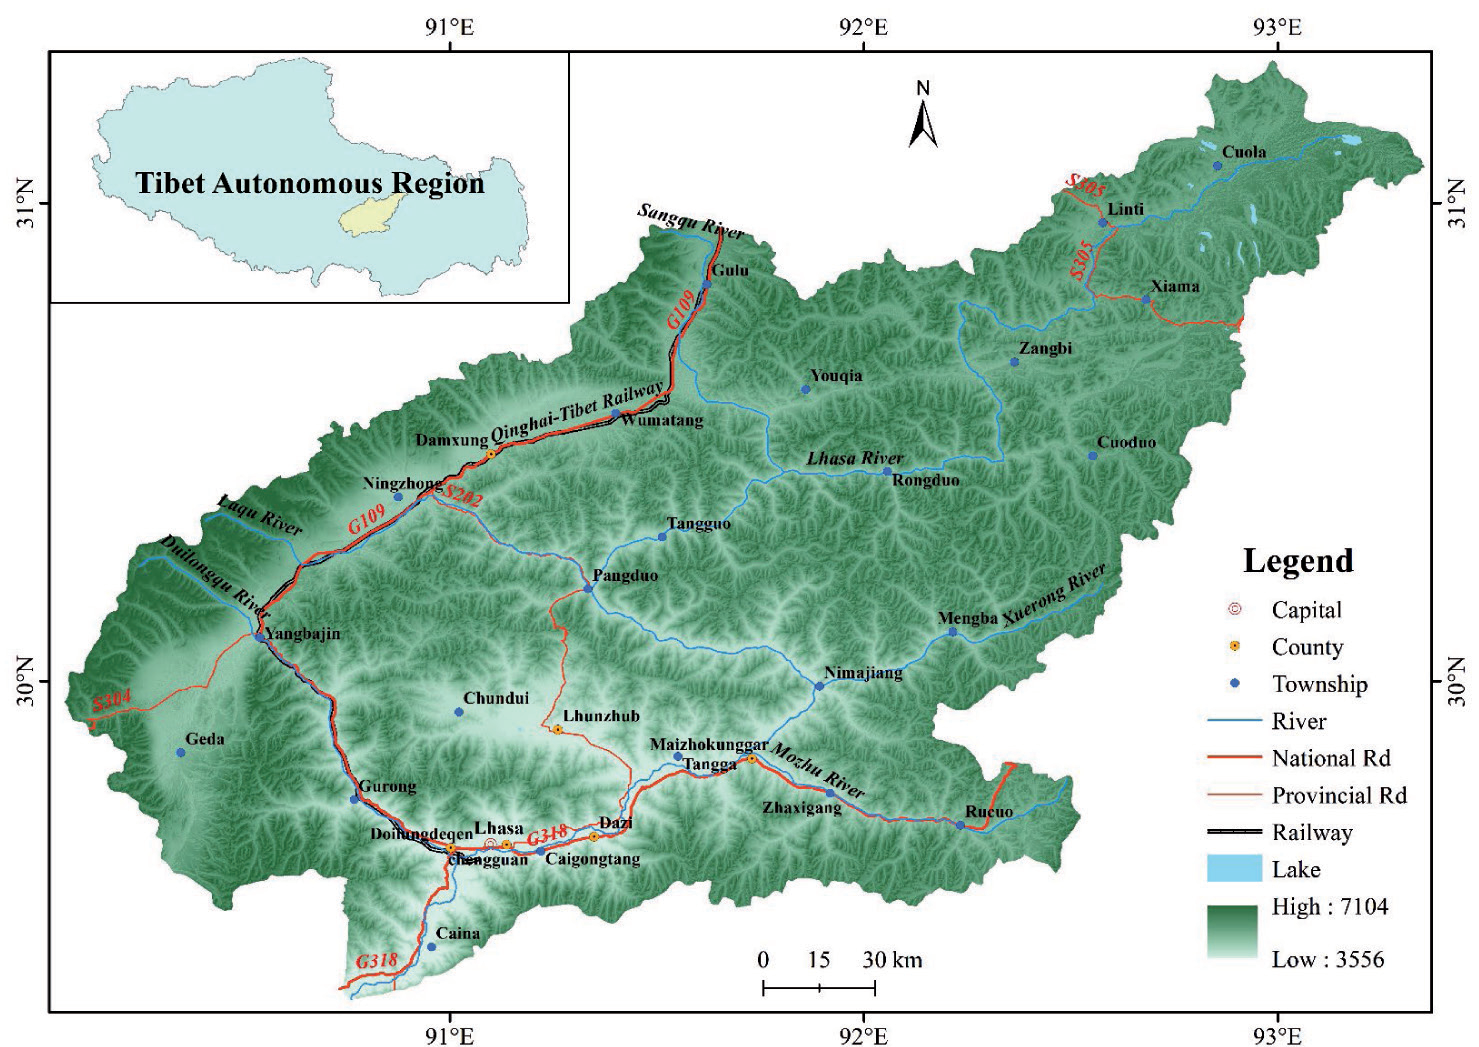
Table 1.
Sources of information and a description.
InVEST Model
The InVEST model, which is made up of multiple sub-modules and algorithms, is a tool used extensively in the estimation of ecosystem carbon stocks because it can quantitatively evaluate the value of ecosystem services. It can also simulate changes in ecosystem carbon storage under various LULCCs (Table 2). The four primary components of the carbon stock of terrestrial ecosystems are dead organic matter, soil organic carbon, aboveground biomass, and below-ground biomass [29]. To estimate the entire regional carbon stock, the InVEST model computes the average carbon densities of various land-use categories and LULCs. The carbon stock can be calculated using the following formula:
where
Data on land use in the study region and the associated carbon density value of each land use type are needed for the InVEST model to calculate carbon stock. The carbon density value of each land use type in the study area can be found in the literature [29]. In order to calculate the carbon density of land types, temperature and precipitation factors are used to correct the carbon density data of the local land use types. The carbon stock in the Lhasa River Basin is then obtained through inversion. Scholars believe that there is little variation in the carbon densities of land types in similar climatic zones. The following is the calculation formula:
Table 2.
Different land use types’ carbon densities in the Lhasa River Basin.
where
PLUS Models
Scholars have developed a large number of land use models to simulate land use change in the context of future development scenarios, with the goal of better assessing and simulating regional land use changes. However, most of these models are linear simulations that do not adequately reflect the evolution of patch landscapes and do not adequately simulate changes in the underlying nonlinear relationships of LUCC [20]. In order to better represent the complex land use–land change system and achieve higher simulation accuracy with more similar landscapes, the PLUS model employs land use expansion rule deep mining and the multi-CA model, using the stochastic seeding mechanism of the types of scenarios. This model can excavate the deep driving factors of land expansion and landscape change, and LEAS can be used to analyze the potential land use conversion rules.
As was previously stated, 14 LULCC driving factors were chosen for use in this work to simulate future changes in the watershed’s land use and serve as a guide for future planning [50–54].
The PLUS model simulates patch evolution under various land use types using a multi-objective stochastic patch seeding technique based on threshold reduction.
where
Setting the Scenario and Site Needs
Scenario Setting
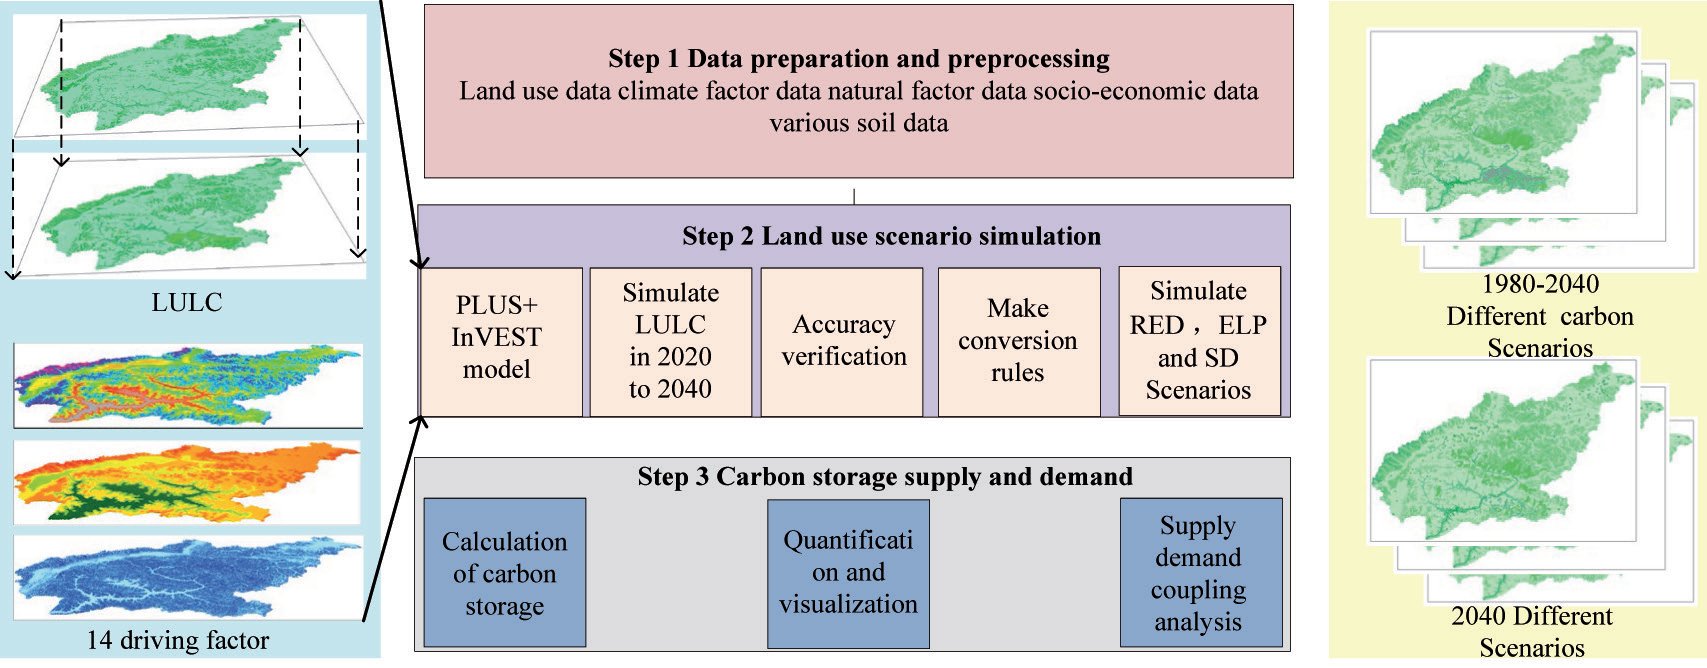
This study involved three steps. First, the conversion rule of LULCC in the study area was established, and nine periods of LULC data with a 30 m resolution (1980, 1990, 1995, 2000, 2005, 2010, 2015, 2018, and 2020) as well as data on the causes affecting land use change in the study region were prepared. Second, we simulated three distinct development scenarios for the study area and maximized the study area’s LULC regional space using the PLUS model and Markov chain. Third, we investigated how the ecosystem of the Lhasa River Basin responds to changes in land use and the geographic pattern of carbon stock under various scenarios (Fig. 2).
The Lhasa River Basin, located in the Tibet Autonomous Region (TAR), is a significant region for agricultural and animal husbandry production. Its economic development is vital for driving the overall economic growth of the TAR. Recognizing its importance, both the central government of China and the TAR government have designated it as a key area for investment and development. Consequently, substantial investments in capital and technology have been made in the basin, resulting in a strong impetus for its development. We analyze the land use pattern that aligns with the current regional economic development and predict the land demand that aligns with future economic development. We propose a business as usual (BAU) land use change scenario that prioritizes regional economic development and pays less attention to the impact of reduced ecological carrying capacity on the regional ecological environment. Over the past two decades, the Lhasa River has emerged as a significant area in the Tibet Autonomous Region (TAR) due to extensive development. Following two decades of extensive development, the Lhasa River has emerged as a significant economic hub in the Tibet Autonomous Region (TAR). Despite the fact that the watershed area only constitutes 3.02% of the TAR’s total area, it is home to 21.3% of the region’s population. Additionally, the Lhasa River Basin is experiencing a substantial influx of migrants from other areas within the TAR. Given the population size, food security concerns, and the government’s policy stance, we suggest implementing a land use change scenario called cropland protection (CLP). This scenario is based on a land-use model that aligns with the existing cropland in the region. It prioritizes expanding cropland to meet the needs of the growing population and economic development of the basin, with less emphasis on ecological protection. The Tibet Autonomous Region (TAR) is a vital green ecological barrier in China and Central Asia, serving as the primary section of the Qinghai-Tibetan Plateau and the source of numerous major rivers in the region. It plays a critical role in preserving the ecological security of both China and Central Asia. The Lhasa River Basin, located in the Tibet Autonomous Region (TAR), serves as a crucial ecological barrier area. The ecological state of this region significantly influences the overall ecological environment of the TAR. In light of the Chinese government’s present objective to achieve carbon peaking and carbon neutrality, we suggest implementing an ecological land protection (ELP) land use change scenario. This scenario prioritizes the improvement of the ecological quality of the basin. We present an ELP land use alteration scenario that aligns with the Chinese government’s existing objectives for achieving carbon peaking and carbon neutrality. The following are the scenario designs’ goals and guiding principles:
1. The BAU scenario presupposes that land use will largely follow historical patterns and that there will not be any notable changes in the future. The probability of changes in the watershed’s Markov chain of land use from 2010 to 2020 is used to calculate land demand for the BAU scenario in 2030, and the probability of change in the watershed’s Markov chain of land use from 2030 to 2040 is used to calculate the BAU scenario in 2040 [55, 56];
2. The CLP scenario is based on the basic farmland protection regulations in the TAR and findings from a questionnaire distributed in the region on the minimum and maximum stocks of grain in various municipalities. These documents demonstrate the TAR governments and various municipalities’ strict commitments to farmland protection. This scenario presupposes the strict protection of farmland; promotes the allocation of some constructed land, some forest land, some grassland, and some waters for conservation; and returns all farmland that has previously been converted to other uses to a state of conservation, thus reversing the 60% conversion probability rate [57];
3. The ELP scenario is based on the greening of the TAR’s north and south mountains, a project to turn farmland back into forests, the 14th Five-Year Plan for Ecological Environmental Protection set out by the TAR government, and the ecological environmental protection plans of Tibetan cities and counties. These initiatives demonstrate the increased commitment of the TAR government and local governments to ecological environmental protection. This scenario is based on the supposition that the government strictly limits the growth of constructed land, promotes the return of farms to forests, grasslands, and lakes, and safeguards habitats such as forests and grasslands [58]. In this case, all farmland that slopes between 6° and 15° is turned into forest and scrubland, and all farmland that slopes more than 15° is turned into grassland. Furthermore, within the vicinity of 100 m from the water, a buffer zone has been established.
LULC Accuracy Validation
By comparing the actual LULC data of the watershed in 2020 with the LULC data for the same year under the BAU scenario in the watershed simulated by the PLUS model, the overall accuracy and Kappa coefficient were determined. The simulation accuracy increased as the values of overall accuracy and Kappa coefficient approached 1; if the simulation accuracy exceeded 0.8, the surface simulation effect was deemed adequate [20]. The Kappa value was 92.8% and the overall simulation accuracy was 97.4%, indicating that the simulation findings allowed a higher degree of confidence. This has been demonstrated by the cross-validation of the simulation data with the real land use data for each category in the Lhasa River Basin in Tibet in 2020.
Calibration of Quantitative Accuracy
Table 3 shows that, with the exception of the watershed, with an average simulation accuracy of 88.2%, every category in the Lhasa River Basin achieves very high simulation accuracy, averaging 97.4%. The remaining categories all have simulation accuracies of more than 90%. As a result, we can place a high degree of trust in the PLUS model’s ability to simulate the many kinds of changes that occur in the Lhasa River Basin. The Lhasa River Basin has more small mountain lakes and rivers as a result of the plateau’s topography and climate. These features will be replaced by other land categories during the land category conversion process, which will reduce the accuracy of the watershed land simulation process.
Accuracy of Spatial Matching
The land use data showed a higher spatial accuracy, with a Kappa value of 92.8%, indicating that the values simulated by the PLUS model had a high spatial accuracy and could better simulate the spatial changes in the watershed land [20]. This was determined by comparing the actual LULC data of the watershed in 2020 with the LULC data from the same year under the BAU scenario of the watershed simulated by the PLUS model.
Table 3.
Comparison of the 2020 Lhasa River Basin’s simulated and real land use grids.
Table 4.
LULC and its dynamic index (%) in the Lhasa River Basin for every scenario spanning from 2020 to 2030.
Results and Discussion
LULC Simulation in Several Situations
Using the PLUS model, the dynamics of land use change under the three development scenarios in the two periods of 2030 and 2040 were calculated, and the spatial distribution of land use in the Lhasa River Basin of the Tibet Autonomous Region under various scenarios was simulated (Table 4 and Table 5, and Fig. 3). Grassland and bare land, together making up 82.57% of the basin area, were determined to be the predominant land use types in the Tibetan Lhasa River basin. When subjected to the BAU scenario, the Lhasa River Basin will exhibit an overall declining trend of urbanization, while the watershed LULC under future development scenarios will display distinct development trends. The dynamic indices of the constructed areas for 2030 and 2040 are, respectively, −0.026593 and 0.013046. In other words, the growth in built land under the BAU scenario for the Lhasa River Basin will show a slow rate, while the natural environment shows an expanding trend. Constructed land in the Lhasa River Basin showed a decrease in scale under the CLP scenario; its dynamic indices for 2030 and 2040 were found to be −0.045171 and −0.014782, respectively. Under the CLP scenario, cropland clearly expanded, and its dynamic indices for 2030 and 2040 were found to be 0.020449 and 0.011836, respectively. Under the ELP scenario, the scale of constructed land continued to decrease, with the dynamic indices of the constructed land for 2030 and 2040 being −0.057994 and −0.038242, respectively, due to the afforestation of the north and south mountains of the Lhasa River Basin and the regional ecological and environmental policies. A relatively large increase in the area of forests, scrubs, watersheds, and grasslands was also seen.
Table 5.
For every scenario spanning from 2020 to 2040, the Lhasa River Basin’s LULC and its dynamic index (%).
Fig. 3.
Matrix of land use types transferred under various land use scenarios in the Lhasa River Basin at various times between 2020 and 2040. The land use transfer matrix for the 2020–2030 BAU scenario is shown in (a); the land use transfer matrix for the 2020–2030 CLP scenario is (b); the land use transfer matrix for the 2020–2030 ELP scenario is (c); the land use transfer matrix for the 2020–2030 BAU scenario is (d); the land use transfer matrix for the 2030 BAU to 2040 BAU scenario is (e); the land use transfer matrix for the 2030 BAU to 2040 CLP scenario is (f).
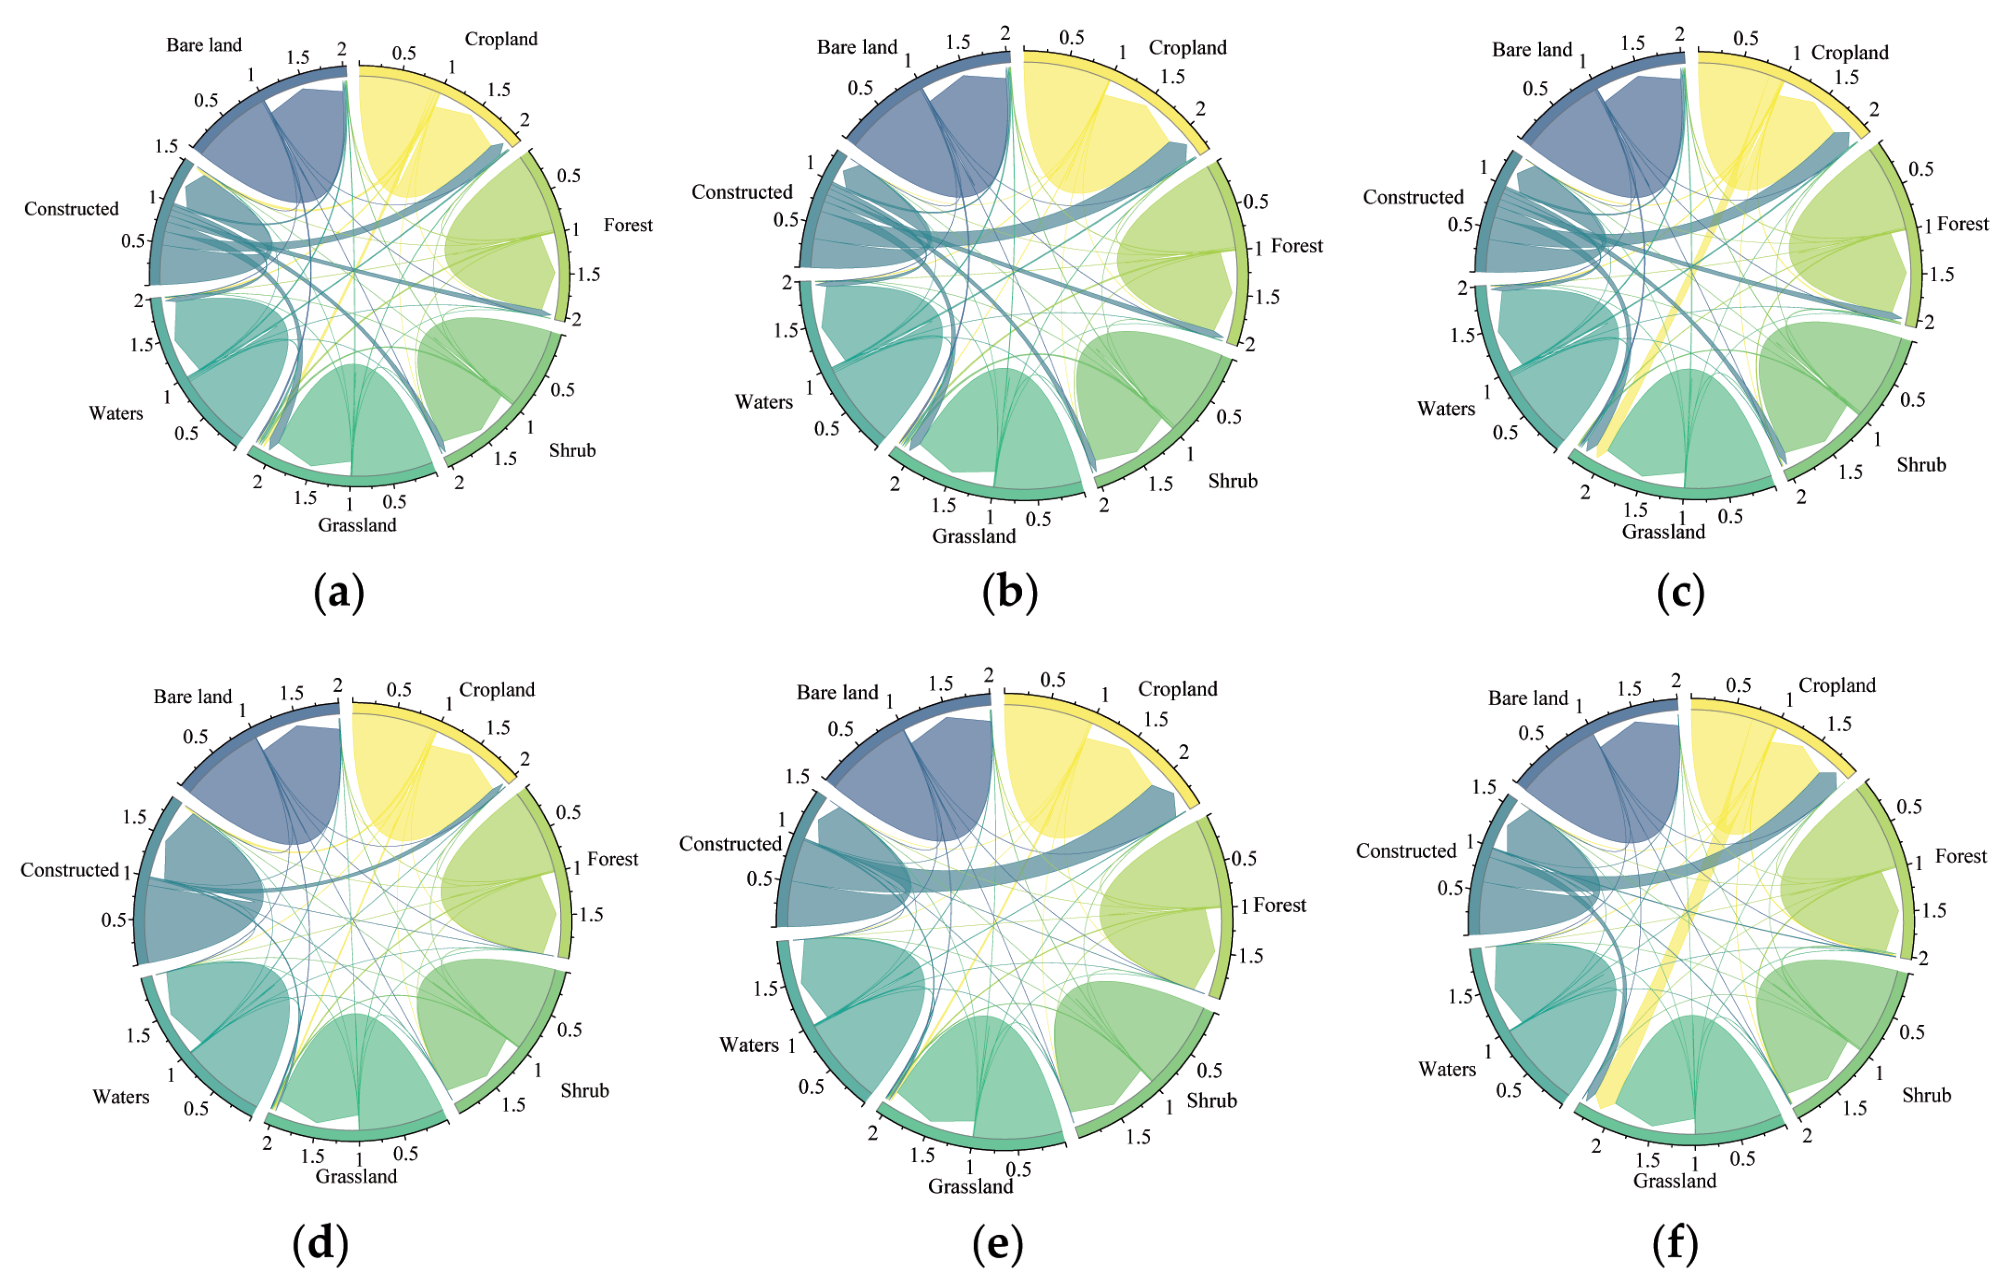
Fig. 4.
Variations in the ecosystem categories’ spatiotemporal patterns under each scenario between 2020 and 2040.
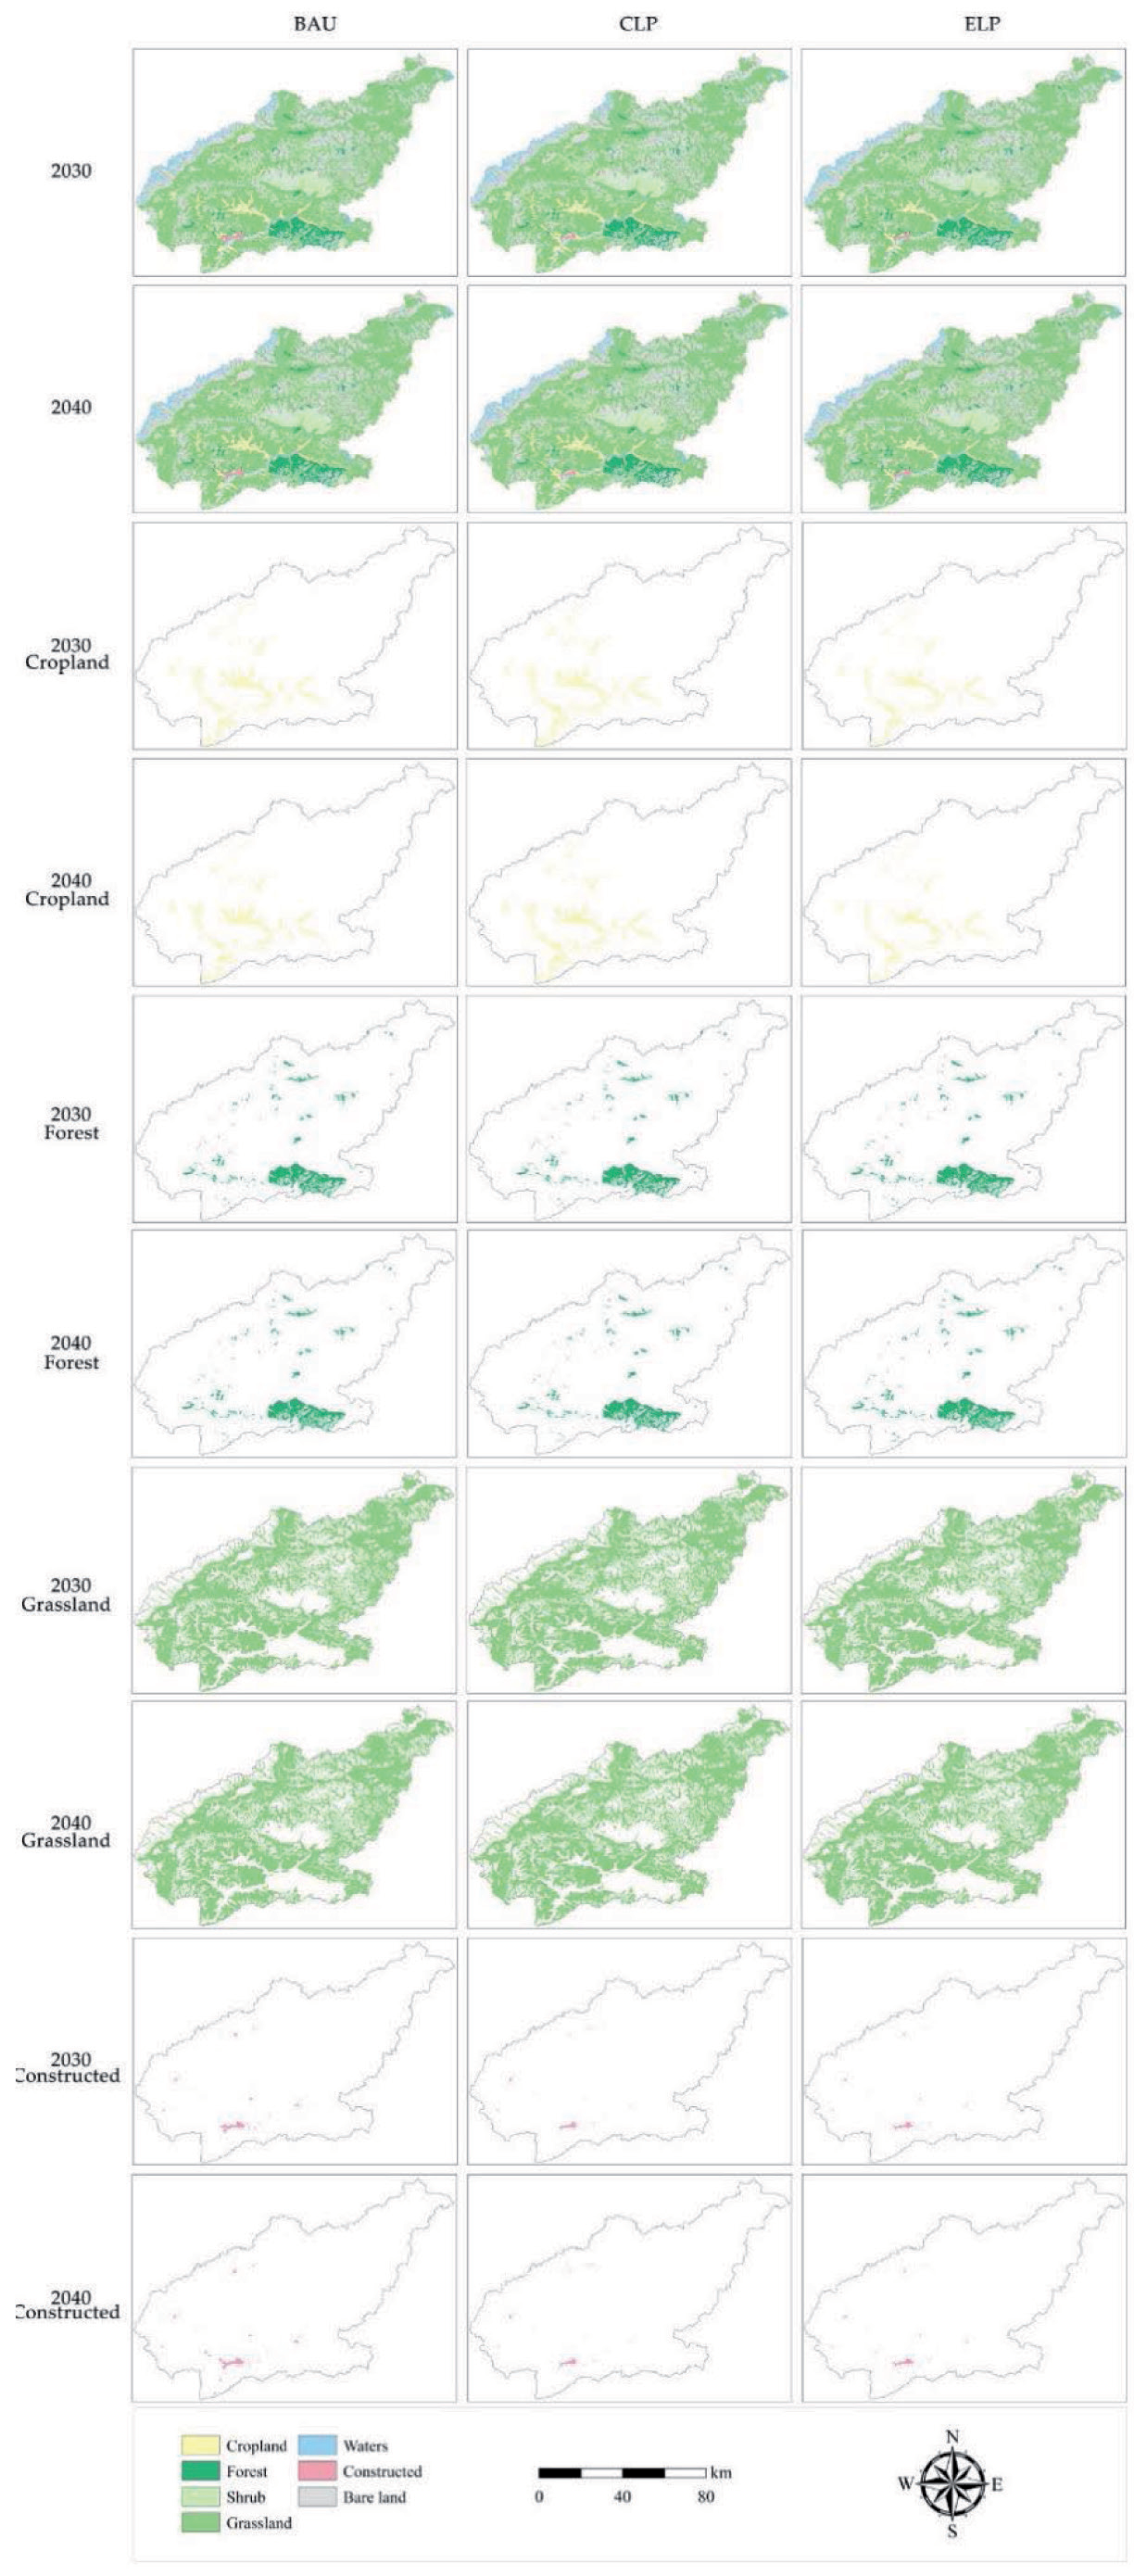
We counted and computed the areas of land use types under various scenarios in 2020–2040 in order to analyze the geographical and temporal variations in land use types in the Lhasa River Basin under the three scenarios. The distributions of grassland, constructed forests, and cropland spatial patterns in the Lhasa River Basin under the BAU, CLP, and ELP scenarios from 2020 to 2040 are depicted in Fig. 4. Under the BAU and CLP scenarios, the area of cropland in the Lhasa River Basin can be expected to grow significantly, by 132.2 km2 and 220.2 km2, respectively, in 2030. This increase will be mostly centered in the urban and rural areas located in the middle and lower reaches of the Lhasa River. The Lhasa River Basin’s forest area decreased to varying degrees under the BAU and CLP scenarios, by 19.8 km2 and 89.8 km2, respectively, mainly in the middle and lower reaches of the basin, which are more and less populated, respectively. Under the ELP scenario, the cropland area decreased by 92.4 km2, mainly in the middle and lower reaches of the basin, which may be due to large-scale afforestation encroaching on this land type. The Lhasa River Basin’s forest area decreased by 19.8 km2 and 89.8 km2, respectively, under the BAU and CLP scenarios. These decreases were mostly concentrated in the urban and rural agricultural areas in the middle and lower portions of the basin, where we see higher concentrations of people, and high-elevation sections can be seen in the basin’s northwest. Constructed land showed a notable contraction under each of the three scenarios, falling by 64.7 km2, 109.9 km2, and 141.1 km2, respectively, with the majority of this contraction occurring in the basin’s middle and lower reaches’ gently sloping areas.
Changes in the Carbon Stock in the Lhasa River Basin throughout Time and Space under Various Scenarios
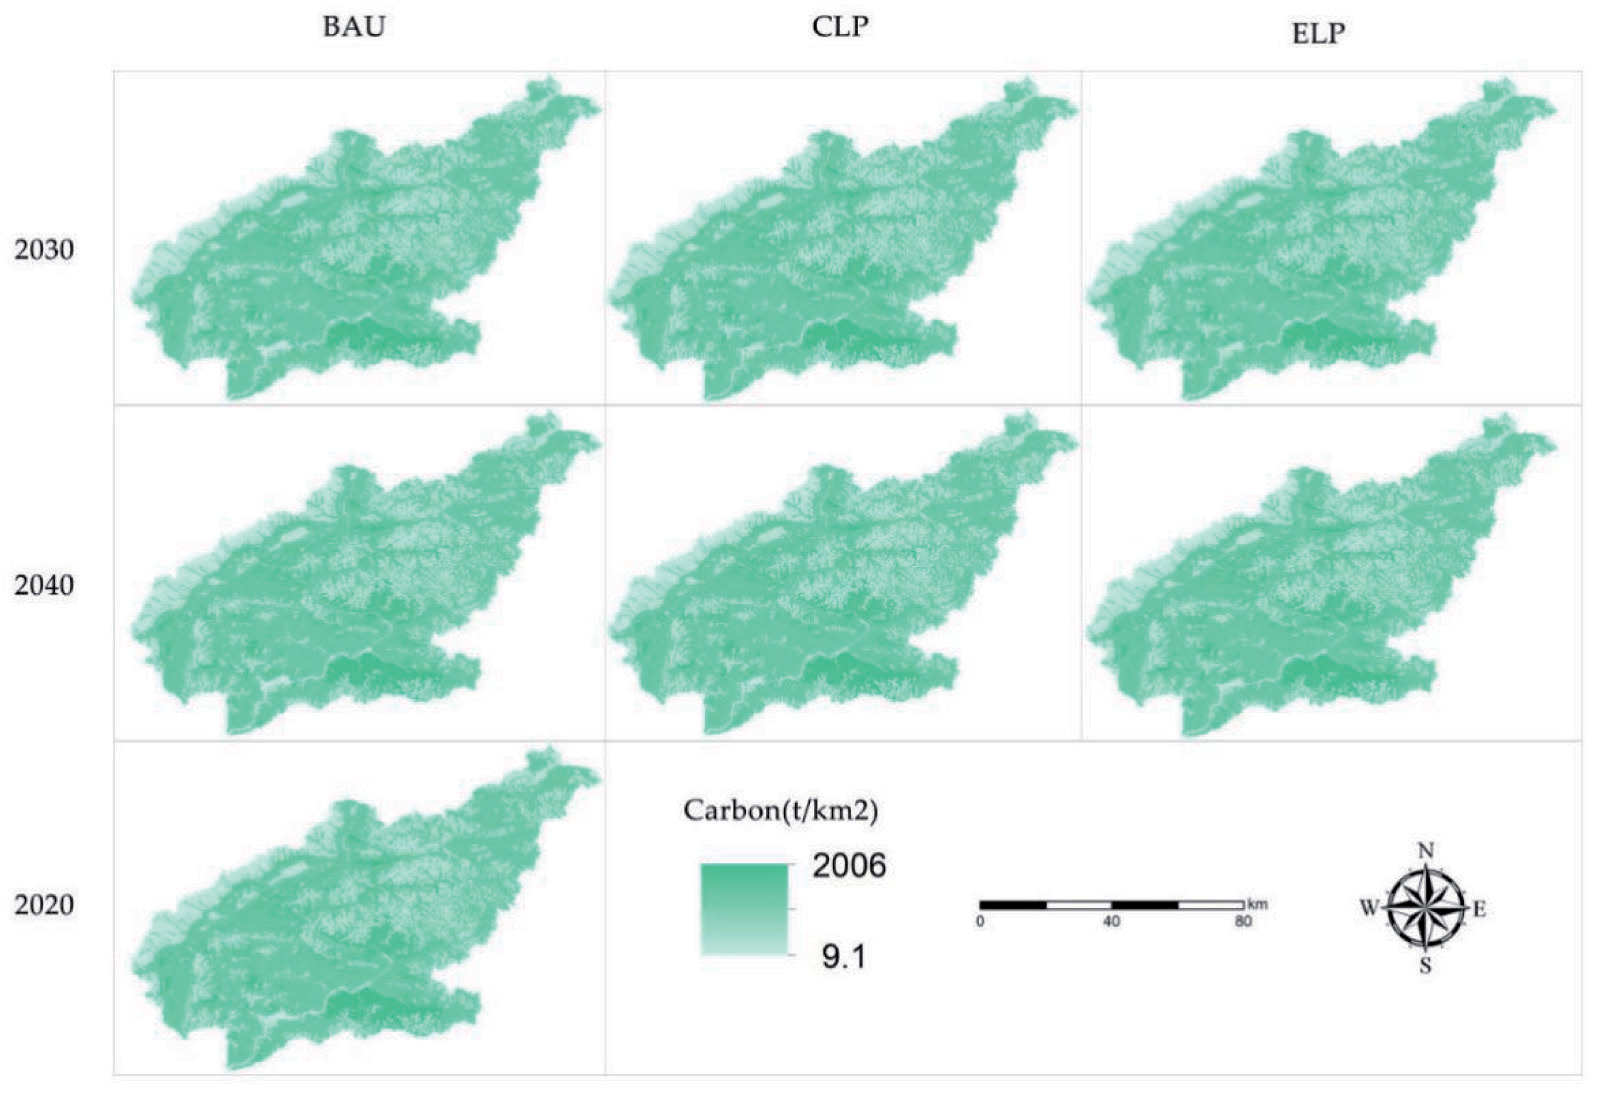
Data on the carbon pools of various land types and the geographical environmental parameters of the basin were used to calculate and assess the spatial carbon stock in the Lhasa River Basin via the InVEST model. In Fig. 5, the findings show that, under various development scenarios, there are clear geographical disparities in the carbon stocks of terrestrial ecosystems in the Lhasa River Basin. The Lhasa River Basin’s carbon stock increased by 72,957.8 Mg under the 2030 BAU scenario and by 110,696.4 Mg and 173,918.1 Mg under the 2030 CLP and ELP scenarios, respectively, compared to the 2030 BAU scenario. This increase could be attributed to the carbon stock in the terrestrial ecosystems rising under the conditions of strict ecological protection, afforestation, and large-scale farmland expansion. These increases in carbon stock within terrestrial ecosystems as a result of stringent ecological protection, tree plantations, and large-scale cropland expansion are closely linked to this. Under the 2040 BAU scenario, the spatial carbon stock in the Lhasa River Basin decreased by a significant amount, −84,730.3 Mg, when compared to the 2030 BAU scenario. In contrast, the CLP and ELP scenarios showed increases in the carbon stock in the Lhasa River Basin amounting to 47,025.5 Mg and 157,904.1 Mg, respectively, when compared to the 2030 BAU scenario, because of the substantial contraction in construction and the huge growth in grasslands and forests under the CLP and ELP scenarios, which increased the watershed’s total carbon supply. It is important to note that the Lhasa River Basin’s overall spatial carbon stock decreased significantly under the same development scenarios in 2040 and 2030. This decline was caused by an increase in constructed land and a decrease in terrestrial ecosystems, such as forests, grasslands, scrubs, and waters.
Discussion
Analysis of Potential Changes in Land Use under Various Scenarios
This study has proposed a land use prediction framework for future watershed sustainable development [59], which can effectively integrate regional sustainable development with global sustainable development and serve as a basis for decision-making in the context of regional sustainable development. The framework is based on the concept of watershed sustainable development from the perspective of ecosystem evolution. Furthermore, we have concentrated our research on terrestrial ecosystems because the United Nations Environment Programme (UNEP) views these as a crucial component of the global Sustainable Development Goals (SDGs). The importance of ecosystem services cannot be overstated in the context of local and national development planning, since they are crucial to the achievement of regional and global sustainable development [60, 61].
We used the PLUS model to simulate the LULCs in the Lhasa River Basin in 2030 and 2040 in order to verify the model’s accuracy in predicting the LULC in the region. The model’s high accuracy in simulating the LULC in the Lhasa River Basin is indicated by its kappa value of 0.928 and overall simulation accuracy of 0.974. Furthermore, in order to simulate the spatial pattern of land use in the Lhasa River Basin in 2030–2040, we set up three development scenarios based on the basin’s development policy, current conditions, and projected development trends. The BAU scenario revealed a slight increase in the basin’s cropland, a decrease in the area of forests, scrubs, grasslands, and waters, and a decrease in the area used for construction. The larger magnitude is primarily caused by the fact that a large number of people are stranded in the countryside, reclaiming a large amount of cropland, which results in the conversion of forests, scrublands, grasslands, and waters into cropland. The main reasons for this are these things, along with more people living in the watershed and more activities caused by humans, and the policy that doesn’t take into account how the lower ecological carrying capacity will affect the regional ecological environment. This aligns with the findings of Hao et al. [62] in the “one river and two rivers” watershed in Tibet; in the CLP scenario, cropland appeared to increase significantly, while at the same time, the watershed and grassland appeared to decrease to some extent. The reduction area is primarily concentrated in the river valley, which is a relatively flat and low terrain area, primarily because of cropland reclamation that has been done by humans. As a result of the influence of government policy, local residents have a greater relationship with the decrease in water and grassland caused by the large-scale development of cropland in the lower terrain area. Under the ELP scenario, there is a relatively large increase in forests, scrubs, grasslands, and water areas due to the greater emphasis on the protection of the ecological environment of the river basin. At the same time, strict restrictions on the expansion of the city’s scale to improve the efficiency of the utilization of the construction land appear to have increased. In addition to the watershed’s ecological environment increasing as a result of the policy of greater attention to ecological environmental protection, utilization efficiency, and artificial patches also appeared to decrease relatively significantly. This also caused the watershed’s economic development mode to shift from one of unrestricted expansion to one of high-quality, refined development, thereby achieving the coordination of the environment, population growth, and watershed ecology.
Impact Analysis of LULC on Carbon Stock
The project mapped the spatial patterns and carbon stocks of terrestrial ecosystems in the Lhasa River Basin at high resolution under several future development scenarios. We were able to successfully integrate the contributions of human activity and the natural environment, as demonstrated by the medium- and high-resolution mapping [20, 21]. To ensure the measurability of the spatial raster of carbon density, the study also included field measurement techniques. In order to guarantee the correctness of the spatial patterns of carbon stocks in the watershed, this study also carried out the quantitative calibration and spatial accuracy matching of the LULC raster.
Prospects and Limitations
This study evaluated and analyzed the spatial pattern of carbon stock and carbon stock in the basin under the synchronized spatial riparian pattern. However, there are still limitations and uncertainties in the analysis [11, 12]. The PLUS model was used to generate the spatial pattern of land use under various future development scenarios in the Lhasa River Basin. The current local development policies and national development goals used in the study only represent three of the future development scenarios of the Lhasa River Basin; these do not fully represent the future development scenarios of the basin. Numerous factors, including national and regional policies, the political environment both at home and abroad, the conditions surrounding economic development, the availability of regional resources, and the environment, all constrain and influence regional development. Our three suggested land use change scenarios, BAU, CLP, and ELP, only take into account the watershed’s actual existing state and anticipated future development trend. According to the watershed’s current carbon stock, land use, and economic development, it appears that the watershed’s ecological quality has somewhat declined under the BAU scenario, which is unfavorable to the watershed’s development and the preservation of its ecological environment. There is also a risk of harm to the watershed’s resources and environment. When creating regional development policies, the TAR government should consider the relationship between the ecological environment and the effectiveness of resource utilization. Under the CLP scenario, the watershed addresses issues of population growth and food security, but the effects of these policies may be limited and have little bearing on the preservation of the ecological environment and the efficient use of land. Under the ELP scenario, the development of the watershed and the preservation of the ecological environment are not supported, even though the construction of the watershed ecosystems and the state of land use have somewhat declined. The ELP scenario has a restricted amount of construction land, but it can still have a positive impact on the watershed’s ecological environment protection and increase the productivity of both cropland and construction land. This has a direct impact on the watershed’s sustainable development. We plan to investigate more thorough development options for the watershed in later research. To satisfy the demands of different stakeholders in the watershed for the best possible land allocation within the watershed, consideration is given, for instance, to the effects on LULCs of future changes in the plateau climate and the implementation of the Tibetan Plateau Ecological Protection Law.
Conclusions
This study examined the watershed ecosystem’s carbon stocks under future land use structures in the Lhasa River Basin in Tibet based on the InVEST-PLUS model. The Integrated Valuation of Ecosystem Services and Trade-Offs (In-VEST) and Patch Generation Land Use Simulation (PLUS) models were combined. Along with analyzing the spatial patterns of carbon stocks in the watershed in 2030 and 2040, this study also examined such patterns in terrestrial ecosystems in the watershed based on the LULCC. The study’s findings demonstrate that (1) the future development scenarios in the Lhasa River Basin increased the areas available for crops at the expense of the area of forests, grasslands, and watersheds, with the latter being especially noticeable in the wide, flat valley area in the middle and lower reaches of the basin;
(2) the carbon stocks in the basin increased significantly when compared to 2020, with the exception of the 2040 BAU scenario; and (3) in 2040 and 2030, under the same development scenarios, the overall spatial carbon stock in the Lhasa River Basin showed a relatively large decrease. This decrease was related to the reductions in forests, grasslands, scrubs, and waters within terrestrial ecosystems and the increase in constructed land. Nonetheless, under the ELP scenario, ecological projects can raise the carbon stocks of terrestrial ecosystems in the watershed, and analyses focusing on the ELP scenario and alternative development scenarios can clarify the connection between various land uses and carbon stocks in the basin. Therefore, to achieve the sustainable development of important ecological regions, local governments can implement policies such as afforestation, turning farmland back into forests, and providing grass for livestock in addition to carbon sequestration. This will increase terrestrial ecosystem carbon stocks and decrease the loss of terrestrial ecosystem service values and functions.

