

Introduction
Urea is often the N fertilizer choice in conventional irrigated systems in Northwest China because of its high N concentration and favorable cost [1]. When applied to soil, commonly as granules, only 40% of the applied N is recovered by crops globally [2]. Most of the unrecovered fertilizer N by plants may be released as N2O through several biochemical processes, but there remains a poor understanding of their regulation and variation among soil types [3], causing a series of adverse consequences, including air pollution and climate change. Therefore, strategies to stabilize urea and improve N availability in the plant-soil system are needed to meet corn N demand and mitigate environmental pollution. To reduce N losses and increase fertilizer N use efficiency, urease inhibitors [4] and nitrification inhibitors [5] have been introduced to agricultural soils.
Urease inhibitors, such as N-(n-butyl) thiophosphoric triamide (NBPT), have been developed to minimize N loss by inhibiting urease enzyme activity, delaying urea hydrolysis, and preventing the elevated pH that drives NH3 loss [4]. Nitrification inhibitors, such as 3,4 dimethylpyrazole phosphate (DMPP), can slow the conversion of NH4+-N to NO3--N by decreasing the enzymatic activity of ammonium-oxidizing bacteria, leading to a reduction in nitrification and the emission of N2O from soils [6]. In a meta-analysis using data from 12 countries, Silva et al. (2017) reported that the application of urea with NBPT decreased average cumulative NH3 losses by 52% across a range of soil pH values [7], soil textures, organic carbon contents, N rates, and inhibitor concentrations because it reduced the activity of the urease enzyme and therefore slowed the hydrolysis of urea, leading to a decrease in the volatilization of ammonia (NH3) from soils. In a global meta-analysis, Wu et al. (2021) found that the application of urea with a nitrification inhibitor (e.g., dicyandiamide, DCD) decreased N loss by N2O emissions [8], but furthermore, when urea was applied with both urease and nitrification inhibitors, both NH3 volatilization and N2O emissions were reduced, thus avoiding pollution swapping [9]. Conflicting results exist regarding the impact of NBPT on N2O emissions and N loss, with some studies showing no effect [10] and others reporting positive effects [11]. Some results indicate that N2O emissions were partly derived from below-ground sources of N not affected by DMPP [12]. Thus far, little information is available on the potential of the combined application of DMPP and NBPT to reduce greenhouse gas (GHG) emissions.
Freeze-thaw (FT) cycle events mainly occur at high latitudes, high altitudes, and in some temperate regions [13]. Approximately 55% of the total land area in the Northern Hemisphere experiences seasonal soil freezing [14]. Many research articles have reported that the FT process can alter soil nitrogen pools and stimulate nitrogen turnovers, such as mineralization, nitrification, and the emission of nitric gas in croplands [15, 16]. Freeze-thaw cycles can lead to a depletion of O2 in the soil, stimulating N2O production via denitrification [17]. It has been demonstrated that N2O emissions associated with freeze-thaw cycles can account for 20-90% of annual emissions [18], and neglecting freeze-thaw emissions would underestimate agricultural N2O emissions by 17- 28% [19]. Some studies conducted in natural as well as agricultural systems have addressed how FT cycles can lead to an increase in N2O emissions [20]. Notably, only 25% of the included data covered an entire year, including both fallow and growing seasons, in the meta-analysis conducted by Ruser and Schulz (2015) [21]. The effects of nitrification and urease inhibitors summarized in these studies were mostly limited to measurements made only during the crop-growing season.
To our knowledge, some studies investigating the effect of urease and nitrification inhibitors on N2O in rainfed maize soil have been reported [22]. However, studies on the effect of FT combined with urease and nitrification inhibitor application on nitrogen mineralization, nitrification, and denitrification are relatively insufficient, and therefore, it is still unclear how repeated FT cycles will influence these responses. Thus, we conducted an incubation using typical arable soil and a combined method inhibiting N2O production (NBPT and DMPP) to distinguish the relative contributions of FT cycles to soil N2O emissions in the context of inorganic N (urea) amendments. We hypothesized that (1) FT cycles can alter nitrogen transformation processes in irrigated silt soils, and (2) DMPP and NBPT applications provide the same opportunity to reduce soil N2O emissions from agricultural ecosystems during FT periods.
Materials and Methods
Site Description and Soil Collection
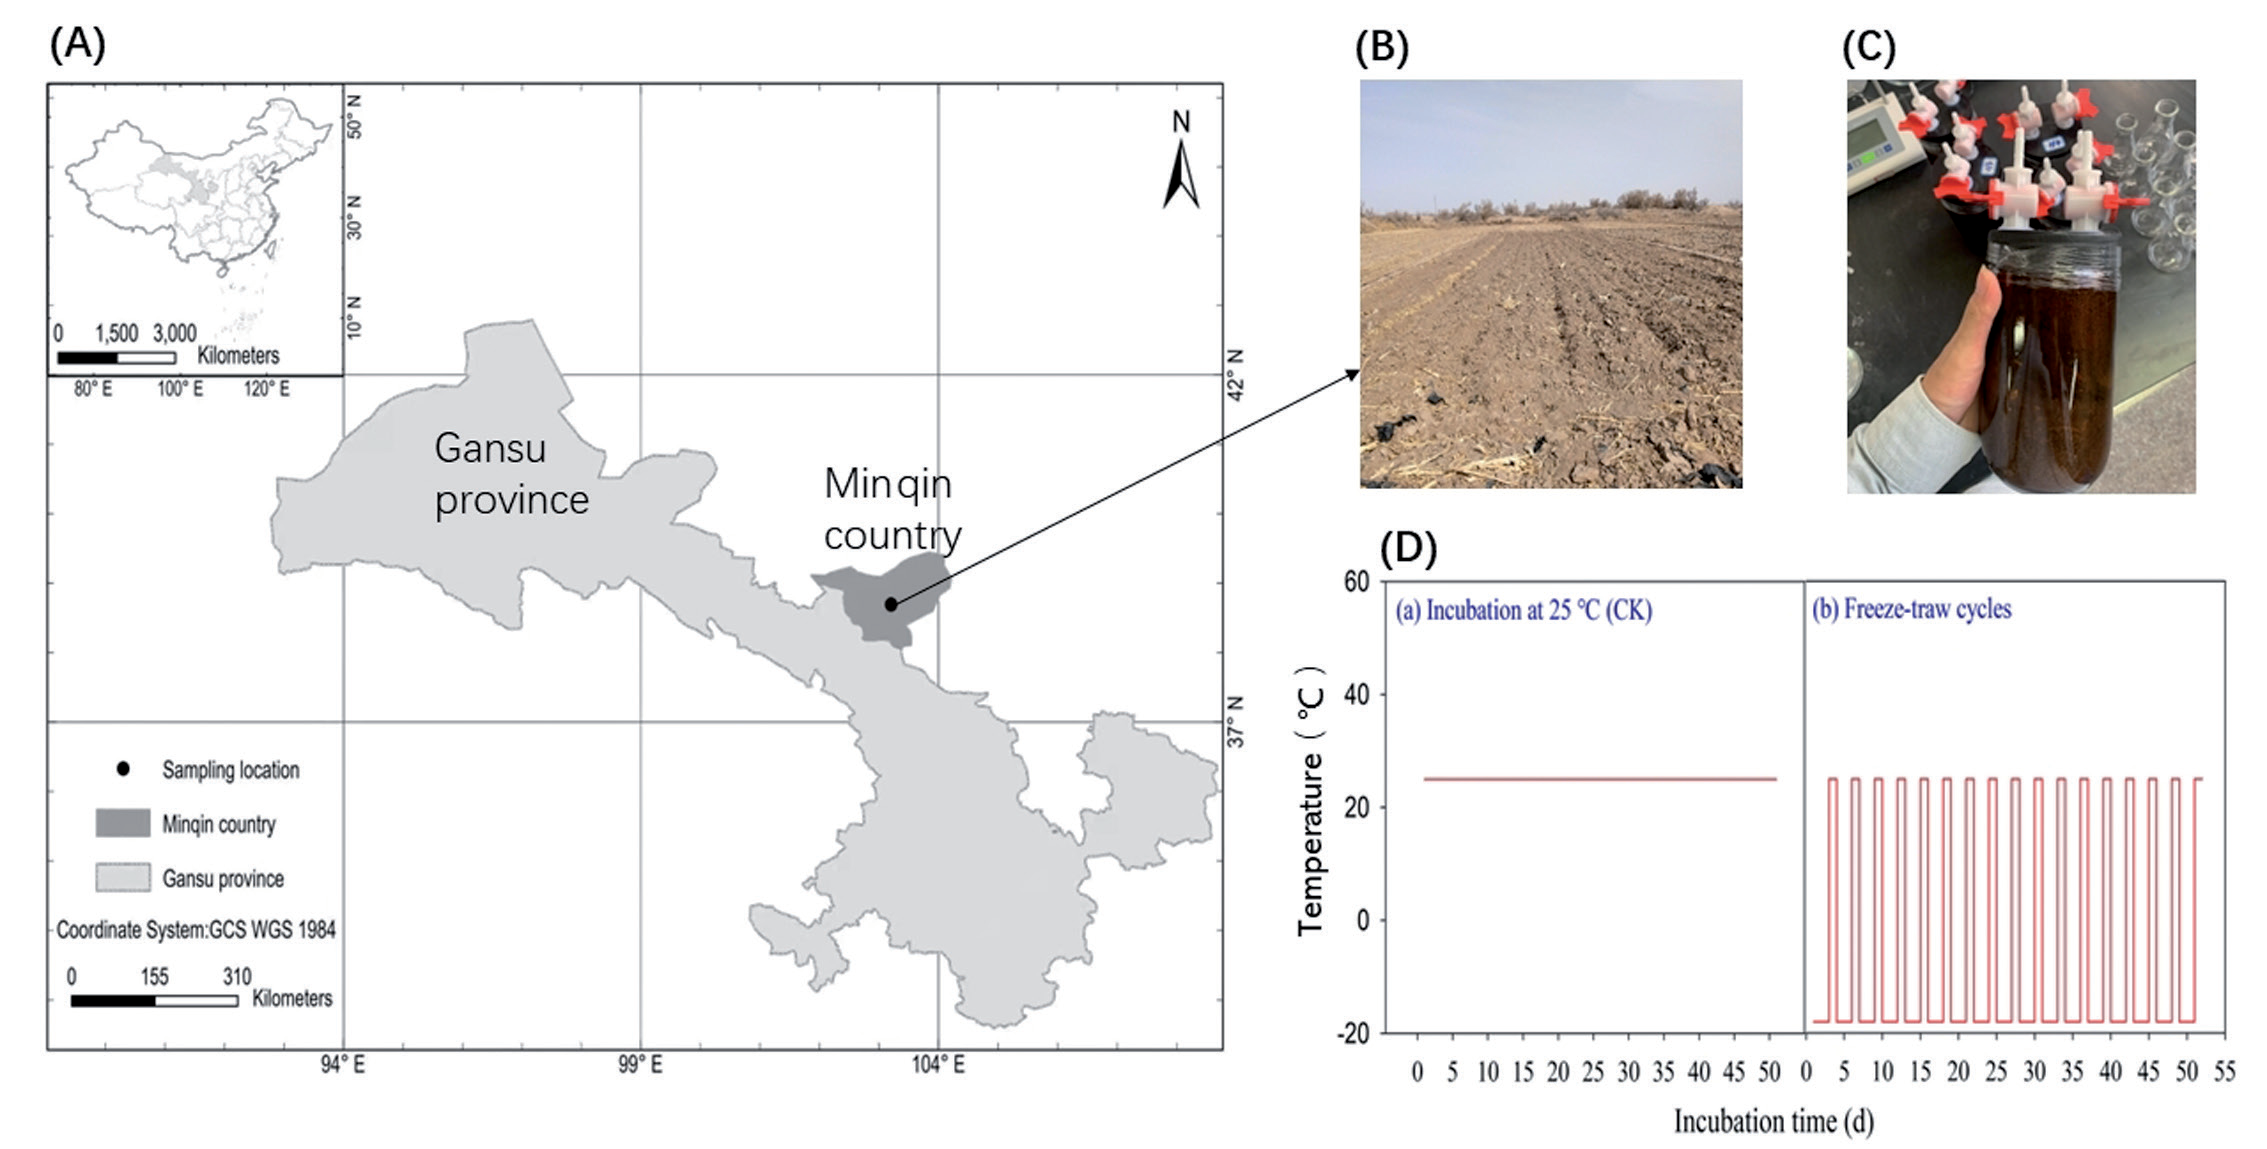
The experimental soil samples were collected from Minqin County in Gansu Province, China (103o07′ 00.16″E, 38o37′10″N) (Fig. 1), located within the lower reach of the Shiyang River basin in the Hexi Corridor and bound by the Tenggeli and Badanjaran Deserts [23]. The area is characterized by a typical arid continental climate with a mean annual air temperature of 7.8 ℃, a mean annual precipitation of 113.2 mm, most of which falls between July and September, and an annual average evaporation of 2,646 mm.
The soil at the research site is irrigated desert soil according to the Chinese Soil Classification System and is similar to Anthropic Camborthids according to Soil Taxonomy [24]. Other relevant environmental conditions and agricultural production in the study area are described by Feng et al. (2011) [23]. Soil samples were collected from conservation tillage arable lands set up in 2014 (Fig. 1) with flat planting of spring maize (Zea mays L.). At the start of the experiment, the soil had a pH of 8.63, 0.29 ms cm–1 specific conductance, 9.80 g kg–1 organic matter, 4.84 g kg–1 total N, 0.40 mg kg–1 available phosphorus (P), and 144.14 mg kg–1 available potassium (K). Soil samples were taken from the plow layer (0-20 cm) using a 10 cm diameter auger at five randomly selected points in April 2021 and mixed to create a composite sample per plot. The visible roots and rocks were removed in this step.
Soil Incubation Experiment and Sampling
The collected soil samples were dried at 4°C to maintain soil biological activity, crushed, and passed through a 5-mm nylon fiber soil sample sieve before incubation. The incubation experiments were conducted in 500 mL glass incubation flasks (Fig. 1), and before incubation, soil samples equivalent to 250 g portions of oven-dry soil were adjusted to approximately 15% of the maximum water-holding capacity (WHC) and preincubated at 25°C for 7 days to restore soil microbial activity. Soils were mixed with urea (N 46.0%), urea +NBPT, and urea + DMPP (urea at a rate of 300 mg N kg-1 soil and NBPT and DMPP at a rate of 2% of urea-N) and incubated under different FT cycles (freezing at -18°C for 48 h and thawing at 25°C for 24 h, referred to as one FT cycle, Fig. 1d). Sterile water was added to the soil by weighing it to determine 60% of WHC during incubation periods. There were six treatments in total (FUR: urea addition with FT cycles; RDP: urea + DMPP addition with a constant temperature of 25°C; FDP: urea + DMPP addition with FT cycles; RNP: urea + NBPT addition with a constant temperature of 25°C; FNP: urea + NBPT addition with FT cycles; CK: addition with urea and continuous incubation at 25°C). Three replicates were prepared for each treatment.
Destructive sampling was performed after one FT cycle (3 days), three FT cycles (9 days), twelve FT cycles (36 days), and seventeen FT cycles (51 days). To measure the flux of N2O, air exchange between the inside and outside of the incubation flasks was stopped 2 h before the end of the freeze-thaw cycle, and the flask gas exchange valve was closed. When the incubation was finished, the gas in the incubation bottles was extracted with a 50 mL syringe and transferred to a 100 mL aluminum foil gas collection bag to send samples for measurement. After destructive soil sampling, part of the soil samples was stored in a 4°C refrigerator for the determination of soil enzyme activity and microbial biomass carbon and nitrogen analyses, and part was air-dried and used for the determination of soil physical and chemical properties.
N2O Flux Measurements
N2O concentrations were measured using a gas chromatograph (Varian CP-3800, Palo Alto, CA, USA) equipped with thermal conductivity (TCD), flame-ionization (FID), and electron capture (ECD) detectors, which assessed the carbon dioxide (CO2), methane (CH4), and nitrous oxide (N2O) levels. The GHG concentration was calculated using the following equation: F = β × (c/t) × v × 273/(W × (273 + T)), where F denotes N2O (µg N2O-N kg−1 h−1); β denotes N2O (1.962 g/L) density in a standard state; c/t denotes the N2O (ppb h−1) accumulation rate; v denotes the volume of the gas in the flask; W denotes the dry weight (kg) of soil in the flask; and T denotes the temperature inside the chamber during sampling [25].
Soil Properties, Enzyme Activities, and Soil Microbial Biomass
Soil organic carbon (SOC) was measured using the H2SO4-K2CrO7 oxidation method, while soil total nitrogen (TN) was detected using an automatic azotometer (Kjeltec 8400, FOSS, Denmark) according to the Kjeldahl method. Soil ammonium nitrogen (NH4+-N) and nitrate nitrogen (NO3−-N) were determined using a continuous flow analyzer (AA3, SEAL Analytical, Germany) with 1 mol/L KCl extracts. Soil-dissolved organic C (DOC) was extracted with deionized water in a 1:10 soil–water ratio, filtered through a 0.45-µm filter, and measured by a TOC analyzer (vario TOC Cube, Elementar Analysensysteme GmbH, Hanau, Germany). Soil pH was measured in water (1:5 w/v) using a pH electrode.
The soil enzymes, including leucine aminopeptidase (LA) and β-1,4-N-acetylglucosaminidase (NAG), were measured following the method of [26]. The activity of urease was measured using the phenol-sodium hypochlorite colorimetric method. All absorbance values for the measurement of soil enzyme activities were read using a multimode microplate reader (Scientific Fluoroskan Ascent FL, Thermo). Soil microbes were extracted from the soil using the chloroform fumigation and extraction method [27], and then the microbial biomass carbon (MBC) and nitrogen (MBN) were measured using an elemental analyzer (Elementar Vario EL III CHNOS, Germany).
Net N Mineralization Rate and Net Nitrification Rate of Soils
The net nitrogen mineralization rate and net nitrification rate of soil were calculated by the following equations [28].
Where ti denotes the time before incubation (d), ti+1 denotes the time after incubation (d), and c[NH4+-N]i and c[NH4+-N]i+1 denotes the content of NH4+-N (mg kg-1) before and after incubation, respectively, c[NO3--N]i and c[NO3--N]i+1 denotes the content of NO3--N before and after incubation, respectively (mg kg-1), Aamm and Anit denote the cumulative NH4+-N and NO3--N before and after incubation, respectively (mg kg-1), and Rmin and Rnit denote the net N mineralization rate and net N nitrification rate (mg kg-1 d-1), respectively.
Table 1.
Soil pH, total dissolved nitrogen (TDN), total nitrogen (TN), soil organic carbon (TOC), and microbial biomass nitrogen (MBN) relating to different treatments during four incubation times. Means ± SE (n=12) followed by different letters are significantly different at p < 0.05.
Data Analysis
Experimental data were collated and summarized using Microsoft Excel 2019, and all statistical analyses were performed using IBM SPSS Statistics 21.0 software for the significance of differences, followed primarily by plotting using the R package ggplot2. The random forest algorithm was applied to estimate the relative importance of soil abiotic and biotic control factors on soil nitrous oxide emission fluxes for all incubation times, and we ran the random forest algorithm 100 times to assess the increase in mean square error (lnMSE) and thus the importance of each driver for soil nitrous oxide emission fluxes. The random forest algorithm was executed using the R package randomForest, where we set ntree and node size to 500 and 5, respectively. To check the p value of the importance of each driver, rfPermute was used in the random forest algorithm. Finally, we performed a principal component (PCA) analysis using the R packages factoextra and FactoMineR to reduce the number of variables to simplify the analysis and facilitate interpretation.
Results
Soil’s Main Nitrogen-Related Indexes
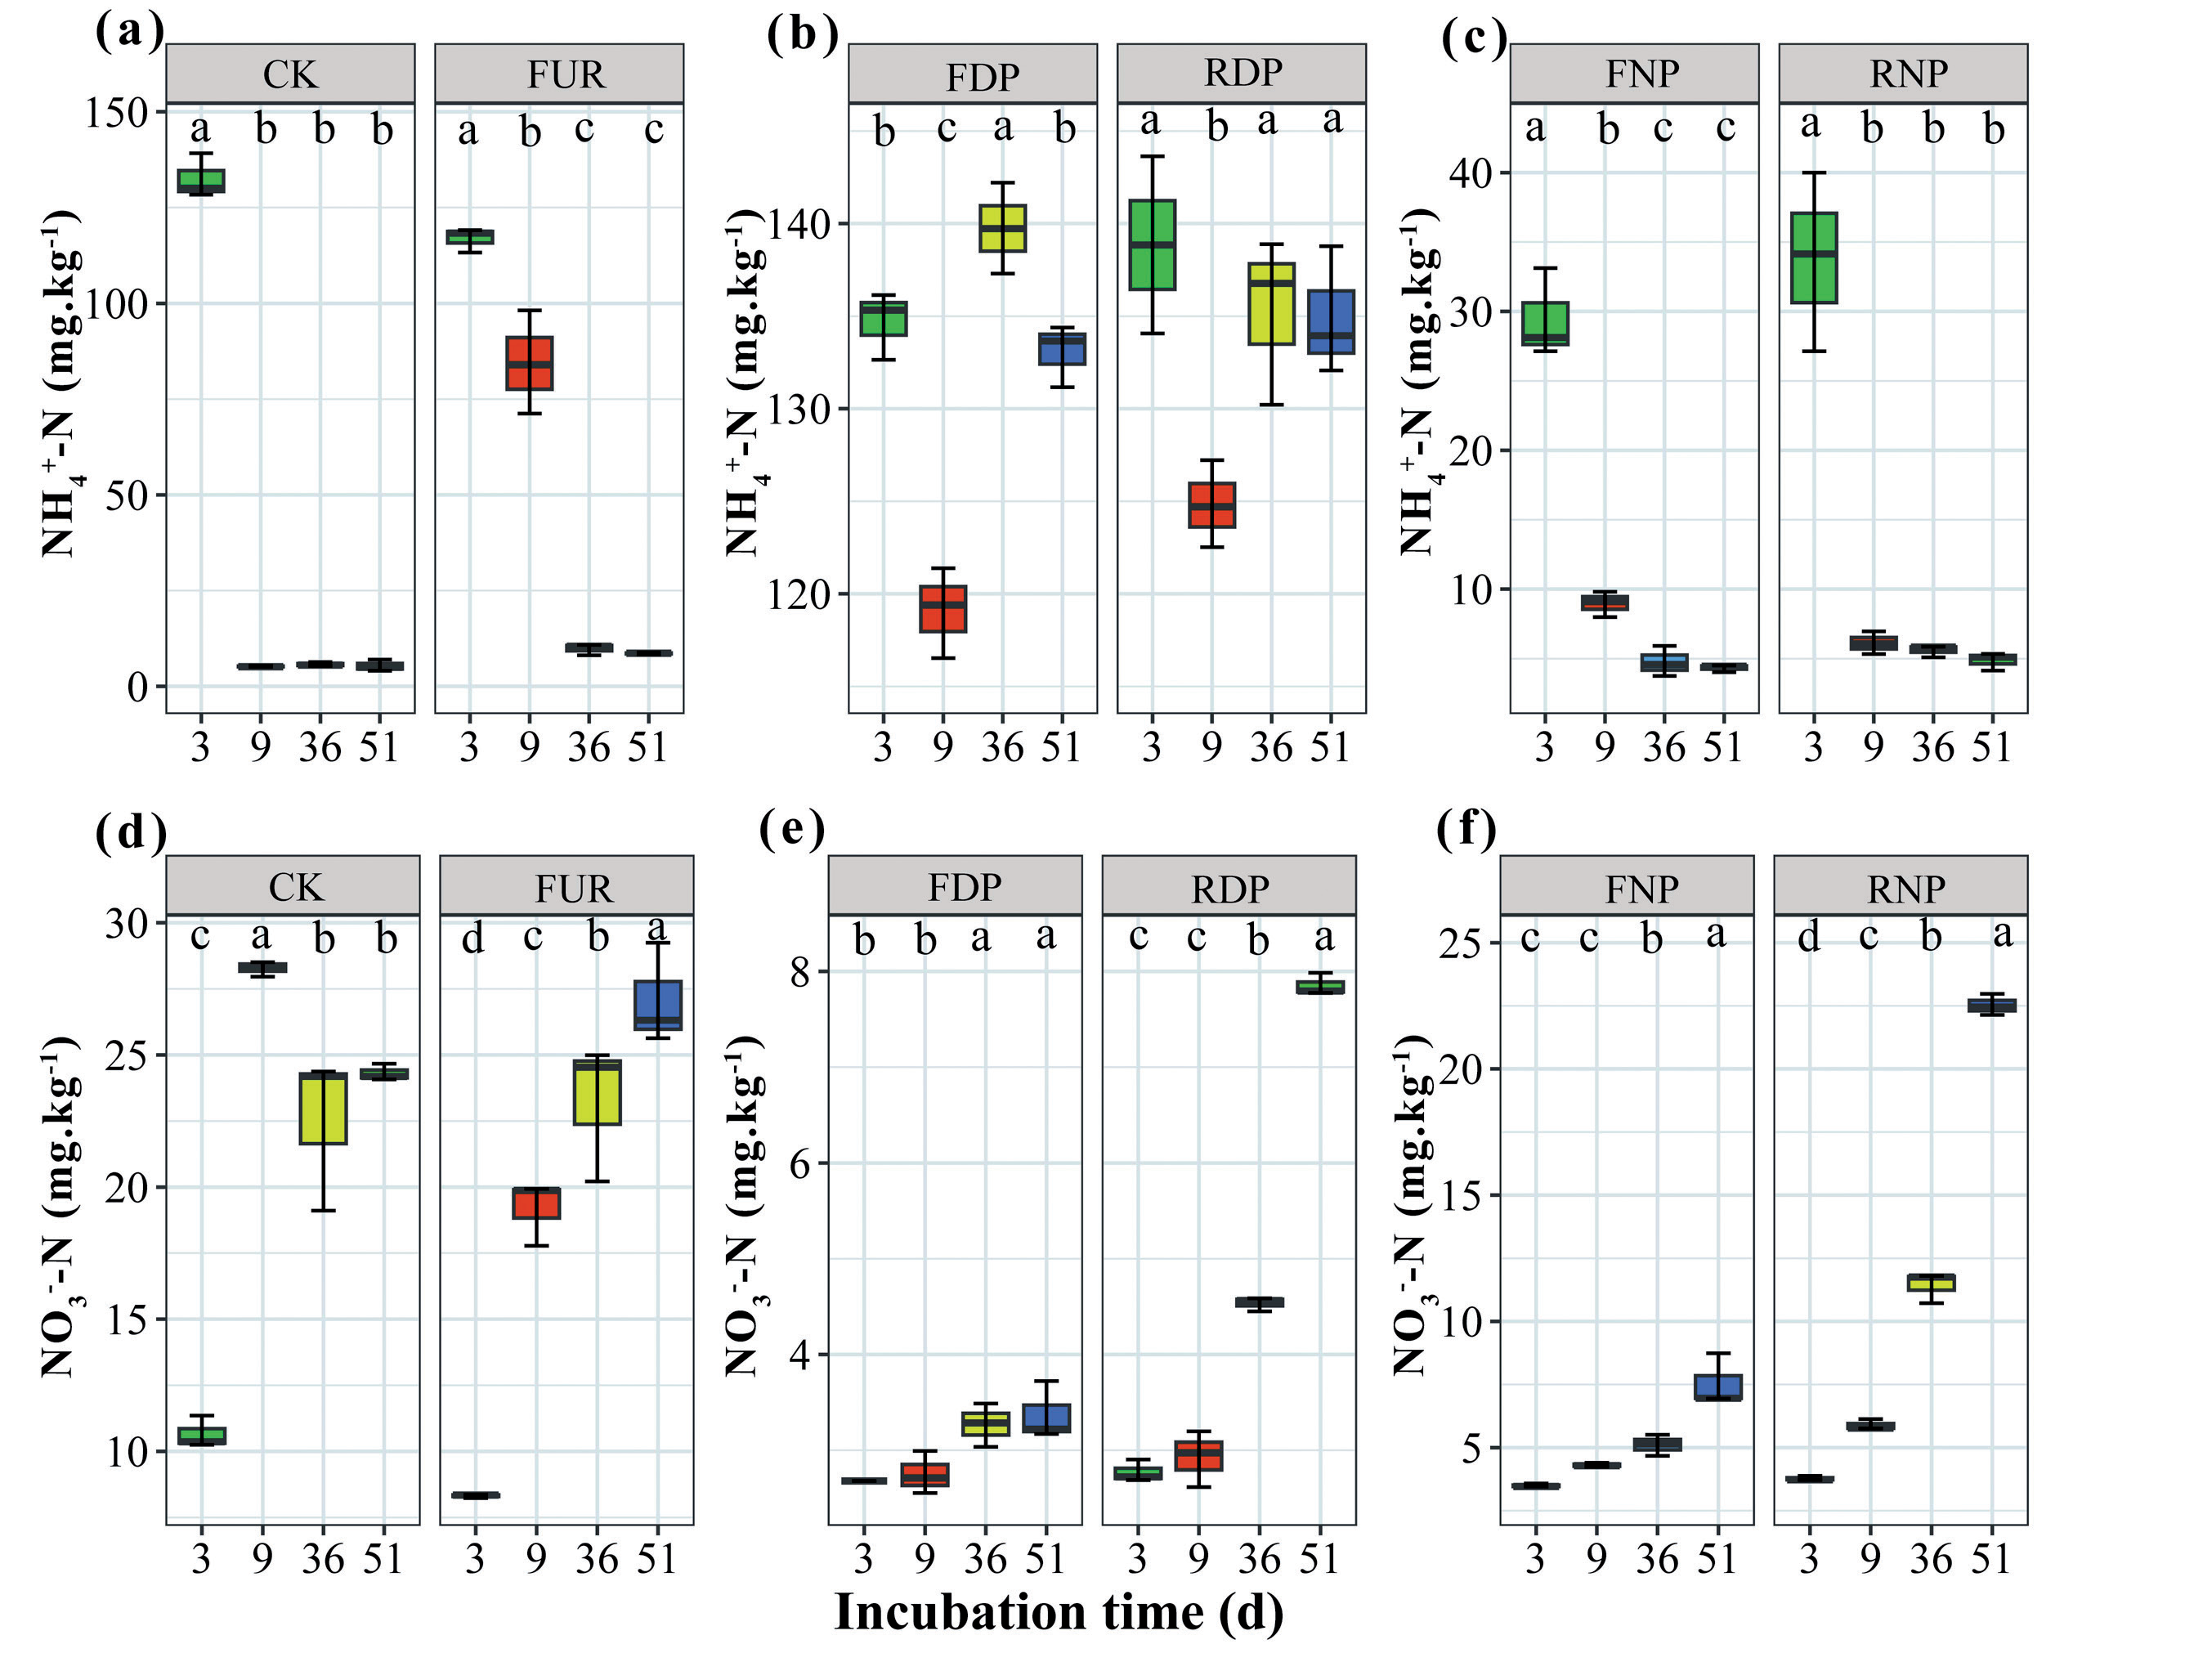
Compared with 3-day incubation, pH was significantly lower in 51-d incubation for all treatments (P<0.05; Table 1), and MBN was significantly lower in the FUR and CK treatments (P<0.05; Table 1). The TN content for CK, FUR, and FDP was maintained at 0.47-0.64 g kg-1 throughout the incubation period (Table 1), but FDP and FNP treatments had significant effects on TN content. Treatments, incubation time, and their interaction had significant effects on pH, TDN, and MBN concentrations (P<0.001, Table 1), whereas there was no effect on TOC content. Urea addition and urea addition+NBPT significantly increased soil NH4+-N concentration at 3 days after incubation; in contrast, the lowest soil NO3--N concentration was observed at 3 days of incubation (P<0.001, Fig. 2).
Soil Nitrogen Mineralization and Nitrification Characteristics
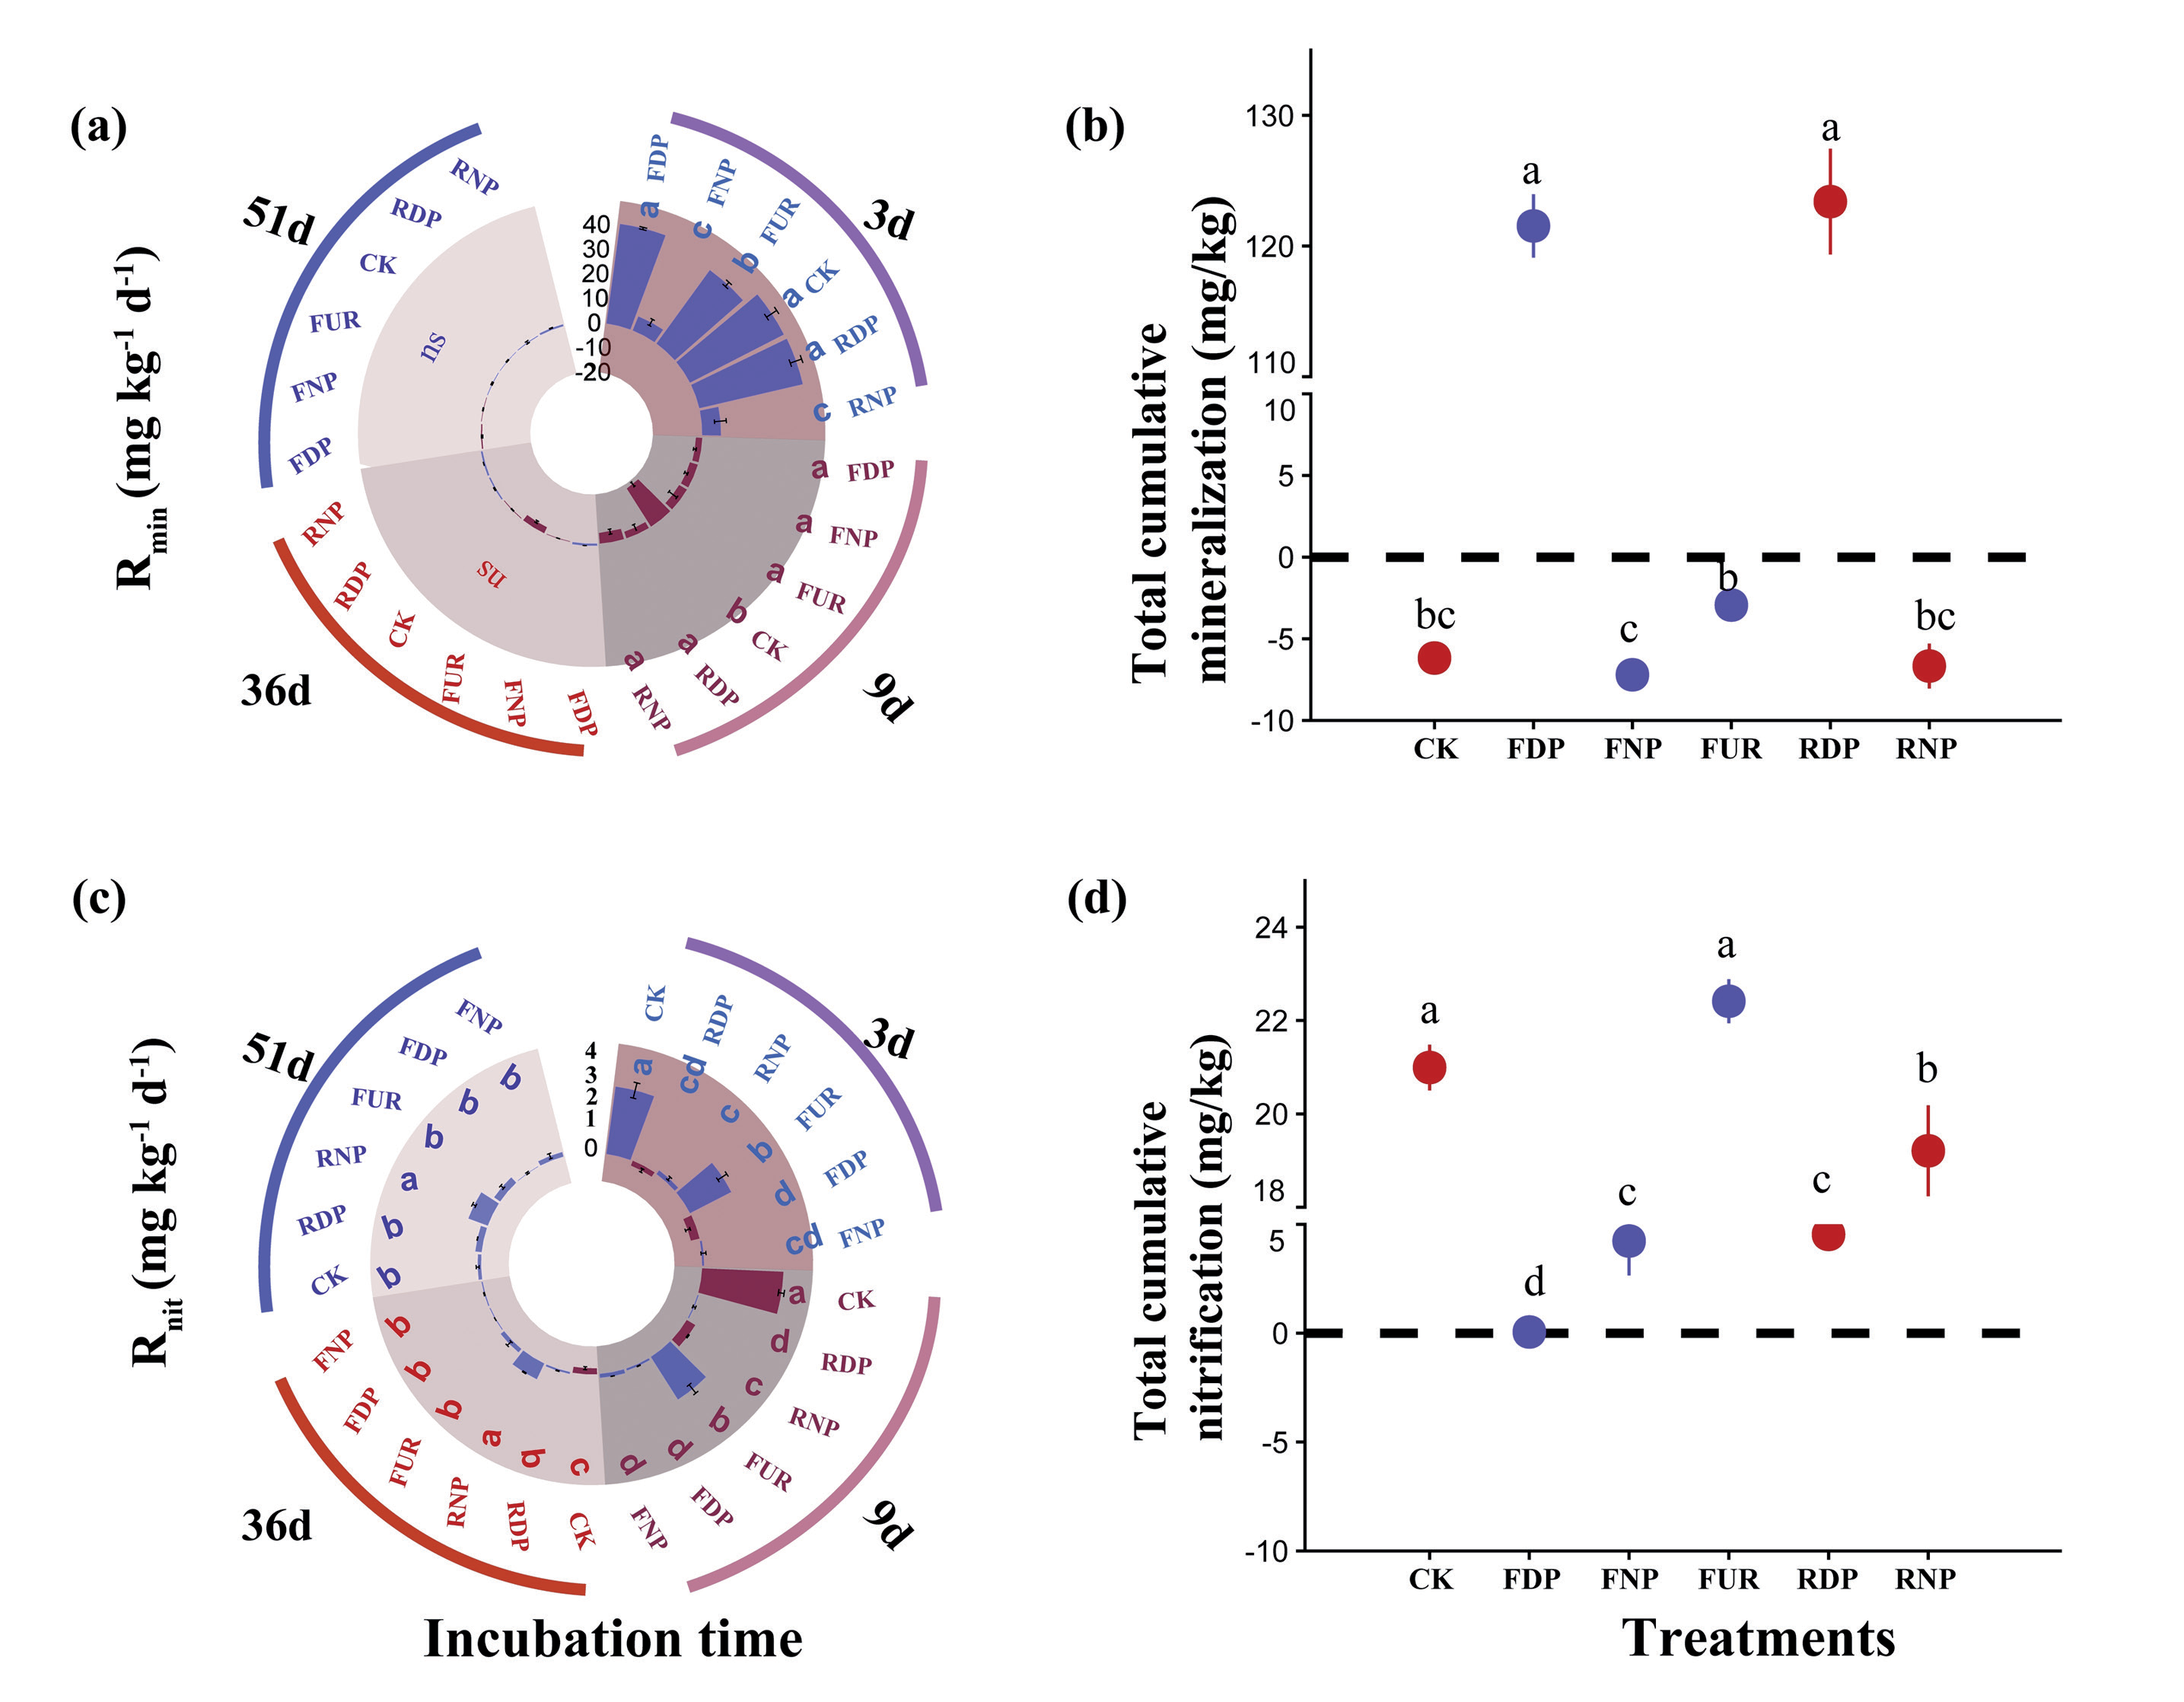
The net N mineralization rate of soil reached its peak at 3 days of incubation (Fig. 3a). Compared with CK, the net N mineralization rates were significantly lower in the RNP, FNP, and FUR treatments (P<0.05; Fig. 3). On 9 days of incubation, the net N mineralization rates were all negative, indicating the occurrence of N fixation (Fig. 3a.) on 3 days and 9 days of incubation, the net nitrification rate for all treatments was significantly lower than that of CK (P<0.05; Fig. 3c). Throughout the incubation, the FDP and FNP net nitrification rates were lower than those of FUR (Fig. 3c).
The cumulative nitrogen mineralization for RDP and FDP was significantly higher than that of the CK treatment, and the cumulative nitrogen mineralization of RNP, FUR, and FNP was not significantly different from that of CK (P<0.05; Fig. 3b), but the cumulative nitrification for RDP and FDP was significantly lower than that of the CK treatment, and the cumulative nitrification of FUR was significantly higher than that of the CK treatment (P<0.05; Fig. 3d).
N2O Emission Fluxes and Accumulation
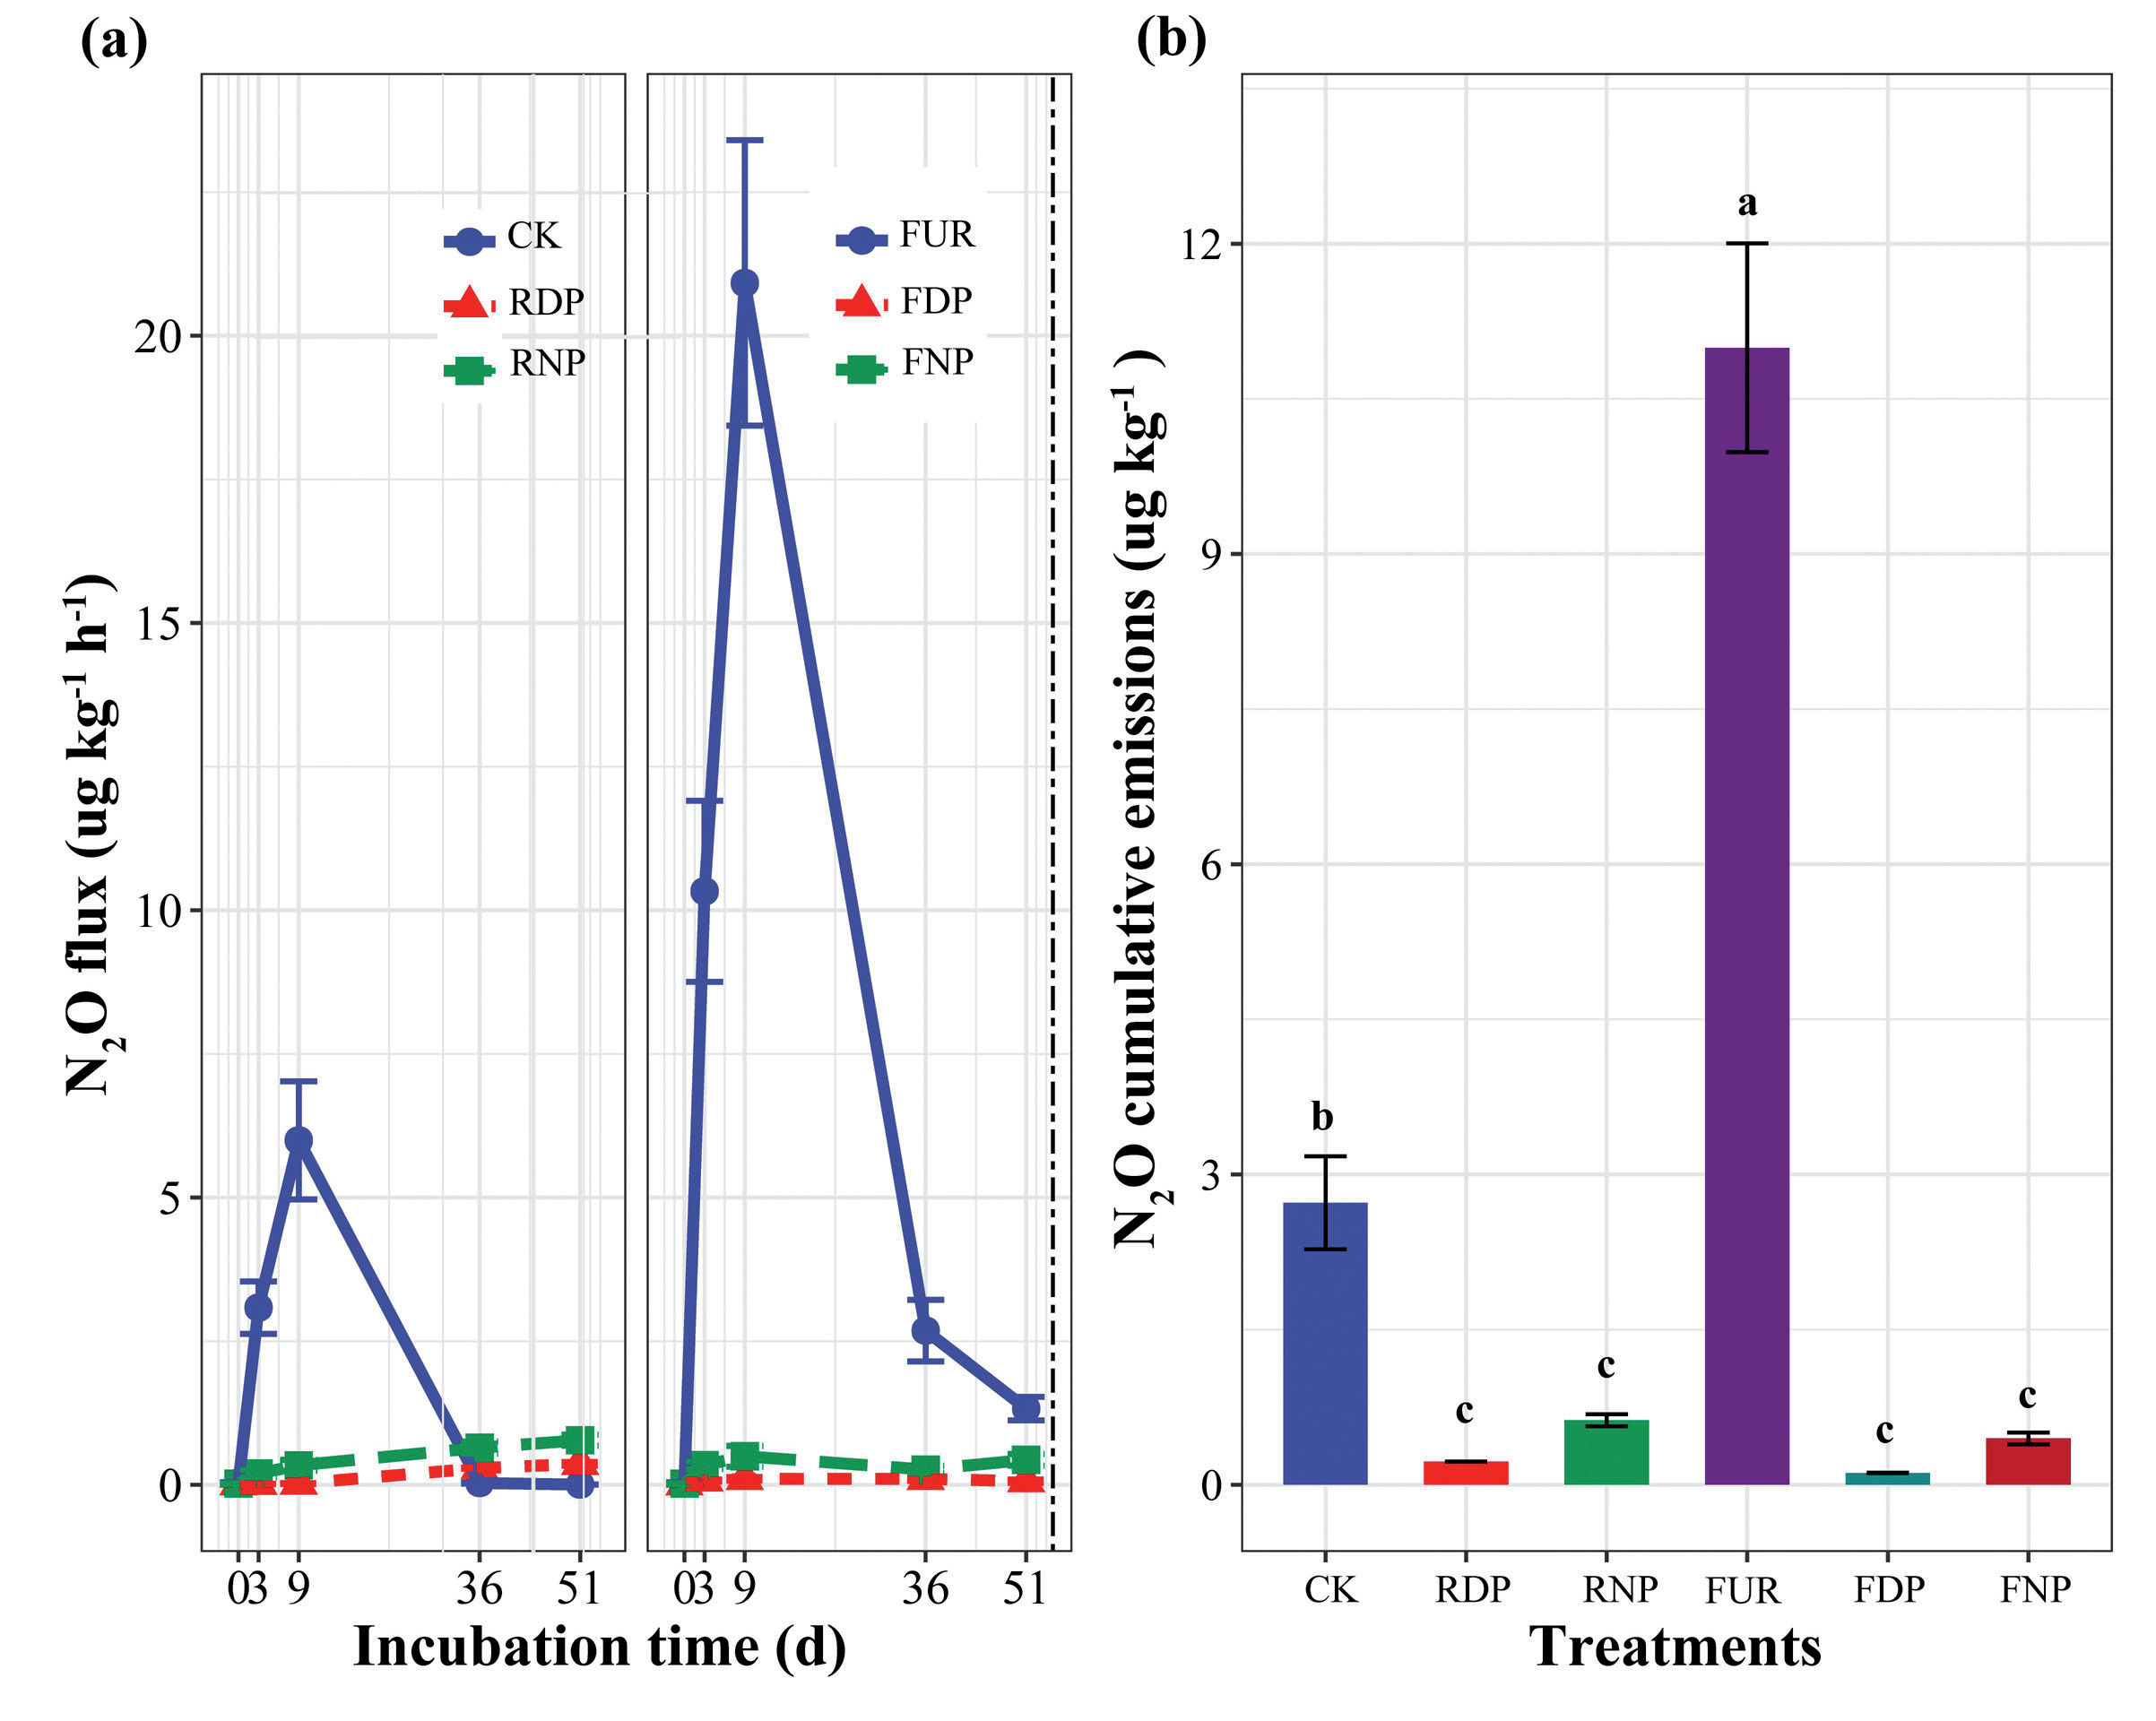
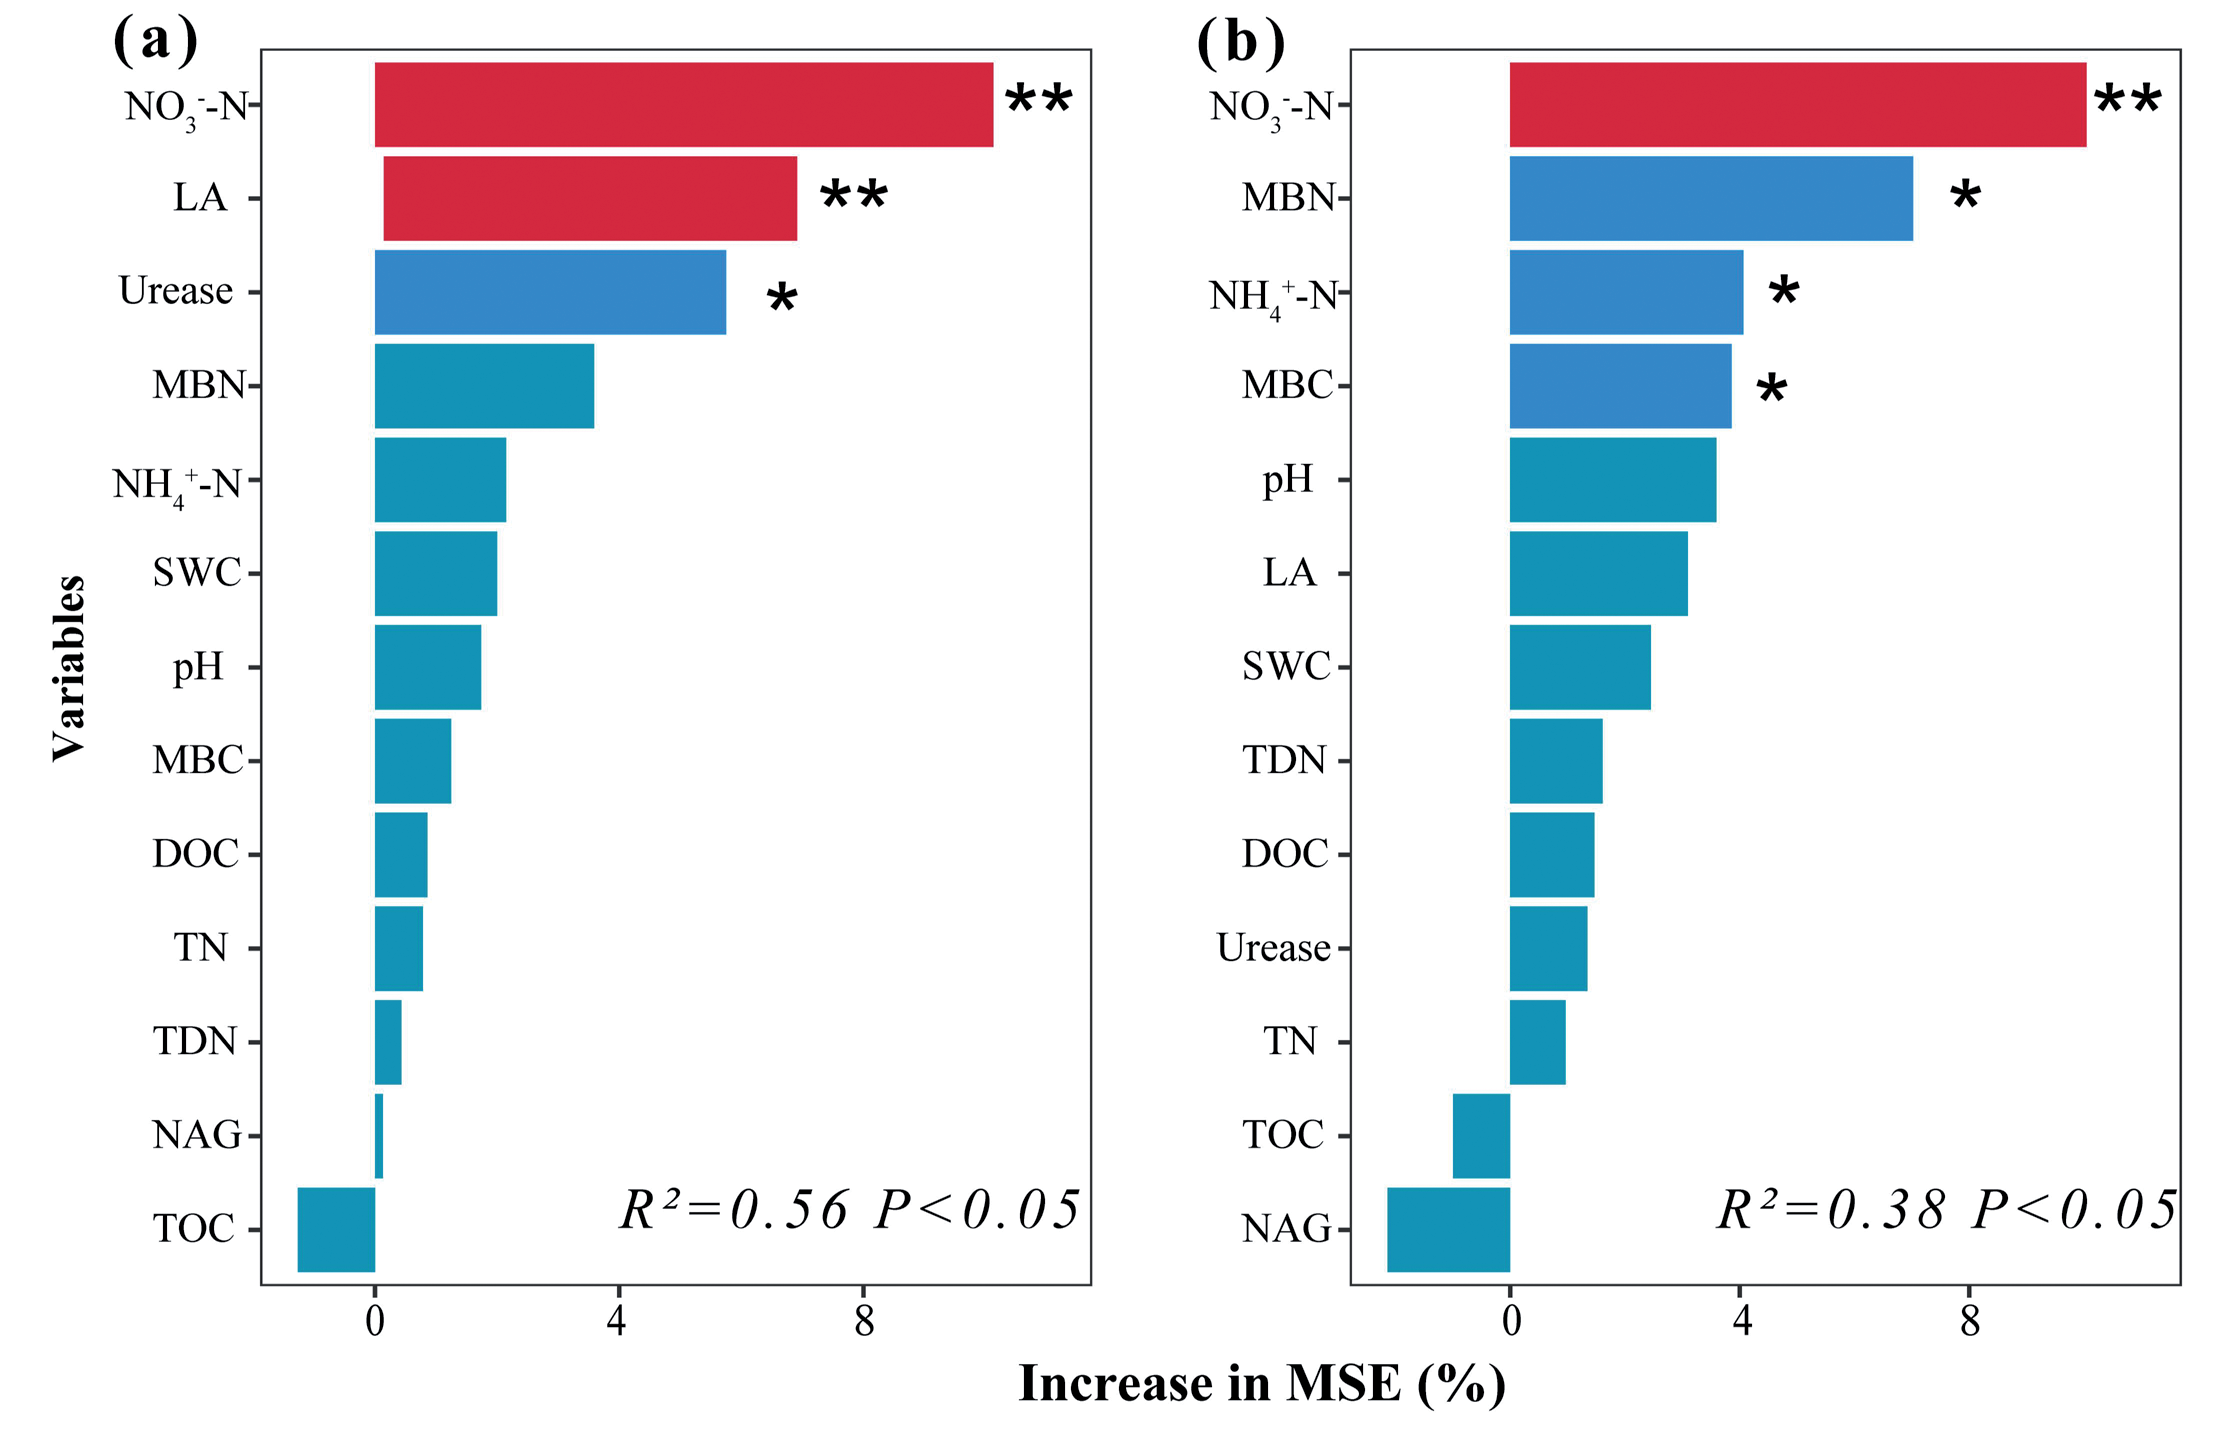
Throughout the incubation, N2O emissions in the RDP, RNP, FDP, and FNP were relatively low compared to CK (Fig. 4a). The soil cumulative N2O emissions in the FUR treatment were significantly higher than other treatments (P<0.05) and reached 10.63 ug kg-1 during the incubation period (Fig. 5b). Random forest regression analysis explained 56% and 38% of the variance in the N2O emission fluxes during the continuous 25°C incubation and freeze-thaw incubation (Fig. 5), respectively. The analysis showed that NH4+-N, LA, and urea activity (Urease) were the most important factors that controlled the soil N2O emissions during the continuous 25°C incubation (Fig. 5a). During the freeze-thaw incubation, NO3--N, MBN, NH4+-N, and MBC were the most important factors that controlled the soil N2O emissions (Fig. 5b).
Fig. 3.
Changes in net nitrogen mineralization rate (Rmin) and net nitrification rate (Rnit) of soil (mean ± SE, n = 3) under different incubation times. As well as, the effect of different incubation treatments on soil cumulative N mineralization and cumulative nitrification (mean ± SE, n = 3). Lowercase letters indicate significant differences (p<0.05) between treatments at the same incubation time.
Principal Component Analysis among Indicators
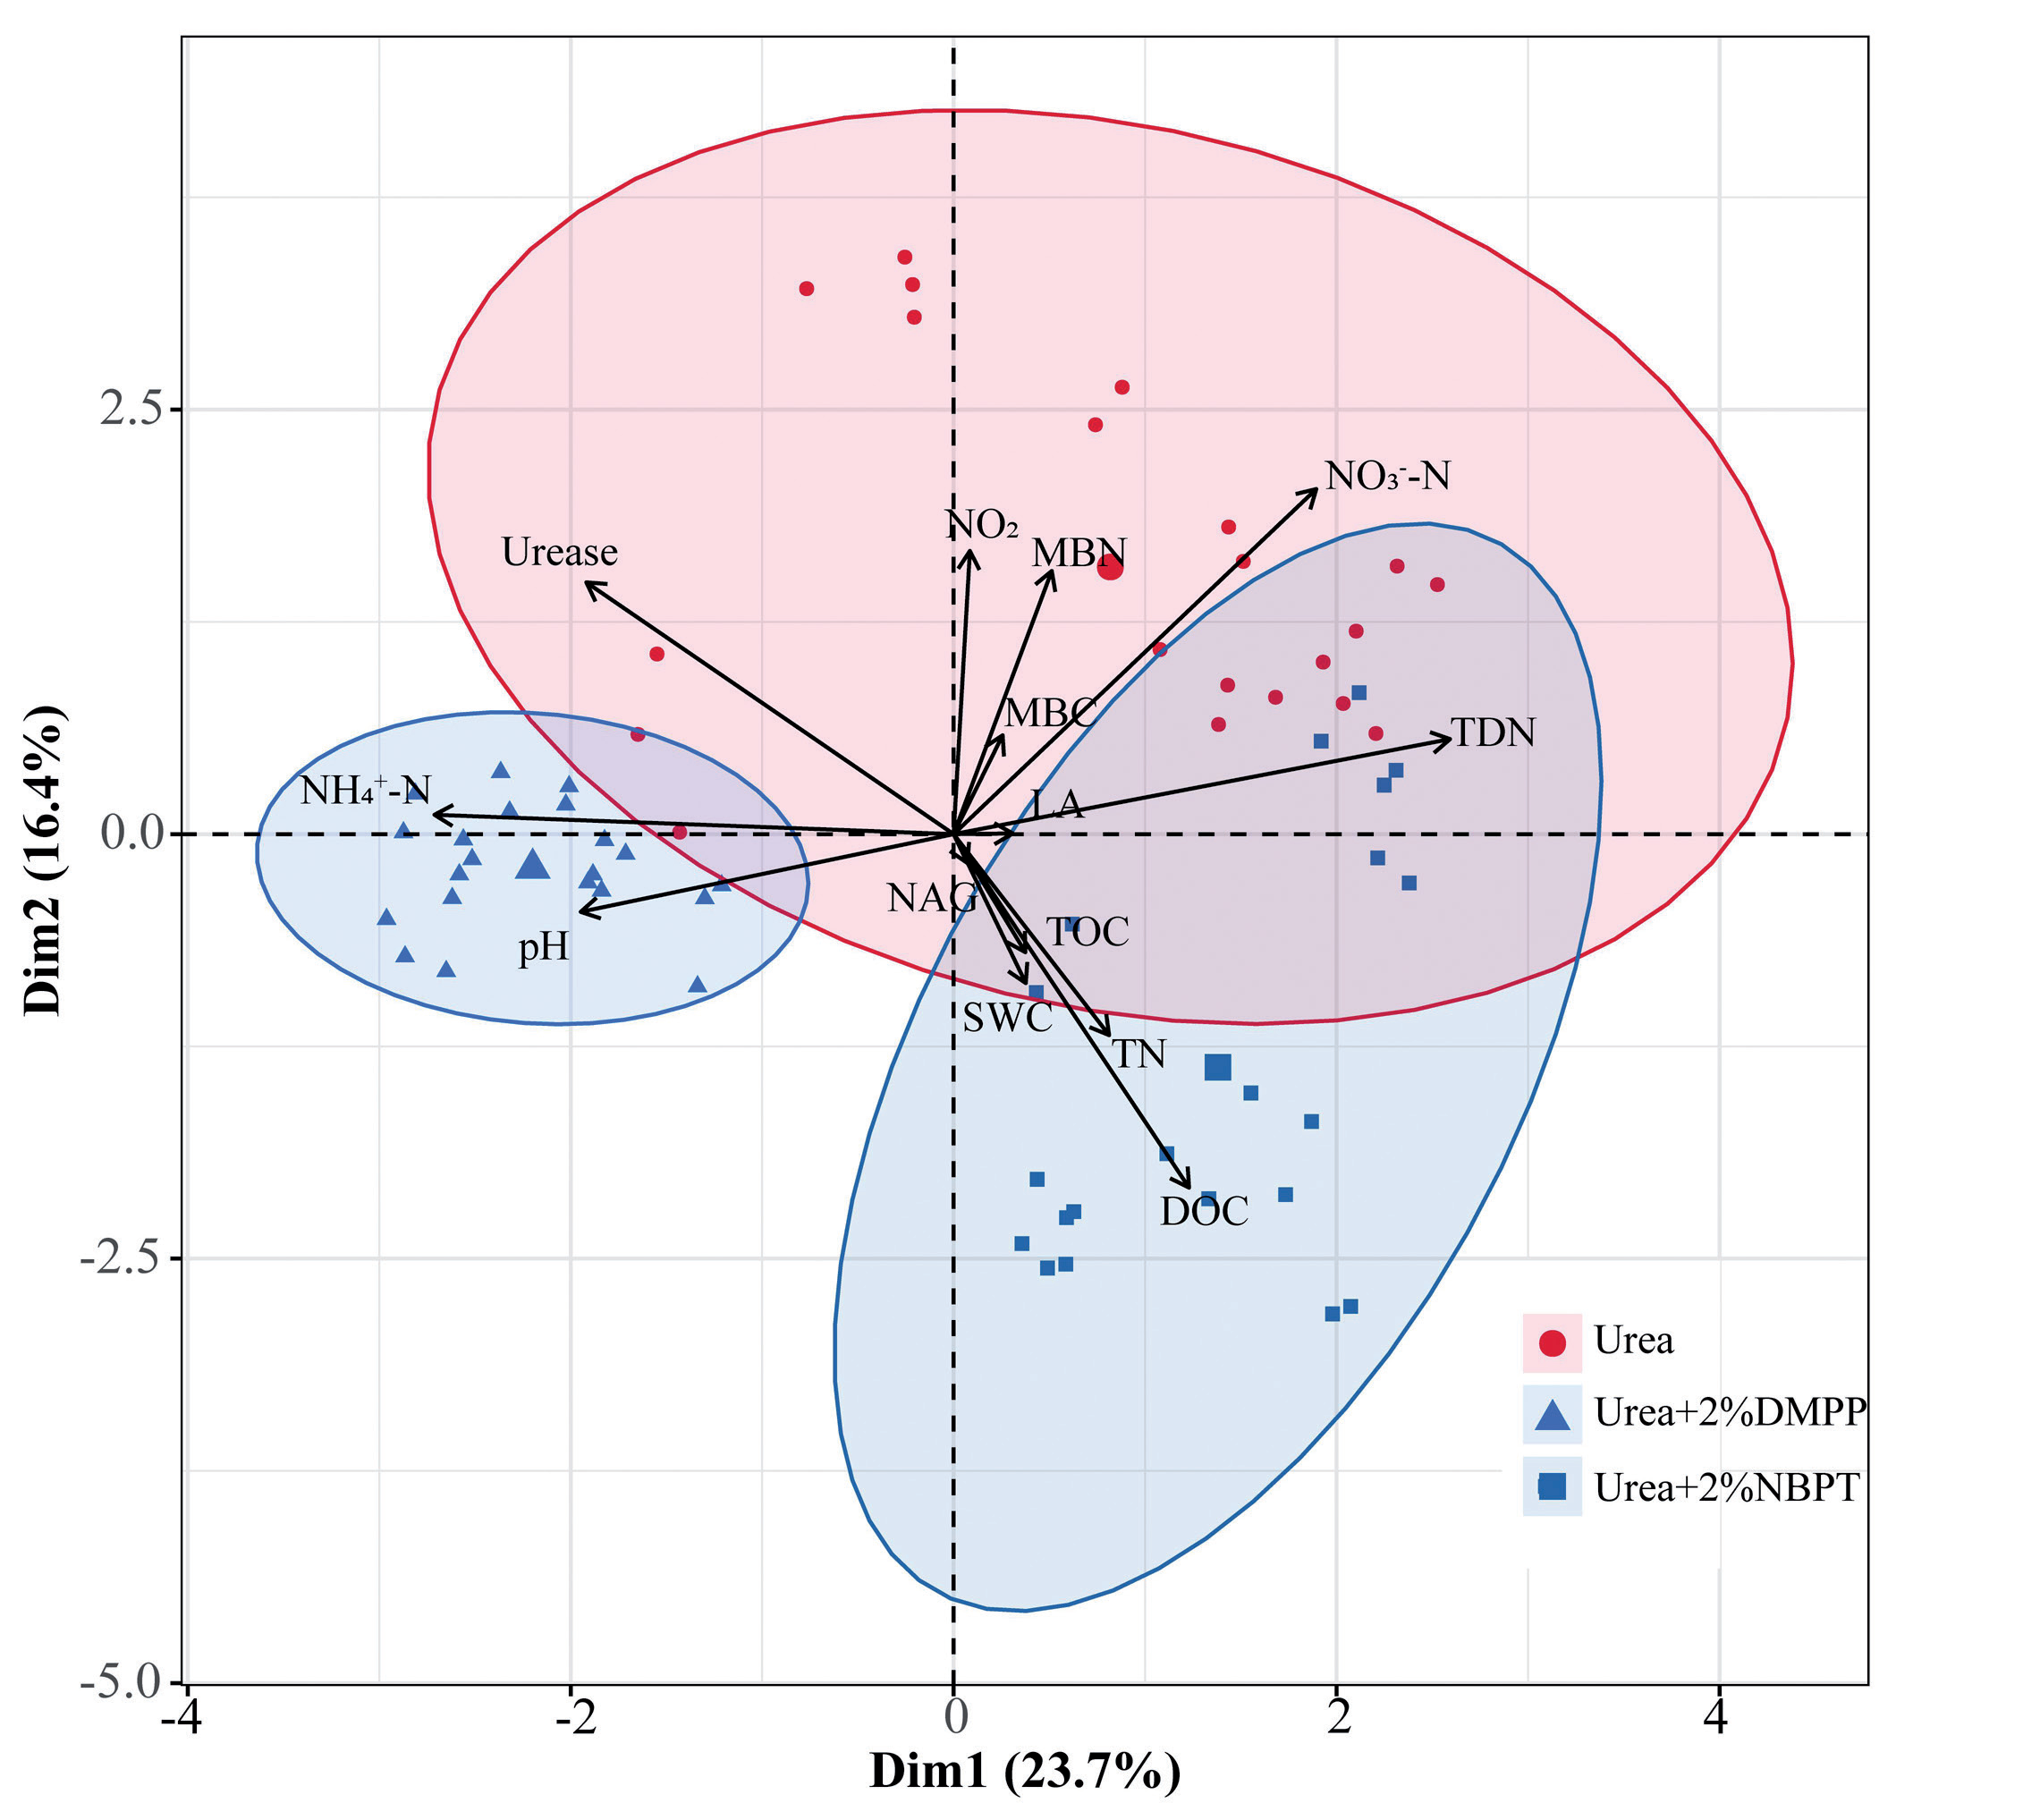
In the principal component analysis among the soil factors shown in Fig. 6, the first principal axis (Dim1) and the second principal axis (Dim2) explained 23.7% and 16.2%, respectively, and the cumulative explanation of the two principal axes was 39.9%. The contribution of each factor to the principal components was ranked as follows: TDN > NH4+-N > NO3--N > urease > N2O > MBN > LA > PH > MBC > NAG > DOC > TOC > TN > SWC. The N2O emission flux was linearly and positively correlated with MBN, MBC, NO3--N, and urease activity (Fig. 6).
Discussion
Effect of Urea with DMPP/NBPT on Soil Nitrogen
Transformation
Ammonia nitrogen was not significantly decreased by the use of DMPP during continuous 25°C incubation; even despite this, inhibitors enlarged the pool of NO3--N in soil within the period of 3 to 51 days after fertilization (Fig. 2b). The possible explanation is that after urea application to soil, it is converted to NH4+-N through rapid hydrolysis by microbial urease, and NH4+-N is easily lost through volatilization or is oxidized to nitrate (NO3-) and leached out [29]. DMPP inhibits the transformation of NH4+-N to nitrite by suppressing the abundance of AOB-amoA, thus reducing the risk of NO3--N leaching and nitrogen loss [30-33], because the oxidation of ammonia nitrogen to NO3- (nitrification process) is controlled by ammonia monooxygenase (AMO), which is produced by nitrifying bacteria [ammonia oxidizing bacteria (AOB) and ammonia-oxidizing archaea (AOA)] [34, 35]. As a whole, compared with N fertilizer alone (CK), we found that at the same N application rate, collaboration with DMPP (RDP, FDP) significantly inhibited the net nitrification rate of the soil (Fig. 3) and resulted in a lower NO3--N content (Fig. 2), especially in freeze-thaw treatments, implying that the application of a nitrification inhibitor (DMPP) significantly inhibited the nitrification process in the soil, reducing nitrogen losses in the fallow period (winter) and effectively improving soil N fertilizer utilization during the plant growing season in semi-arid areas [36, 37].
Fig. 5.
Relative contribution of influencing factors to soil N2O emission fluxes for all soil sampling dates under ambient 25°C incubation (a) and freeze-thaw incubation (b). The importance of predictor variables is estimated using the percentage increase in the mean squared error (MSE; %) from 100 runs of the random forest model. *p < 0.05, **p< 0.01.
The significantly lower NH4+-N concentration in the urea with NBPT (FNP and RNP) treatments compared to urea alone in the initial days indicates that the NBPT is inhibiting urea hydrolysis [38]. The decrease in soil NH4+-N concentration towards the end of the experiment in the NBPT treatments compared to DMPP addition (Fig. 2) could be due to the inhibition of the hydrolysis by NBPT as NBPT activity had been persisting; meanwhile, DMPP treatments could accelerate NH4+-N release even under freeze-thaw conditions. In addition, urea with NBPT application under freeze-thaw cycling incubation (FNP) and 25°C incubation (RNP) did not significantly change soil net mineralization rate (Fig. 3a); however, the net nitrification rate of soil gradually increased with increasing incubation time (Fig. 3c), and the cumulative nitrification was significantly different from that of CK (Fig. 3d). This could be explained by the action of NBPT slowing urea hydrolysis [38] through the inhibition of the urease enzyme in the soil and thus reducing the pool of exchangeable NH4+. This allowed more time for urea to diffuse into the soil.
Effect of Urea with DMPP/NBPT on Soil Nitrous
Oxide Emissions
As shown in Fig. 5, N2O emission fluxes and accumulations were largely influenced by the nitrogen treatments. DMPP suppressed the peak rates of soil nitrification and nitrous N2O fluxes and attenuated cumulative soil nitrous oxide gas emissions by almost 70% (Fig. 4), almost completely suppressing N2O emissions induced by urea treatment. This is consistent with the results of studies over the last decade confirming that the application of nitrification inhibitors significantly reduced N2O emissions by inhibiting NH4+-N oxidation and delaying the nitrification process [8, 21]. Related studies have shown that functional genes encoding catalytic ammonia oxidases (AOA/AOB amoA genes) are commonly used as predictors of N2O production and consumption [39-41]. We speculate that the present experiment may be because DMPP significantly reduced the transcript level of the AOB amoA gene and inhibited the growth and activity of ammonifying bacteria AOB in the soil, thereby inhibiting the oxidation of ammonia to nitrite and reducing nitrification by nitrifying bacteria, as well as reducing the substrate for the nitrifying bacterial denitrification and nitrification-coupled denitrification pathways, under the dual effect of DMPP on the autotrophic nitrification and denitrification processes. The N2O emissions caused by urea were attenuated by the dual inhibition of autotrophic nitrification and denitrification processes by DMPP [42].
It has been shown that urea with NBPT can effectively suppress the peak N2O emission flux caused by N fertilizer loss and reduce N loss [43,44]. Our results also confirmed this view, as urea with NBPT incubation suppressed the peak N2O emission flux and significantly reduced cumulative N2O emissions (Fig. 4). In contrast, some studies found that treatment with urea + NBPT (urease inhibitor) did not reduce direct N2O emissions compared with urea alone [45]. Interestingly, some research has found that urea with the urease inhibitor NBPT has been shown to significantly reduce NH3 emissions compared with urea alone [46]. As an indirect source of N2O, the NH3 loss from urea is also a net potential N2O emission in the soil. More work is needed concerning NH3 volatilization losses after NBPT application rather than focusing on urea hydrolysis only. Effect of Freeze-Thaw Cycles on Soil N Transformation
and Nitrous Oxide Emissions
With more frequent freeze-thaw, urea with DMPP under freeze-thaw conditions (FDP) resulted in a lower soil NO3--N content (Fig. 2b), a lower net nitrification rate (Fig. 3c), and significantly lower cumulative nitrification (Fig. 3d) compared to continuous 25°C incubation (RDP). In addition, the application of urea under freeze-thaw cycling incubation (FUR) resulted in a lower rate of decrease in the soil ammonium nitrogen content (Fig. 2a), a lower rate of increase in the nitrate nitrogen content, and a significantly lower rate of net soil nitrification within 9 days of incubation compared to CK, but there was no significant difference in cumulative nitrification (Fig. 3). The results proved that obvious soil freeze-thaw cycles in the freeze-thaw season could significantly affect nitrogen transformation and critical ecological processes in cold areas. These results also provide strong evidence that urea with a nitrification inhibitor (DMPP) can inhibit soil nitrification during the freeze-thaw period [20, 47] and that urea application alone did not suppress cumulative nitrification under freeze-thaw cycle incubation, although it suppressed the soil nitrification rates. The mechanism for this phenomenon is not yet clear, and other experiments are needed for further study.
This experiment showed that the most significant peak in N2O emission flux was associated with the freeze-thaw cycle, and the freeze-thaw cycle incubation with urea alone resulted in a nearly 340% increase in the peak N2O emission flux (Fig. 4), which confirms that the freeze-thaw cycle leads to increased N2O emissions [48, 49]. We speculate that the disruption of soil aggregates during freezing, the release of their fixed nutrients and some reactive organic matter [50-52], and the death of soil microbes responsible for decomposition [53, 54] increase the soil matrix nutrients supplied for microbial use, thus promoting organic nitrogen mineralization and denitrification [55]. Most researchers concluded that denitrification is the dominant process responsible for N2O emissions during the freeze-thaw cycle, especially during the soil thawing period [56]. It is also possible that during the freeze-thaw cycle incubation, water changes from liquid to solid and is fixed in the soil pore crevices, resulting in a decrease in the soil oxygen content and an increase in anaerobic microbial activity, which promotes denitrification [57] and can also be used to explain the random forest results under the freeze-thaw cycle incubation. NO3--N was the most important factor controlling the soil N2O emission fluxes under freeze-thaw conditions (Fig. 5b).
Notably, we found that in the principal component analysis (Fig. 6), N2O emission fluxes were linearly and positively correlated with MBN and MBC, while in the random forest regression analysis, MBN and MBC contributed significantly to N2O gas emission fluxes under freeze-thaw conditions (Fig. 5). We speculate that this may be due to microbial death and decomposition resulting in elevated MBN and MBC in the freeze-thaw cycle, acting as nutrients and increasing the substrate used by denitrifying bacteria, resulting in enhanced denitrification [54]. During the initial freeze-thaw cycle, although microbial activity gradually increased, our incubation experiments were conducted in a confined indoor environment where the nutrient content of the soil matrix was not replenished and was gradually depleted, resulting in an increase in microbial activity at the beginning and a decrease in the later stages of incubation, so that N2O emissions generally tended to increase first and then decrease. We not only confirmed that the freeze-thaw cycle promoted N2O emissions, but we also found that N2O emission fluxes did not peak when nitrification/urease inhibitors were applied under the freeze-thaw cycle, suggesting that N2O emissions could also be suppressed by applying nitrification/urease inhibitors with urea under the freeze-thaw cycle.
Conclusion
In this study, we found that the freeze-thaw cycles inhibited the nitrification rate of the soil, which supported the hypothesis that the freeze-thaw changed the nitrogen transformation process of the irrigated desert soil. Furthermore, the freeze-thaw promoted N2O emissions, and in response to the addition of the DMPP/NBPT inhibitor to the soil, the freeze-thaw induced soil N2O emissions following urea application were mitigated due to inhibition. Our results support the hypothesis that the application of DMPP/NBPT inhibitors may lead to similar effects on soil N2O emissions during the freeze-thaw period. Overall, N2O emissions can be reduced by nitrogen dosing with DMPP/NBPT to reduce environmental pollution and nitrogen losses during the freeze-thaw period for agriculturally irrigated silt soil in the Minqin Oasis region.

