

Introduction
A gaseous particle that at high abundance levels poses a threat to the property, human life, and the environment is considered air pollution. Contaminants can come from both natural and man-made origins. The most harmful contaminants are atmospheric particulate matter (PM) and the gasiform contaminants volatile organic compounds (containing benzene), formaldehyde (HCHO), carbon monoxide (CO), nitrogen dioxide (NO2), and sulfur dioxide (SO2) [1-4].
Asian countries (Bangladesh, Pakistan, India, and Nepal) had been included among the leading 10 countries with the highest PM2.5 levels [5]. Over the previous two decades, the concentrations of major pollutants in the atmosphere including SO2, O3, and NOx have also increased dramatically in Pakistan [6, 7]. Lahore seems to be the most contaminated city in the country of Pakistan, rising at a level of 4% each year. That is a significant potential hazard associated with the heavily contaminated Hudiara Drain, where roughly 600 industries discharge the effluent [8].
The detection of 4 major contaminants in the atmosphere near the residential areas named PM2.5, PM10, total volatile organic compounds (TVOCs), and formaldehyde (HCHO) is important [9]. There are two main types of particulate matter which include PM2.5 and PM10. Because it may reflect and absorb specific wavelengths from daylight, PM10 is also causing poor vision [10]. PM2.5 is now a prominent contaminant in urban air and has received great consideration because of its negative impacts on public health and climate change. The compounds with a greater vapor pressure but limited solubility in water are referred to as total volatile organic compounds (TVOC) and are mostly generated through anthropogenic sources within metropolitan regions [11]. The quantities of VOC in indoor areas are almost always considerably greater than in outside ones. This would be impacted by the condition of construction products, as well as individual actions [12]. Formaldehyde is utilized in home items and the manufacturing of construction products. As a result of regular metabolic activities, humans can generate minor concentrations of formaldehyde as well. Average rates from 5 to 15 parts per billion are common within central and northern Europe, as well as the United States [13].
These pollutants are triggered by naturally produced events which include sandstorms in vast areas of open terrain and forest fires in dry weather [14]. Furthermore, anthropogenic factors seem to be the most significant contributors to atmospheric contamination nowadays [15]. It’s mostly caused by fossil fuel usage and industrial facilities, modern farming, illegal dumping, and the transportation sector, and may result in chronic health conditions in humans [16]. These contaminants have a poisonous impact on the pH of the soil and decrease photosynthetic activity [17]. This research aims to investigate and understand changes in atmospheric pollutants in the study area with a particular focus on the residential areas and local drains.
Materials and Methods
Study Area
Lahore, a city with a significant population in Pakistan, is situated within latitudes 31°15′ to 31°45′ as well as longitudes 74°01′ to 74°39′, spanning a considerable region. It is the provincial capital of the vast municipality known as Punjab. However, the region faces pressing challenges due to busy transportation, industrial activity, and resulting poor air quality, adversely impacting both human health and the urban environment [18]. Lahore’s climate is subtropical, featuring five distinct seasons: hot summers, foggy winters, pleasant springs, dry autumns, and monsoon rains [19]. The urban population in the Lahore district constitutes 82 percent of the total, leaving the remaining percentage residing in rural areas [20]. The escalating concern over various health risks, particularly polluted air, has become a critical issue for Lahore’s residents, necessitating immediate attention as the city continues to grow and evolve.
Sampling
In this study, we utilized a portable air quality sampling device, specifically the IGERESS air sensor, renowned for its versatile capabilities in detecting PM2.5, Total Volatile Organic Compounds (TVOC), PM10, and formaldehyde (HCHO). Before each field sampling campaign, the instrument underwent precise calibration. A notable feature of this tool is its alert system, designed to activate when pollutant concentrations exceed predefined thresholds. Ambient air sampling commenced at the outset of March, coinciding with the arrival of the spring season. A detailed sampling map was essential for pinpointing each field ID or specific sampling location. This task required employing an air pollution field data sheet and a reliable pen to meticulously record readings and other pertinent data. The initial step involved reaching each designated sampling site with care.
Upon arrival at a site, the device was held above the ground surface (~ 1 meter) for the measurements. Subsequently, recorded pollutant values were meticulously transcribed onto the datasheet. Each sampling interval lasted roughly 15 to 30 minutes. Occasionally, the instrument emitted discernible beep alerts, signifying that pollution levels had exceeded predefined standard thresholds. A total of 50 samples were meticulously gathered within a 200-meter radius. The sampling locations included a diverse range, such as residential areas, the Hudiara drain, industrial facilities, a university campus, banking institutions, supermarkets, restaurants, roads, and sports facilities.
In-vitro Cytotoxicity Evaluation
Cytotoxicity of airborne particulate matter, diameter (PM2.5), and PM10 was measured against in-vitro red blood cells (RBCs) with slight modification [1]. In this method, fresh human blood (4 mL) was collected, and using phosphate buffer saline and centrifugation, the red blood cells (RBCs) were purified and suspended in phosphate buffer saline (PBS~7.4.) and cell count 7.068 x 10⁸ cells/mL was maintained for hemolytic/ cytotoxicity assay. The air sample was collected using an IGERESS air sensor (portable air quality sampling device), a piece of filter paper containing different particulate (PM2.5 and PM10) was dissolved in 1 mL ultrapure water, vortex the Eppendorf and then filter the contents. The filtrate containing dissolved particulate is used for in-vitro cytotoxicity study. A 50 µL sample containing suspended particulate was treated with 175 µL red blood cells (RBCs) suspended in phosphate buffer saline. The entire reaction mixture was incubated for 30 minutes at 37°C. After the initial 10 minutes of incubation, agitation was introduced. Subsequently, the tubes were transferred to an ice bath for 5 minutes and then subjected to centrifugation at 1310×g for 5 minutes. Following centrifugation, 100 µL of the supernatant was carefully extracted from each tube and diluted with 900 µL of chilled PBS. To minimize mechanical blood lysis, all Eppendorf tubes were consistently kept on ice after dilution. A 200 µL aliquot from each Eppendorf was dispensed into separate wells of a 96-well plate. In each assay, 0.1% Triton X-100 served as the positive control, while phosphate-buffered saline (PBS) was employed as the negative control. The absorbance readings were recorded at 576 nm using a BioTek μ Quant microplate reader (BioTek, Winooski, VT, USA). The percentage of red blood cell (RBC) lysis was determined using the relationship depicted in Equation (1).
Data Analysis
Both MS Excel and GIS (Geographic Information System) software were used in analyzing environmental data, specifically the concentrations of pollutants at different sampling points [21]. On the other hand, GIS software is highlighted for its ability to create detailed maps, drawing from various data sources such as digitized information, databases, aerial photography, GPS testing, scanned data, and remote sensing data [20].
Results and Discussion
Air Quality (PM2.5, PM10, TVOC, and HCHO)
Table 1 shows data regarding observed and measured parameters in the study areas The minimum value of PM10 was 19 μg/m3 and it was located in two areas, which are the University of Lahore and Hudiara Drain. The maximum value of PM10 was 228 μg/m3 and it was located at Lahore Ring Road. The average value of PM10 was 95.48 μg/m3 and the Standard Deviation value of PM10 was 63.65604 μg/m3. Querol et al. [22] reported PM10 levels (annual mean) ranging from 19 to 24 μg/m3 at regional background sites in the selected European cities with slightly higher levels ranging from 37 to 53 μg/m3 at kerbside sites. The minimum value of PM2.5 was 17 μg/m3 and it was located in two areas, which are the University of Lahore and Hudiara Drain. The maximum value of PM2.5 was 199 μg/m3 and it was located at Lahore Ring Road. The average value of PM2.5 was 82.92 μg/m3 and the Standard Deviation value of PM2.5 was 54.98973559 μg/m3. Zhang and Cao [23] carried out a long-term study of PM2.5 levels of one-year monitoring in 190 cities in China to be 61 μg/m3 on average. The minimum value of TVOC was 0.003 mg/m³ and it was located at Wyeth CHS. The maximum value of TVOC was 9.659 mg/m³ and it was located at Hudiara Drain. The average value of TVOC was 1.24174 mg/m³ and the Standard Deviation value of TVOC was 2.066653717 mg/m³. Varshney and Padhy [24] reported the TVOC levels in the ambient environment of the Urban Environment of Delhi to vary from 3 to 42 ppmv registering a wide temporal and seasonal variation. The minimum value of HCHO was 0 and it was located at Khayaban-e-Amin Society. The maximum value of HCHO was 0.476 mg/m³ and it was located at Hudiara Drain. The average value of HCHO was 0.0514 mg/m³ and the Standard Deviation value of HCHO was 0.080245796 mg/m³. Neamtiu et al. [25] determined the mean values of indoor and outdoor formaldehyde levels in the major cities of Romania in the range of 0.014-0.035 mg/m3.
Spatial distribution maps of measured pollutants are shown in Fig. 1 (a-d). Fig. 1(a) presents the spatial distribution map depicting PM10 levels in the Lahore region, situated in the Punjab province. In this PM10 map, a noticeable trend emerged, with higher concentrations observed on the eastern side compared to the western side. The university area and drain region exhibited the lowest values, benefiting from a cleaner environment and refreshing breezes. In contrast, the highest values were evident along roadways, attributed to heavy transportation, dusty roads, various shops, and vehicular traffic. The World Health Organization (WHO) set a stringent air quality standard of 45 μg/m3. However, the sampling results surpassed this limit, with 30 samples breaching the WHO standard, while 20 samples remained below it. Similarly, the air quality standard set by the Punjab Environmental Protection Agency (PEQS) was 150 μg/m3. Notably, 17 samples exceeded the PEQS standard, whereas 33 samples adhered to it. Areas with sample values exceeding both the WHO and PEQS standards pose higher health risks in comparison to regions where sample values fall below these standards. Ahvaz, a city in Iran, experiences the highest average yearly PM10 concentration, reaching 372 μg/m3. This has profound consequences on human health, radiation, agriculture, aviation, tourism, and the overall dust-related concerns in Ahvaz [26]. The investigation’s findings from 2018 revealed an average yearly PM10 level of 110 μg/m3 and a peak of 1447 μg/m3, significantly exceeding WHO recommendations by 7.3 and 32.2 times, respectively. Such high levels may result in a notable increase in cardiovascular and respiratory morbidity cases [27].
Table 1.
Field data showing various observed and measured parameters in the study area.
The PM2.5 distribution map in Fig. 1b) highlights levels in the study area. This PM2.5 map reveals a distinct trend in both the east and southwest directions. The lowest values persistently appear in the university and drain area, benefiting from a cleaner environment, reduced pollution, and a refreshing breeze. Conversely, the highest values are consistently observed near roadways, attributed to heavy transportation, dusty roads, varied shops, and vehicular traffic. The measured values surpassed the allowable limit, with 50 samples exceeding the WHO standard of 15 μg/m3. Similarly, the air quality standard set by the Punjab Environmental Protection Agency (PEQS) is 35 μg/m3. Notably, 34 samples exceeded the PEQS standard, while 16 samples adhered to it. Areas with sample values exceeding both the WHO and PEQS standards pose a higher health risk compared to regions where 43 samples fall within the standard limits. Shijiazhuang in China faces severe pollution due to its unique geographical and climatic circumstances, coupled with rapid development [28]. This research investigates PM2.5 levels during the pre-lockdown, lockdown, and unlocking phases across 10 significant cities in Maharashtra. Our findings reveal that PM2.5 levels were notably high during the pre-lockdown phase (January to March), sharply decreasing during the lockdown phase. Subsequently, during the unlocking phase, levels rebounded, exceeding the pre-lockdown levels due to the resumption of outdoor activities. In response to these unlocking circumstances, levels returned to their prior position and rose by 70% compared to the lockdown period.
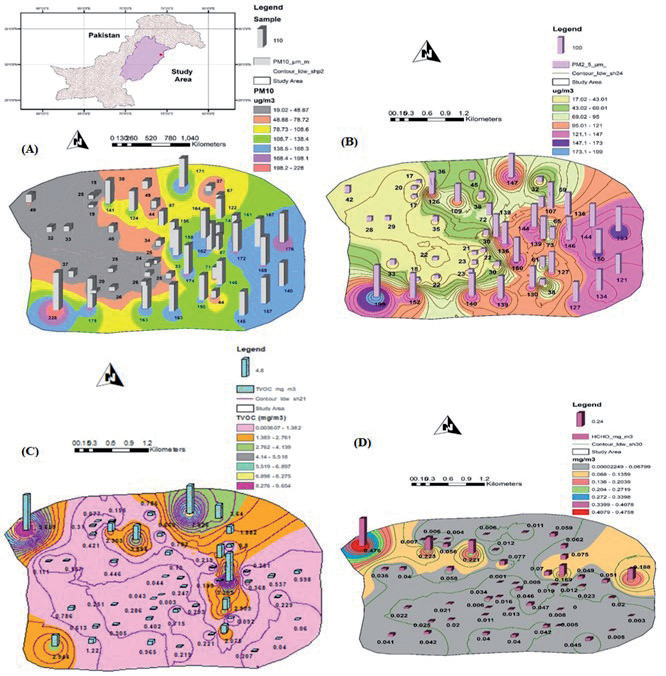
Fig. 1c) displays the spatial distribution map of TVOC levels across Lahore, within Punjab province. This map reveals a notable trend, with higher concentrations detected in the northwest direction, contrasting with the southeast direction. The lowest values are consistently found in residential areas, benefiting from a clean environment, reduced pollution, and favorable atmospheric conditions. Conversely, the highest values are concentrated near drainage areas, attributed to the strong odor from drain effluents and the dense fume emissions. The air quality standard set by the Hong Kong Special Administrative Region (SAR) government for TVOC is less than 0.6 mg/m³. However, the sampling results indicate that 20 samples exceeded this limit, while 30 samples remained within it. This presents a significant health risk, leading to potentially serious health issues. China reports elevated TVOC concentrations in urban and suburban regions, notably in cities such as Beijing, Tianjin, and Shanghai, which exhibit the highest TVOC levels. Key sources of atmospheric VOCs in China encompass vehicle emissions, industrial processes, solvent usage, fossil fuel combustion, fuel evaporation, rubber manufacturing, LPG utilization, petroleum industry, and coal burning [29, 30]. Additionally, in India, an investigation highlights the impact of lockdown measures on VOC levels in the Punjab metropolitan region. Findings indicate a substantial decrease in overall TVOC levels across all reporting areas before, during, and after the pandemic. When compared to the years preceding the lockdown, the average TVOC concentration dropped by 43% across all monitored stations. During the outbreak, Patiala recorded a higher air pollution ratio (2970 mg/m3), potentially attributed to automobile emissions [31].
Fig. 1d) illustrates the spatial distribution map of HCHO levels in Lahore. The lowest value is observed in residential areas, benefiting from fresh air, a clean atmosphere, and abundant greenery. Conversely, the highest value is concentrated in the drain area, attributed to the foul smell, heavy effluents, and chemicals emitted from the drain. The air quality standard set by the Hong Kong Special Administrative Region (SAR) government for HCHO is below 0.1 mg/m³. However, the sampling results reveal that 5 samples exceeded this limit, while the remaining 45 samples remained within it [32]. This suggests a low health risk exposure due to the minimal number of samples surpassing the limit. Primary HCHO contributes significantly to atmospheric HCHO concentrations, accounting for up to 50% regularly during the night and up to 80% in the morning [33]. Beyond its negative impact on human health, formaldehyde plays a crucial role in secondary organic aerosols and tropospheric ozone. Furthermore, HCHO exhibited a comparable trend with elevated levels during both dry and rainy seasons for each of the three population categories. The findings underscore the need for mitigation measures to counteract the adverse effects on individuals affected by HCHO emissions [34].
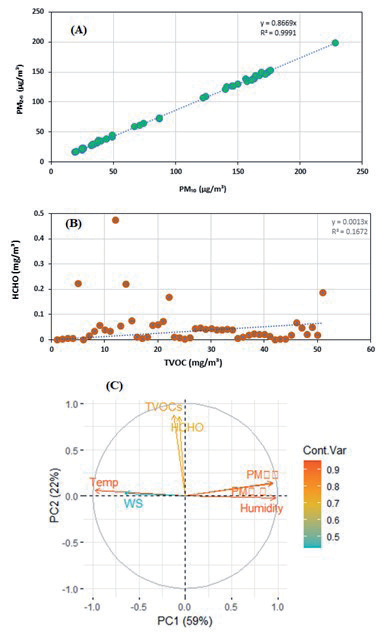
Fig. 2 (a and b) showed scatter plots that depict the relationships among four pollutants: PM10, PM2.5, TVOC, and HCHO. In essence, the respective correlation equations provide valuable insights into the connections between these pollutants. While the first two pollutants, PM10 and PM2.5, exhibit highly predictable and strongly correlated behavior, the correlation between TVOC and HCHO is much less pronounced, indicating a more complex and potentially non-linear interaction between these two pollutants.
The outcomes of the Principal Component Analysis (PCA, Fig. 2c) indicated the presence of two distinct groups within the measured parameters. These groups are categorized as follows: one group comprises Total Volatile Organic Compounds (TVOCs) and Formaldehyde (HCHO), while the other centers around Particulate Matters (PMs). The PCA analysis highlights the significance of two principal components, namely PC1 and PC2. PC1 encapsulates a substantial 59% of the overall data variability, while PC2 contributes an additional 22%. Together, these two components collectively account for a noteworthy 81% of the total data variation. The interpretation assembled from the analysis aligns well with the observed trends. The first group, prominently featuring TVOCs and HCHO, emerges as a result of environmental conditions affected by drainage-related factors. This implies that elements linked to drainage systems, such as potential pollutants or chemicals, exert a significant influence on this particular group. Conversely, the second group’s patterns can be attributed to road and construction activities. This suggests that variations within this group predominantly arise from factors associated with roads and construction work, including the generation of dust and particulate matter from these operational contexts. This analytical approach is particularly beneficial in environmental investigations as it aids in identifying key sources of fluctuations in measured parameters and offers a deeper understanding of potential environmental impacts. The hotspots identified in the urban areas required further detailed investigation to manage air quality in the study area.
Cytotoxicity Against Red Blood Cells (RBCs)
Cytotoxicity of airborne particulate matter, PM2.5 and PM10, was measured against in-vitro red blood cells (RBCs) with slight modification [1]. The results revealed that different particulates having particle sizes around 2.5-micron showed 37.5±2.8 cell lysis. Only short-term exposure for 24 hours with these particulates having a size of 2.5 microns, the following medical consequences are possible: premature mortality, increased hospital admissions for heart or lung causes, acute and chronic bronchitis, asthma attacks, and respiratory symptoms [35]. PM10, or particulate matter with a diameter of 10 micrometers or less, predominantly originates from various sources such as dust generated at construction sites, landfills, and agricultural activities. Other contributors include wildfires, burning of brush and waste, industrial emissions, wind-blown dust from open areas, as well as pollen and bacterial fragments. Notably, cellular toxicity against PM10 has been observed, resulting in a significant cell lysis percentage of 27.32±3.54. Short-term exposure to PM10 has been conclusively linked to the exacerbation of respiratory conditions, notably asthma and chronic obstructive pulmonary disease (COPD). On the other hand, the implications of long-term exposure to PM10 are not fully elucidated, although multiple studies suggest an association between prolonged exposure and increased respiratory mortality. Further research is required to comprehensively understand the long-term effects of exposure to PM10 on respiratory health [35].
Conclusions
In summary, the concentrations of major atmospheric pollutants were assessed in various locations: residential areas, drain areas, and roadside sites. The findings revealed that a significant number of samples exceeded the air quality standards set by both the WHO and the PEQS. Specifically, for PM10, 17 samples out of 30 exceeded the recommended limits, indicating higher risk exposure in these areas. Similarly, for PM2.5, 34 samples out of 50 exceeded the standards, indicating an even greater risk of adverse health effects. Regarding other pollutants, the standards for TVOC set by the Hong Kong Special Administrative Region government were not met, as 20 samples exceeded the specified limit of less than 0.6 mg/m³. This poses a serious health risk. However, the standard for HCHO (formaldehyde) was exceeded in only 5 samples out of the specified limit of less than 0.1 mg/m³. The cytotoxicity analysis of PM2.5 and PM10 was performed and the findings revealed a significant toxicity to the RBCs, which caused health risks in the residents of the area. Hence, it is crucial to raise awareness about air pollution and its consequences. This can be achieved through various campaigns, advertisements, multimedia, and news dissemination. People need to be familiar with and adhere to the WHO and PEQS air quality standards to prevent exceeding the limits. Implementing mitigation measures is essential to reduce air pollution. This involves adopting modern technologies in industries and transportation systems and controlling excessive urban transportation. Other specific recommendations include increasing the number of trees and vegetation cover to mitigate atmospheric pollution and promote environmental purity.

