

Introduction
The development of clean and renewable energy sources such as biomass, solar, and wind has led to the gradual depletion of main sources of fossil fuel energy, such as natural gas, oil, and coal, in recent decades. As a result, biomass conversion into biofuels has become one of the most important aspects of renewable energy for producing bioethanol and biodiesel from cultivated plants [1]. Microalgal-based biofuels have come to the fore as a potentially viable substitute to replace fossil fuels to attain energy security and environmental sustainability [2]. These tiny aquatic plants called microalgae are naturally found in wastewater. These fast-growing organisms (doubling in as little as a week or two) have a taste for nutrients, making them ideal candidates for wastewater treatment. Properly designed and operated systems using microalgae can potentially remove these nutrients from wastewater in a relatively simple setup. Microalgae accomplish this feat in two ways: either by using the organic matter in wastewater as fuel for their growth, or by directly absorbing the nutrients into their cells. It is important to note that high pH levels, common during algae treatment, may cause some ammonia to escape from the solution [3]. Many previous studies have shown that microalgae in wastewater treatment systems are considered a biorefinery strategy [4] due to their uncomplicated cell structure, faster growth rate, and higher lipid content compared to conventional oilseed crops [2]. Microalgal-based wastewater treatment offers several economic and environmental benefits beyond nutrient removal. Operational costs can be reduced due to the streamlined process. Furthermore, the microalgal biomass, rich in assimilated nitrogen and phosphorus, can be valorized as a biofertilizer, creating a valuable product from the treatment process. Additionally, the treated effluent is oxygenated, improving its environmental impact when discharged into water bodies. Following wastewater treatment, the harvested algae can be further utilized for biofuel production or co-digested with sludge to enhance biogas generation at treatment plants. These downstream applications can generate revenue for the treatment facility, contribute to green energy production, and ultimately reduce the plant’s carbon footprint [5]. The most expansive microalgae species used for wastewater treatment are Spiruline [6], Botryococcus [7], Chlorella [8], and Scenedesmus [9]. Interestingly, several algae species habitually store between 50 and 60% of their dry weight as fat. This percentage has increased due to adaptation to different environmental and nutritional stress conditions [10]. However, it is important to note that stress-induced lipid accumulation usually leads to decreased biomass productivity [11]. Developing the right procedure for the industrial production of biofuels requires an understanding of the chemical and physical characteristics of microalgae. In this context, according to Yu et al. [12], lipid-rich microalgae may provide third-generation biofuels and chemicals in the future. In general, microalgae typically produce various types of lipids, such as wax esters, hydrocarbons, sterols, neutral and polar lipids, and prenyl derivatives including quinines, tocopherols, terpenes, and carotenoids, and pyrrole derivatives like chlorophylls [13]. C. pyrenoidosa is one of the microalgae strains that shows the most promise for treating wastewater and producing biofuel and platform chemicals [14]. Therefore, the main objective of this study is to evaluate the biomass of C. pyrenoidosa that can be used as feedstock for biofuels in terms of its chemical, microbiological, and biochemical properties.
Materials and Methods
Microalgae Strain preparation and Cultivation conditions
The Chlorella pyrenoidosa microalgae strain is used in this study, and the culture expansion was first processed in the laboratory. Chlorella pyrenoidosa was cultured in 500 ml of autoclaved agar media (BG11) in 1000 ml Erlenmeyer flasks and boosted in three 1000 ml conical flasks during the sterile inoculation process. The composition of nutrient per liter BG 11 medium was as follows: 0.001g of C10H16N2O8, 0.006 g of C₆H₈O₇, 0.02 g of Na2CO3, 0.036 g of CaCl2H2O, 0.075 g of MgSO47H2O, 0.04 g of K2HPO4, 1.5 g of NaNO3, and 1 ml of a solution containing trace elements with the following composition (g/L): 0.0494 of Co(NO3)26H2O, 0.079 of CuSO45H2O, 0.39 of NaMoO42H2O, 0.222 of ZnSO47H2O, 1.81 of MnCl24H2O and 2.86 of H3BO3. Every culture was placed in a closed culture that had red and blue LED lights installed. Uninterrupted air bubbling was used to mix the cultures, and the temperature was kept constant at 25ºC. The suspension was then added to wastewater in an open raceway pond that had been detailed in previous research [15].
After growing in wastewater, the biomass of C. pyrenoidosa was collected using a centrifuge for 5 minutes at 10,000 rpm. After collection, the biomass was twice cleaned with distilled water and then left to dry overnight in an oven at a temperature of 80ºC.
Ultimate Analysis
The ultimate composition of C. pyrenoidosa was carried out using a CHNS/O Elemental Analyzer (PerkinElmer®: 2400 Series II). A tin capsule containing about 1 mg of the sample was weighed before being put inside the automated sampler. For analysis, the temperature was set at 1000ºC. As vector gases, helium, nitrogen, and oxygen were employed. Using the Dulong formula [16], the higher heating value (HHV) of the biomass of C. pyrenoidosa was determined from the final analytical results as follows: 0.3383 × C + 1.443 × H − 0.1804 × O + 0.0942 × S
Concentration of Mineral and Heavy Metals in Algal Biomass
One gram of dried Chlorella biomass was analyzed to determine the mineral and heavy metal content using the method of inductively coupled plasma atomic emission spectrometry (ICP-AES) using the procedure described by Khani et al. [17]. The sample preparation involved microwave digestion. Specifically, the biomass was digested in a Teflon capsule with 10 ml of 65% nitric acid and 0.5 ml of hydrogen peroxide for 40 minutes. After digestion, the resulting solution was filtered through a 45-micrometer filter. The filtrate was then diluted to a final volume of 40 ml with doubly distilled water before analysis.
Determining Lipid Content
A modified method of Bligh and Dyer’s method was used to extract total lipids from algal biomass [18]. A 15 ml test tube containing 50 mg of dried algal biomass was filled with 2.0 ml of chloroform, 4.0 ml of methanol, and 1.6 ml of water. The result solution was mixed for approximately 30 seconds. Subsequently, 2.0 ml of water and 2.0 ml of chloroform were added to the test tube, and then mixed for 30 seconds. Next, the test tubes were then centrifuged for 10 minutes at 5000 rpm. After that, using a pipette, remove the top layer and transfer the extracted lipids contained in the bottom chloroform phase into a 30 ml culture tube. The same process was used twice more to extract the solid material that remained at the bottom of the extraction tube. The chloroform phases were combined and evaporated in a rotating evaporator until the production of dried lipids. The lipid content was calculated after measuring the total lipids using gravity.
Scanning Electron Microscopy of Algal Biomass
For their morphological studies, the dried biomass of C. pyrenoidosa and the calcined biomass at 500ºC and 1200ºC were screened using ProX SEM (Scanning Electron Microscopy Phenom). Utilizing energy dispersive X-ray (EDX) spectroscopy, the composition of the calcined biomass was examined. To reduce the surface’s electron charging impact, the samples were dried and placed on PELCO TabsTM Carbon Conductive Tabs, Double Coated.
FTIR Analysis
Attenuated total reflectance (ATR) spectra were obtained using an Agilent Cary 630 FTIR Spectrometer, which was equipped with a diamond crystal ATR reflectance cell and a DTGS detector. The spectra were scanned across the range of 4000 to 400 cm−1 with a resolution of 4 cm−1. Approximately 4-6 mg of dried algal biomass was placed on the crystal surface and pressed onto the crystal head. Prior to each sample scan, background correction scans of ambient air were conducted. The spectroscopic software Spectrum (Micro lab) was used to record the scans, which were further corrected for ambient air. The diamond ATR was cleaned with ethanol between samples.
Thermogravimetric Analysis
This parameter was performed using the TA Instruments DSC SDT Q600 Thermogravimetric Analyzer (TGA). To reduce the impacts of mass and heat transmission during the process, particles smaller than 20 µm were used after the algal biomass was sifted. 12.0550 mg of dried C. pyrenoidosa biomass was dispersed in an alumina crucible. The pyrolysis process was carried out at ambient temperature and gradually increased to 900ºC at a rate of 10ºC/min. A flow of high-purity nitrogen (99.99%) at a rate of 100 ml/min was used as an inert-gas to displace air during the process, avoiding undesired oxidation in the biomass. During pyrolysis, weight loss was recorded according to temperature. The rate of weight loss in biomass (dx/ dt) was recorded as a derived thermogravimetric curve (DTG).
Results and Discussions
Ultimate Analysis
Table 1 shows the results of the ultimate analysis and the higher heating value of C.pyrenoidosa. According to these results, the proportions of carbon, hydrogen, nitrogen, sulfur, and oxygen in C.pyrenoidosa in this study were 49, 7.06, 7.8, 0.65, and 35.49%, respectively. These compositions are similar to the previously reported data by Chen et al. [19]. As indicated in Table 1, Sagarssum sp and Ulva-prolifera have higher levels of oxygen and lower levels of carbon content in comparison to our microalgae. The high carbon content of the microalgae biomass makes it highly thermochemically promising for the manufacture of biofuels. In contrast, for biofuels with high energy density, a high level of oxygen is not a preferred characteristic. A low nitrogen and sulfur content in the microalgae biomass is highly desirable for the production of environmentally friendly biofuels. The ratios of H/C and O/C of C. vulgaris were 0.144 and 0.724, respectively. The nitrogen content in C.pyrenoidosa was relatively high (7.8%), as compared to other microalgae strains such as Sagarssum sp, U.prolifera, and Chlorella vulgaris at 0.35, 3.00, and 6.01% [20-22], respectively, though not as high as observed concentrations in C.pyrenoidosa at 8.03% [23]. The biomass’s HHV was measured at 20.44 MJ kg−1, which was higher than the results of previous studies that were released. This can be explained by the higher levels of carbon and hydrogen present in C.pyrenoidosa. According to Illman et al. [10], a gain in higher heating value in microalgae is not related to changes in other cellular constituents, such as proteins and carbohydrates, but rather to an increase in lipid content.
Concentration of Mineral and Heavy Metals in Algal Biomass
Mineral analysis of microalgae biomass also provides valuable information for microalgae culture in terms of nutrient requirements. According to Valverde (2014) [24], the zinc, aluminum, and sodium concentrations are lower than those found in our study. Similarly, Nannochloropsis contain higher amounts of manganese and iron than C. pyrenoidosa [24]. The results show that the amount of mercury in C. pyrenoidosa (0.154 ppm) was negligible as compared to Scenedesmus almeriensis (80 ppm). The results summarized in Table 2 show that the concentration (ppm) of Chrome, Plomb, Cadmium, Arsenic, and Nickel in the biomass were 1.67, 23.59, 1.55, 1.84, and 5.1, respectively.
Table. 1.
Ultimate analysis of microalgae.
Scanning Electron Microscopy of Algal Biomass
The characteristics of algal biomass depend on the harvesting technique, environmental conditions, propagation medium, and cultivation period. SEM image showed a spherical morphology for the sample. In a study conducted by Moreira et al. [25], it was found that Chlorella pyrenoidosa displayed a consistent spherical morphology, with particle sizes ranging from 14.13 μm to 123.4 μm and a median size of 38.84 μm. Ponnuswamy et al. [26] reported that C. vulgaris was unicellular microalgae green in color and spherical in shape.
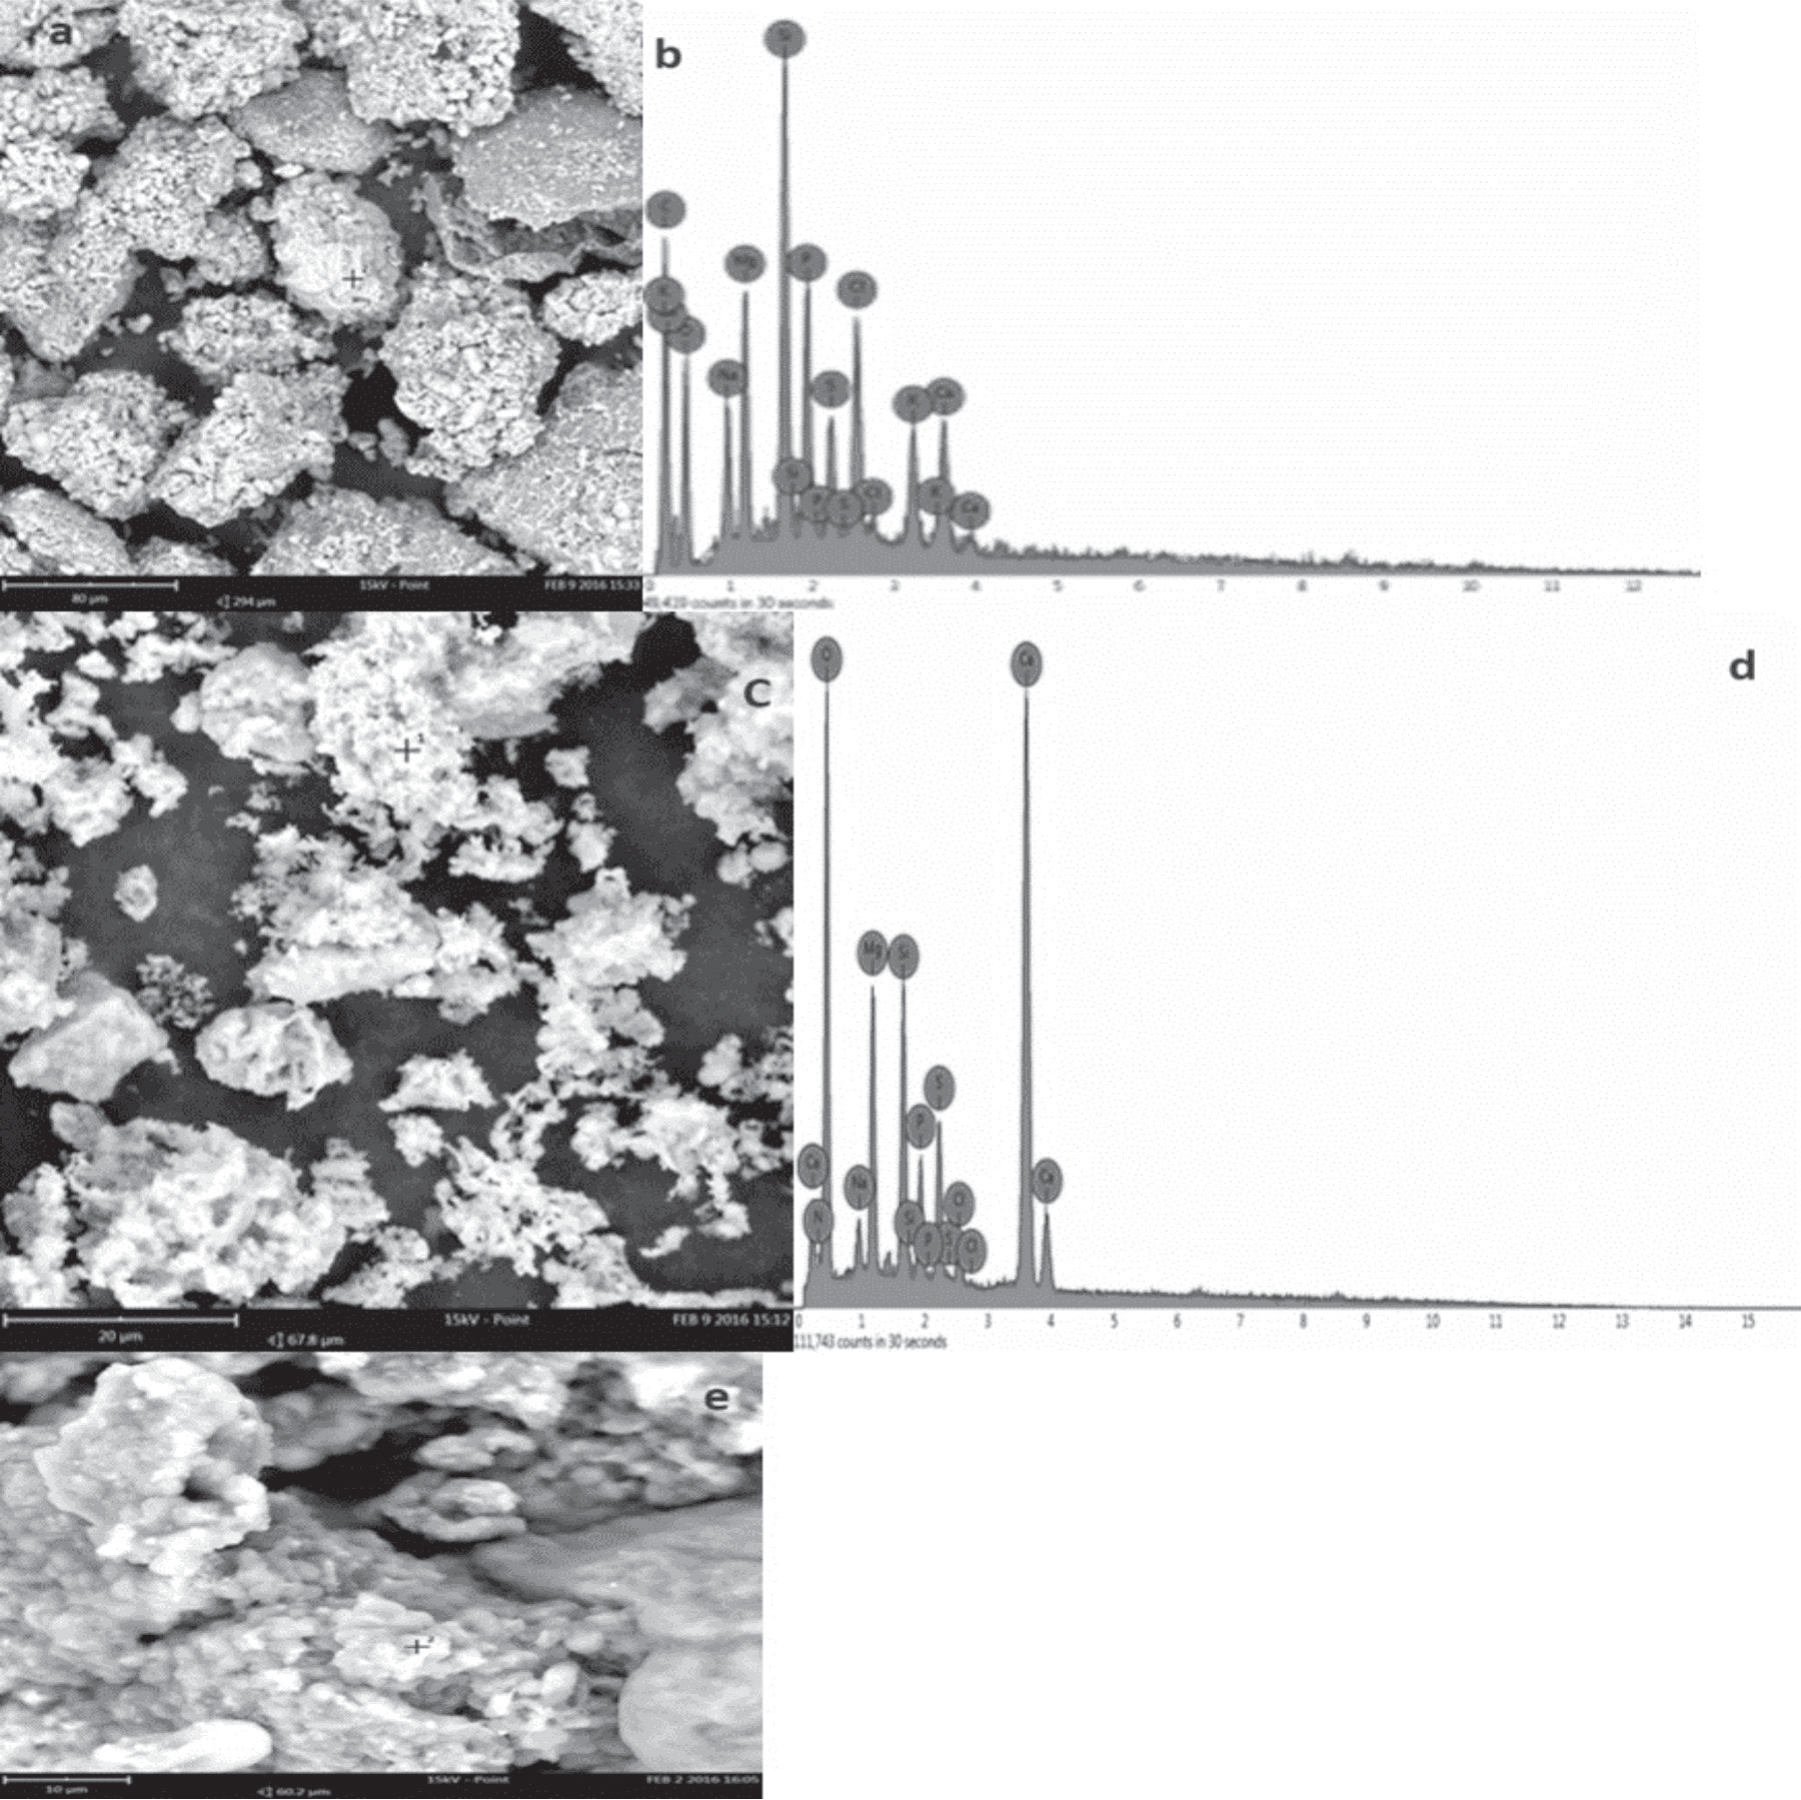
The form of shrinkage of the particles shown in Fig. 1 resulted from dehydration of C. pyrenoidosa during the drying process (calcination at 500ºC). From Fig. 1, the EDX spectrograms of C. pyrenoidosa biomass calcined at 500ºC give an approximate composition in (weight%): 2.3 of sulfur, 2.9 of potassium, 3 of sodium, 3.5 of calcium, 4.2 of magnesium, 4.3 of phosphorus, 4.5 of chlorine, 6.3 of silicon, 21 of oxygen, and 48 of carbon. Scanning electron microscopy of biomass calcined at 1200ºC shows a representative SEM image of algal ash. The ash residue contains flakes as grains and some particles with irregular shapes (Fig. 1), the chemical composition is shown in the EDX spectrograms (Fig. 1), the inorganic elements present in the ashes were (Si, Mg, Ca, O, P, Cl, Na, N, S, P); these elements are present in the form of metal oxides such as SiO2, CaO, MgO, NaO2, P2O5, SO3.
Lipid Content
The lipid profile can provide information for research on biofuels, such as the selection of microalgae strains and the enhancement of conditions for growth and microalgae extraction. According to several authors, a variety of factors, including nutrient conditions like the concentrations of C and N in the medium, the growth period, the physiology of the microalgae, and environmental conditions like temperature and salinity, can have a significant impact on lipid content. Additionally, the extraction yield can vary depending on the solvents and method used [27]. Due to their high rapid growth and lipid productivity, microalgae such as Nannochloropsis sp, Scenedesmus sp, and Chlorella sp are considered a promising source for the production of biofuel [28].
Therefore, many studies have been carried out to enhance the microalgae’s lipid productivity and production efficiency [29]. As shown in Table 3, the lipid content in C.pyrenoidosa was relatively high (23.2%), as compared to other microalgae strains such as Chlamydomonas reinhardtii, Chlorella sp, Dunaliella bioculata, and Scenedesmus quadricauda at 6, 16.5, 8 and 1.9%, respectively, though not as high as the observed content in Amphora coffeaeformis, Dunaliella salina, and Pavlova salina.
Table. 2.
Concentration of minerals and heavy metals in microalgae.
Infrared Spectrum
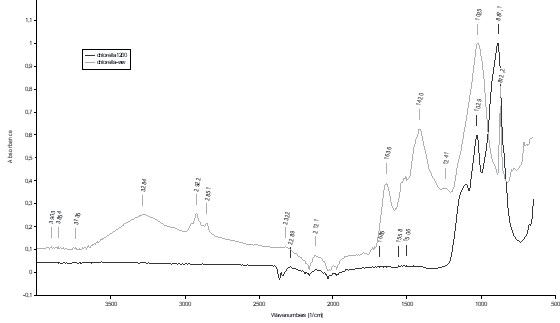
The FTIR spectrum of raw Chlorella pyrenoidosa and their residue is shown in (Fig. 2) with bands assigned according to literature [36]. As illustrated in Fig. 2, a total of eleven bands have been detected over the entire range number (4000-400 cm-1), each peak having a functional group. These bands primarily represent the cellular components such as carbohydrates, proteins, and lipids; a peak at 3277 cm-1 indicates that a hydroxyl group’s OH stretching and NH stretching in proteins. The band located at 2921 cm-1 is associated with asymmetric and symmetrical elongations CH2 groups. The band at 2857 cm-1 is assigned to the elongation (CH2), (CH3) of methyl and methylene groups [37]. The band between 2108 cm-1 and 2334 cm-1 could be assigned to CO2 vibration mode, the band at 1792 cm-1 comes from the symmetrical elongation of the C = O groups of the lipid and fatty acid esters. The symmetrical elongation of the C = O groups of the protein amides I induces a band around 1639 cm-1 [36]. The band at 1529 cm-1 is attributed to the symmetrical elongation (CH) of protein amides II and to the deformation of the groups (NH). Elongation of the COO, CH2, and CH3 groups of the protein DNA forms a band at 1416 cm-1. The band located between 1020 and 957 cm-1 assigned mainly to the symmetrical elongation (Si-O) of siloxanes, to the elongation (Si-OH) of silanols, to elongation (CO), and to elongation (P = O) RNA and DNA. The band between 866 and 839 cm-1 is attributed to the asymmetric deformation of the silanol group (Si-OH) and the cell wall (polysaccharides). The infrared spectra of the biomass residue after calcination at 1200ºC give three peaks. After calcination, the compounds present are mostly inorganic. The band at 1029 cm-1 comes from the asymmetric elongation of Si-O-Si. The stretching associated with the peak at 1112 cm-1 indicates the presence of sulfates because they have a characteristic peak in this region. The presence of calcium carbonates (CaCO3) is characterized by a peak between 1495 and 1410 cm-1, and a mean peak between 885 and 870 cm-1. This was mainly in accordance with EDX analysis.
Table. 3.
Lipid content of microalgae species.
Thermogravimetric Analysis
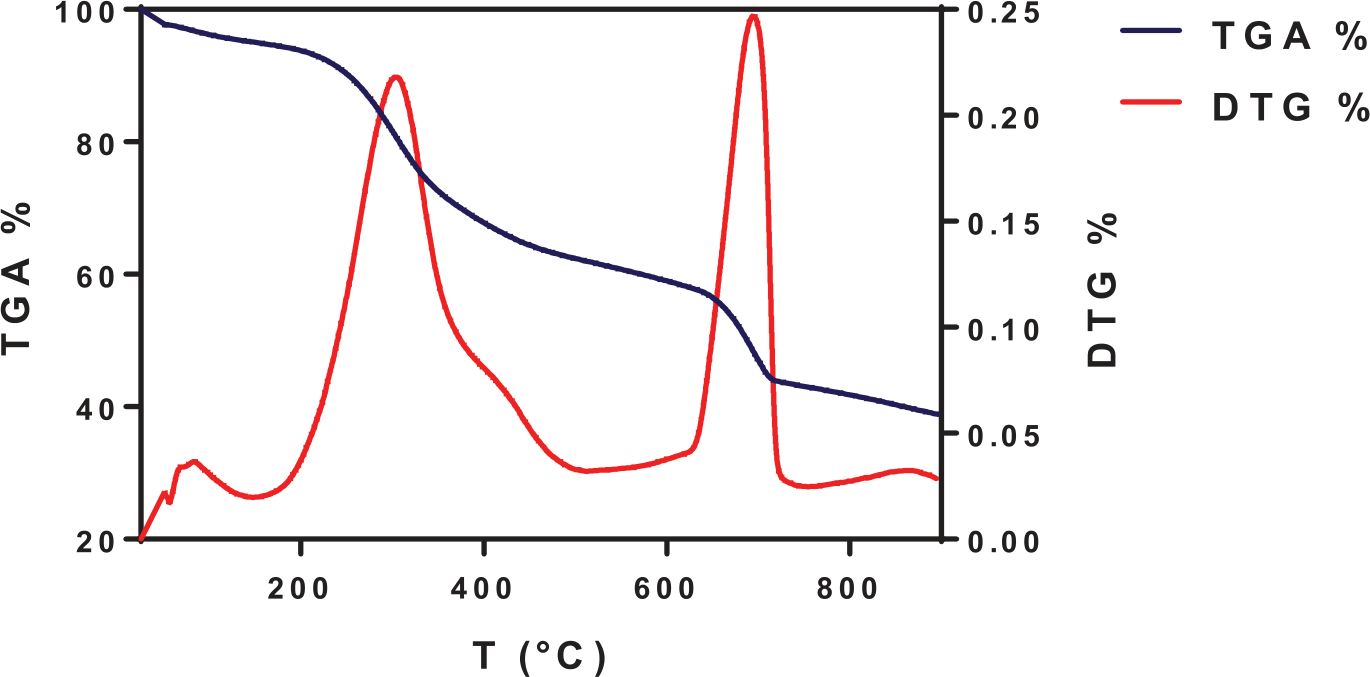
The results of biomass weight loss (TGA) and its corresponding rate (DTG) are illustrated in Fig. 3. According to the TGA curves for C. pyrenoidosa biomass sample, the results indicated that there were three distinct pyrolysis stages. The initial stage of pyrolysis took place at an ambient temperature of 144.95ºC. This weight loss mainly results from the process of dehydration, which involves the removal of both intracellular and externally-bound water [38]. The type and storage of biomass can have a significant impact on the moisture content of the biomass. The choice of biomass conversion process is significantly influenced by the moisture content. High-moisture-content biofuels are more suitable for biochemical techniques, whereas low-moisture biofuels are better suited for thermal conversion processes [39]. It is proposed that in a biorefinery design, the residual heat from the combustion of the pyrolysis gas can be used to dry the incoming biomass in order to decrease its moisture content if needed. The moisture content in C. pyrenoidosa in this study is 4.87%. Similarly, Ma (2020) [20] and Arif (2021) [23] have reported that Ulva prolifera and Chlorella sp have moisture contents of 11.00% and 7.29%, respectively. The main stage in this process is the second stage, characterized by the decomposition and depolymerization of the organic substances of microalgae, including proteins, carbohydrates, and lipids. This study indicated that the second stage occurred from 145ºC to 767.8ºC. Approximately 57.13% weight losses were observed for C.pyrenoidosa. Similar results had been reported for some other microalgae species, such as 44.85% for Sargassum natans according to Wang et al. [40], 55.37% for C. vulgaris reported by Chen et al. [41], 55.6% for Chlorococcum humicola as mentioned by Kirtania et al. [42], and 68.79% for Saccharina japonica as found in the study by Kim et al. [43]. The generation of gases and liquid products during pyrolysis requires a high volatile content. The last stage (stage III) of pyrolysis was observed at 768ºC. During this stage, a very small amount of weight loss was observed. This is mainly the result of the decomposition of the carbonaceous substances retained in the solid residues [44]. After the pyrolysis process, the final residue for C.pyrenoidosa accounted for 38%. Solid residues are mainly composed of fixed carbon and ash [45]. Chen et al. [41], reported that the total residue of C. vulgaris was 44%.
Conclusions
One of the most hopeful replacements for biofuel feedstocks is lipid and biomass derived from microalgae. According to the biomass characterization of C. pyrenoidosa, it was contaminated with two types of bacteria, namely Listeria grayi and Cellulomonas. sp. The final results of the ultimate analysis in this study indicated that microalgal biomass contains a high percentage of carbon (49%), and low nitrogen and sulfur, making it highly thermochemically promising and desirable for the production of environmentally friendly biofuels.

