

Introduction
As global climate change and sustainable development issues continue to heat up, the impact of urban land use on Carbon Emissions (CE) has gradually become a research hotspot in the fields of environmental science and urban planning [1–3]. As densely populated areas with concentrated economic activities, the land use pattern of cities directly affects the scale and structure of energy consumption and CE. Traditional CE research focuses on industrial activities and energy consumption, but there is a lack of effective quantitative modeling and comprehensive research to analyze the factors affecting urban land use carbon emissions (LUCE). In recent years, the Log Mean Divisia Index (LMDI) model has attracted attention due to its wide application in energy economics, and the model shows unique advantages in analyzing the driving factors of energy consumption and CE because of its high decomposition accuracy and the imperfect residual terms [4–6]. Therefore, to better analyze the CE influencing factors of urban land use, the study takes Shenyang city as an object, and on the basis of analyzing the time series characteristics of its LUCE, it improves the LMDI model through the limit method to analyze the influencing factors of the city’s LUCE, with the aim of providing a more scientific and empirical basis for urban layout and low-carbon development. Through this approach, the study not only enriches the theoretical framework of the relationship in the LUCE, but also provides new perspectives and tools for the formulation of urban sustainable development strategies. The study has four parts. The first part is a literature review, which introduces domestic and international scholars’ research on urban CE and LMDI modeling. The second part conducts research on the time-series characteristics of urban LUCE and the influencing factors. In the third part of the results analysis, the study specifically analyzes the LUCE time-series characteristics, influencing factors, and so on. The fourth part summarizes the research methodology and other contents and points out the research deficiencies and future research directions.
Related Work
High CE is a major issue for humanity today and in the future. One of the main causes of climate warming is land use change, which is mostly due to human activities. The analysis of LUCE in cities, which are the main areas of human activities, it is meaningful for low carbon development. Pan et al. In order to analyze the impact of urban growth and sprawl on GHG, they proposed the use of the interactive, spatially explicit socio-ecological system modeling methodology. Taking Stockholm County in Sweden as an example, the total emissions predicted by the designed strategy are larger than those in the official action plan, which is beneficial to mitigate the impact of 72% of the total emissions under the effect of the developed zoning policy [7]. Chuai and Feng examined the spatial distribution and influencing factors of the CE using a new methodology designed using big data, and the CE of the city of Nanjing was investigated. Regional differences and influencing factors were analyzed at 300 m high resolution. The CE intensity in the central city of Nanjing varies significantly, but is below that in peripheral industrial areas. The increase in ecological land use and the decrease in development land use contribute to CE reduction. Industrial structure adjustment and energy efficiency improvement are also key [8]. Wu et al. analyzed data from the Minneapolis-St. Paul metropolitan area uses the gradient advancement decision tree method in order to solve the relationship between the built environment and CE. The results show that three factors have the greatest impact on CE: job density, land use type, and distance to the nearest transit stop. These factors are only valid to a certain extent, providing insights for planners to realize environmental benefits [9]. Lauvaux et al. proposed a methodology for integrating a dense network of greenhouse gas sensors with science-driven building and street scales in order to more accurately estimate urban fossil fuel CE. The method estimates CE within 3% of actual values each year. Inventory emissions in Indianapolis are 35% lower than self-reported [10]. Ribeiro et al. In an effort to more accurately study the relationship between urbanization and CE, they propose a general framework that simultaneously considers population, area, and the interaction between the two. The results show that the framework greatly improves the characterization of emissions, revealing the coupled effects of population and density on emissions [11].
Yang et al. analyzed using the Kaya model and the LMDI method to understand the CE changes in fossil energy consumption in China. The results show that the CE from 2006-2018 presents four stages, with gross domestic product (GDP) per capita and energy efficiency as the main influencing factors, respectively. The measures help to reduce CE, but it still needs to actively deal with climate change [12]. Yao et al. established an exponential decomposition analysis-log-averaged Divisia index model in order to understand the spatial and temporal differences in water intensity in the Yangtze River Economic Zone. The results show that water intensity and industrial structure are the main and secondary factors. Provinces should comprehensively consider policies such as improving industrial water utilization efficiency and industrial structure adjustment [13]. Chun et al. To analyze the characteristics of CE in Henan Province, the study established a decoupling effort model based on the LMDI method. The CE in Henan was added from 2006 to 2011 and declined after 2011. Henan has achieved a shift from weak to strong decoupling. Energy intensity is a crucial factor in achieving decoupling [14]. Abbas et al. In order to assess the factors influencing energy consumption in Punjab, methods such as LMDI modeling were used. The results show that scale impacts are the main cause of high energy consumption but can be reduced by efficient intensification. Structural influences have no significant impact on energy use [15].
In summary, in the field of CE, although some scholars have discussed the study of the impact of CE and their environmental effects, fewer studies have been carried out from the perspective of different land utilization types, and only a single land use type has been explored. There is a need to increase the variety of land use types as a way to facilitate the analysis of the spatial characteristics of CE. Therefore, the study analyzes the LUCE of Shenyang city to explore its time-series characteristics and the influencing factors. In view of the good performance of the LMDI model in terms of the drivers of CE, the LMDI is applied in the study. Relative to previous studies, the study conducts CE analysis of multiple land use types to increase the variety of land use types studied.
Analysis of Factors Affecting Urban LUCE Based on the Improved LMDI Model
To understand the CE influencing factors of urban land use, the study improves the Kaya equation on the basis of analyzing the time-series characteristics of LUCE and combines it with the improved LMDI model to analyze the influencing factors.
Data Sources and LUCE Accounting Methodology
At the heart of global climate change and the energy crisis lies high CE, which is a common challenge for the contemporary and future world. The accumulation of greenhouse gases in the atmosphere stems mainly from changes in land use patterns caused by human activities [16–18]. In the process of land resources and energy use, China is under increasing pressure from CE. In this regard, to effectively study the influencing factors of urban LUCE, the study was carried out in the city of Shenyang. Located in the center of Liaoning Province, Shenyang is the capital city, and in terms of topography and geomorphology, its main landform is a plain with flat terrain. The selection of data was carried out, and the collection of data such as land-use type data and energy consumption data was carried out on the basis of sources such as the Shenyang Statistical Yearbook. The time period in which the data were collected was from 2015 to 2022. Based on the data obtained, the calculation and analysis of CE from land use types like arable land and garden land are carried out. There are differences in the impact of land use types on CE. According to the characteristics of various land use types, it can be seen that, compared with water, cropland causes a greater impact, which means that its CE coefficient is greater. According to the CE data for various land use types, the corresponding CE estimation is carried out. The range of values for the consumption of type i energy is within [1, 5], with values 1–2 representing farmland and forest land and values 3–4 representing grassland and garden land, respectively. When the value of type i energy consumption is 5, it indicates that the land type is water. The value of the CE factor is in the range of [1, 5]. The value of i is in the range of [1, 5], and the value of 1–2 indicates arable land and forest land, respectively, while 3 and 4 indicate grassland and garden land respectively. When i takes the value of 5, it indicates that the land type is watershed. Carry out the setting of CE coefficients as shown in Table 1.
In Table 1, there are differences in the CE coefficients corresponding to various land use types, in which the CE coefficients of the other four land use types are negative except for the CE coefficients of arable land, which are 0.422, while the CE coefficients of grassland are -0.950, and those of forest land are -0.623. Construction land, due to the diversity of its human activities, results in a much more complex CE coefficient is much more complicated than agricultural land and waters. Therefore, when estimating the CE of construction land, it is necessary to calculate indirectly based on the corresponding CE coefficients produced by the energy consumption it carries. To facilitate the modeling, the study chooses the actual measurement method under which the CE analysis of energy consumption is carried out. This method is based on the net energy calorific value, the total amount of consumption, specific CE coefficients, and oxidation rates to realize an estimation of the actual emissions. This method is widely used for calculating direct CE in various industries due to its low data requirements and ease of operation. The study focuses on analyzing and calculating the emissions of carbon-containing energy sources and does not cover other indirect energy sources, such as electricity, which is an indirect energy source. In this way, the direct CE of the relevant industries can be obtained. The CE from construction land is shown in equation (1).
In equation (1), the CE from the construction land is expressed as PJ in 10,000 t, and the energy consumption of the first i type carried by the construction land is expressed as Li in 10,000 t. δi represents the carbon emission coefficient of the i land use type. The conversion coefficient of the standard coal for energy is set, and it is expressed as Fi. Where i = 1, 2, …, 9, in this case represents 9 types of energy consumption. CE from urban land use is calculated, and its mathematical representation is shown in equation (2).
In equation (2), the urban land use CE is expressed as CEi. According to the data situation recorded in the Shenyang Statistical Yearbook for 2015–2022, it can be seen that there are 9 kinds of energy consumption data in the city. Among them, the discounted standard coal coefficients of these energy sources are displayed in Table 2.
In Table 2, there is a difference in the discounted standard coal coefficients corresponding to the different types of energy sources. Among them, raw coal has the smallest discounted standard coal coefficient, followed by coke, while gasoline has the largest discounted standard coal coefficient, which takes the value of 1.7414 kg standard coal/kg. According to the China Energy Statistical Yearbook, the CE coefficients of the selected energy sources under study were counted to obtain the CE coefficients of different energy sources, as displayed in Table 3.
Table 1.
CE coefficients of different land use types.
| Land use type | Carbon emission coefficient situation (TC/hm)2 |
|---|---|
| Cultivated land | 0.422 |
| Woodland | -0.623 |
| Meadow | -0.950 |
| Garden | -0.210 |
| Waters | -0.400 |
Table 2.
The conversion coefficient of energy to standard coal.
Table 3.
The calorific value and other factors of different energy sources.
| Energy type | CE coefficient situation (tc/tec) |
|---|---|
| Raw coal | 0.7559 |
| Coke | 0.8550 |
| Natural gas | 0.4483 |
| Crude oil | 0.5857 |
| Gasoline | 0.5538 |
| Kerosene | 0.5714 |
| Diesel oil | 0.5921 |
| Fuel oil | 0.6185 |
| Liquefied petroleum gas | 0.5042 |
In Table 3, there are distinctions in the CE coefficients corresponding to different energy types. Among them, the CE coefficient of crude oil is 0.5857 tc/tec, which is larger than that of natural gas, which has the smallest CE coefficient of 0.4483 tc/tec. The CE coefficient of coke is the largest, with a CE coefficient of 0.8550 tc/tec, while that of raw coal is 0.7559 tc/tec. The CE coefficients of gasoline and kerosene are 0.5538 tc/tec and 0.5714 tc/tec, respectively. 0.5538 tc/tec and 0.5714 tc/tec. In addition, through the statistics of major energy consumption by industrial enterprises above the scale of the Shenyang Statistical Yearbook, it is found that there are differences in the corresponding consumption of energy contained in Table 2 with the change of the year. Among them, the consumption of raw coal is the highest each year. With the increase of the year, the consumption of raw coal presents increasing and then decreasing, and the consumption gradually decreases from 2020 to 2022.
Analysis of LUCE Timing and Influencing Factors Based on Improved LMDI Modeling
After completing the LUCE accounting work, the time-series characterization was carried out. Based on Table 1, the total CE of different land types with different durations is calculated. On this basis, the total CE profile of construction land in different years is calculated according to equation (1). Through equation (3), the net land-averaged CE intensity GCi is obtained.
In equation (3), the net CE is set and expressed as C, and the total land area of Shenyang City is expressed and expressed as T*. Among them, the unit of GCi is t/hm2. To calculate the per capita CE intensity, the relevant formula is shown in equation (4).
In equation (4), the net CE per capita is set to be PPCi , and its unit is t/person, and the total population of Shenyang City in the year of i is expressed as Pi. The CE intensity ground on GDP is calculated: CE intensity = net CE (t)/ GDP (million yuan). In different land types, their CE time series characteristics were analyzed. After completing the LUCE time series analysis, its influencing factors are studied. The Kaya equation was chosen due to the fact that it studies the relationship between multiple factors, such as carbon dioxide from human activities and population, while the thesis studies the impact relationship between CE and land change. In order to be more relevant, the study improves the Kaya equation so as to obtain the relevant mathematical expression as shown in equation (5).
In equation (5), hi represents the meaning of CE intensity per unit of land, set the land use structure as li, expresses the land use intensity per unit of GDP as δ, and set the GDP per capita as PG. The population size is set to ps. Quantitatively calculate the influence degree of influencing factors through the LMDI model. Among them, the model can be processed by additive decomposition or multiplicative division. Setting CE0 expresses the meaning of total CE in the base period and t indicates the period of t, and setting the change of total CE, set it to ΔCE. The resulting mathematical expression of ΔCE is shown in equation (6).
In equation (6), ΔCEhi means the amount of CE change influenced by hi, and the amount of CE change affected by δ is set to ΔCEli. For PG, set the amount of CE change under the ΔCEPG; ΔCEps means the amount of CE change under the influence of ps, and set the amount of CE change under the influence of li, set it as ΔCEli. In practice, the LMDI model cannot decompose the data when there are 0 or negative values. In order to compensate for this shortcoming, the study chose the limit method to replace the 0 with other data. With this replacement, the situation of data with a 0 value can be solved, and it will not affect the results. In the context of the actual situation, the case of negative value treatment can be disregarded because negative value does not occur. In this regard, the relevant calculations are performed through the multiplicative decomposition form. The calculation formula for ΔCEhi in the additive decomposition mode is shown in equation (8).
According to equation (7), the formulas for variables such as ΔCEPG, ΔCEps can be obtained. T represents a specific time period. According to these formulas, relevant calculations are carried out, so that the relevant contributions of factors such as hi and δ can be obtained. According to the value of the contribution, analyze the influence of the factors on CE.
Results of the Analysis of Factors Affecting Urban LUCE Ground on the Improved LMDI
The study analyzes the time-series characteristics of LUCE in Shenyang City according to the accounting method of LUCE and understands its CE and other related situations of various land use types. Then it analyzes the situation of LUCE influencing factors in Shenyang city.
Results of Timing Characterization of Urban LUCEs
Carry out the selection of economic data for Shenyang City from 2015 to 2022, as described above. Calculate the total CE of different land types in different years according to equation (1) and the data in Table 1. On this basis, the total CE of construction land in different years is calculated according to equation (2), so that the relevant CE data can be displayed in Table 4.
In Table 4, the positive value demonstrates CE, and the negative is carbon absorption; they have distinctions in the annual CE corresponding to various land uses, in which the CE of construction land and cropland is positive, i.e., they are carbon sources, and the CE of other land uses is negative. In 2015, the CE of construction land was 2705.41*104 t, which is obviously more than the CE of arable land, while the CE of arable land was 15.29*104 t. At this time, the CE of forest land inhibition is 31.49*104 t. In 2022, the net CE will be 2614.77*104 t. It can be seen that the CE outperforms carbon absorption from Table 4, and the total CE is calculated to be the total carbon absorption, after which the CE is calculated to be the total carbon absorption, and the total CE is calculated to be the total carbon absorption. Calculating the total CE is 76 times the total carbon absorption. Analyzing the trend in land-mean CE in the city and in different land uses is shown in Fig. 1.
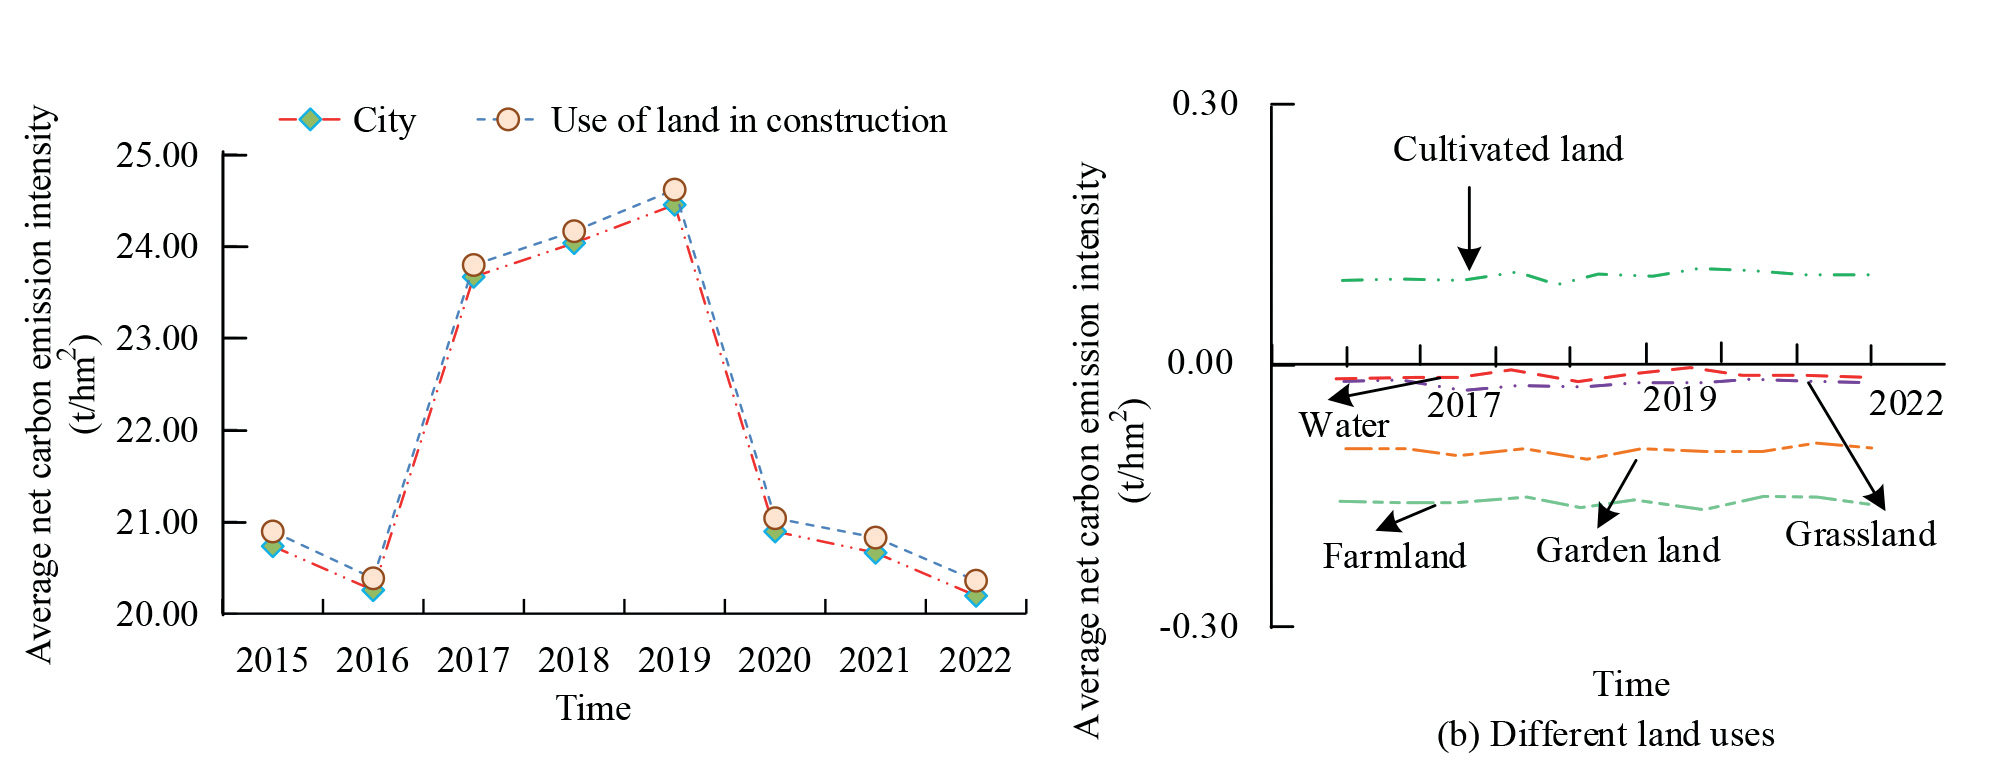
In Fig. 1(a), under different years, Shenyang city’s land average net CE intensity and construction land average net CE intensity are different; in general, these two average net CE changes are consistent. In 2015, the land-averaged net CE intensity of Shenyang city was 20.73 t/hm2, which was 0.16 t/hm2 lower than the construction land, and the latter was 20.89 t/hm2; the land-averaged CE intensity in 2019 was larger, and the land-averaged net CE intensity of the construction land was 24.62 t/hm2. In Fig. 1(b), the folds where the five types of land, such as grasslands, are located do not have much fluctuation, and among them, the land-averaged CE intensity of cropland is larger. In 2022, the land-averaged CE intensity of arable land will be 0.76, while the land-averaged CE intensity of garden land will be -0.029. Analyzing the changes in per capita CE of the city and different land uses is shown in Fig. 2.
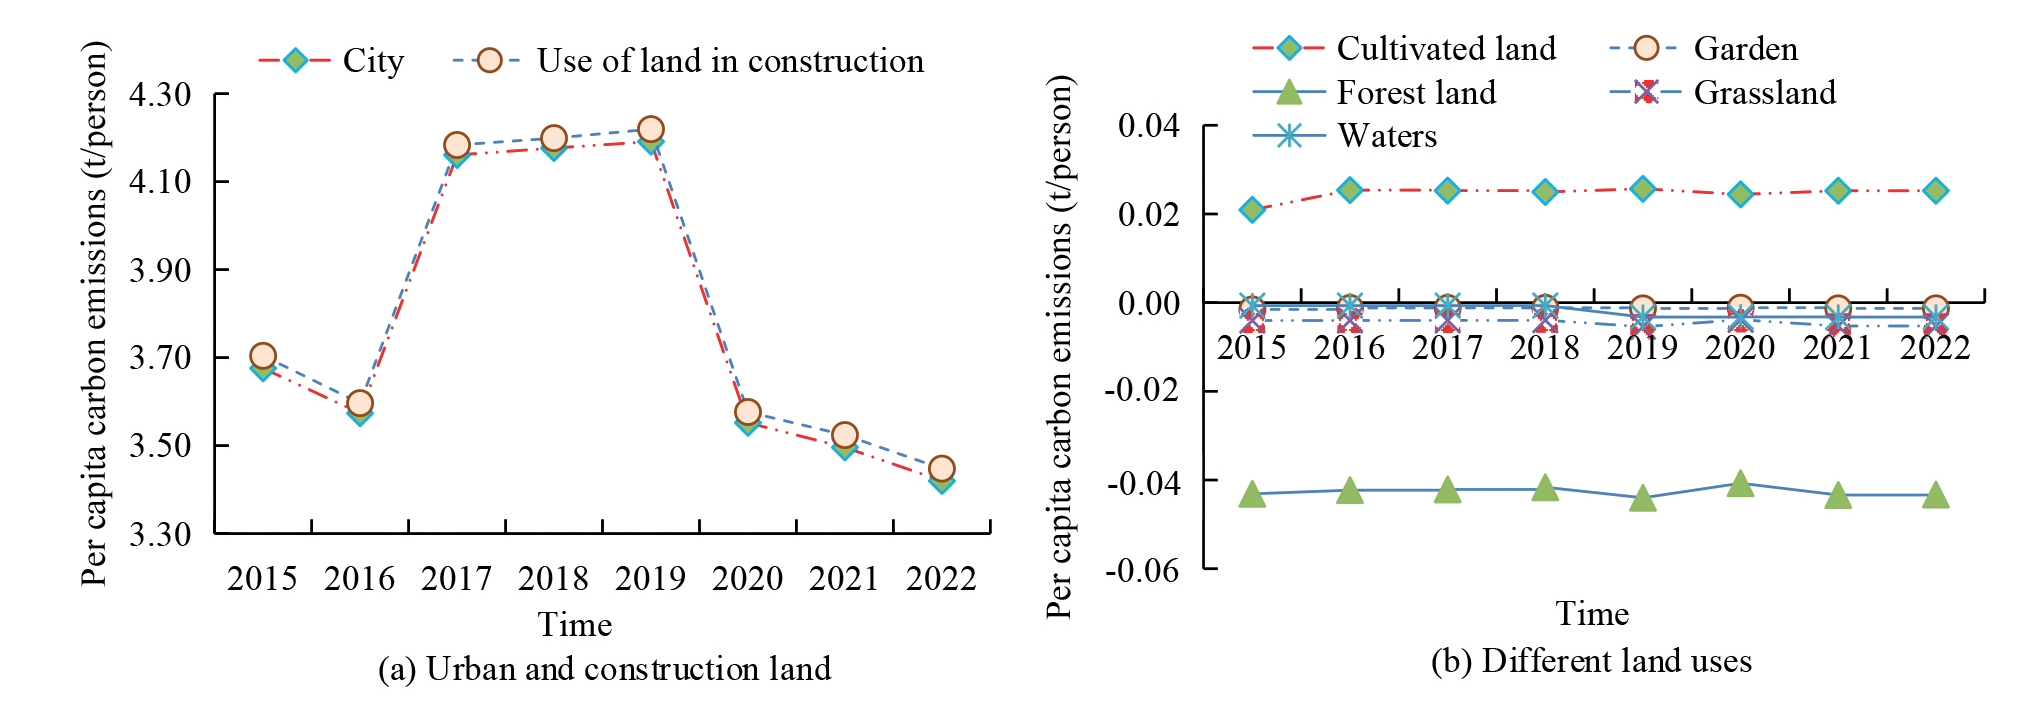
In Fig. 2(a), overall, the per capita CE intensity of Shenyang city is slightly smaller than the per capita net CE intensity of construction land. In Shenyang city, the total per capita CE showed an increasing trend from 2016 to 2019, and the per capita CE from construction land also continued to rise during the same period. After 2019, this trend began to reverse and overall displayed a decreasing trend, which was consistent with the overall net CE change trend during the study period. Among them, in 2017, the per capita CE intensity of Shenyang city was 4.16 t/person, which was 0.02 t/person less than that of the construction land, which was 4.18 t/person; in 2019, the per capita net CE intensity of the construction land was 4.22 t/person, while the per capita CE intensity of Shenyang city was 4.19 t/person. In Fig. 2(b), different land use types correspond to different per capita CE intensities. For the same land use type, the difference in per capita CE intensity in different years is small. In 2016, the per capita CE intensity of cropland was 0.0254 t/person, while the per capita CE intensity of garden land was -0.0012 t/person. In 2018, the per capita CE intensity of forest land was -0.0416 t/person, while the per capita CE intensity of forest land was -0.0440 t/person in 2019, with a smaller difference between the two. In 2020, the per capita CE intensity of cropland will be 0.0244 t/person, which is smaller than that of 2019, which has a per capita CE intensity of 0.0257 t/person. The changes in CE intensity from analyzing cities as well as various land uses are displayed in Fig. 3.
Table 4.
Related CE data.
In Fig. 3(a), the CE intensity of urban and construction land had the same trend of change, with an overall trend of increasing and then decreasing. In 2015, the per capita CE intensity of Shenyang city was 3.69 t/million yuan, which was smaller than that of construction land, which had a per capita CE intensity of 3.72 t/million yuan. Compared with 2018, the per capita CE intensity of Shenyang city was greater in 2017, and it was 5.52t/yuan, while the per capita CE intensity of construction land in 2017 was 5.55t/ yuan. In Fig. 3(b), the CE intensity of cultivated land in Shenyang City shows a decreasing trend year by year between 2016 and 2022. Among them, in 2019, the CE intensity of arable land was 0.030 t/million yuan, while the CE intensity of grassland was -0.006 t/million yuan.
Results of the Analysis of LUCE Influencing Factors
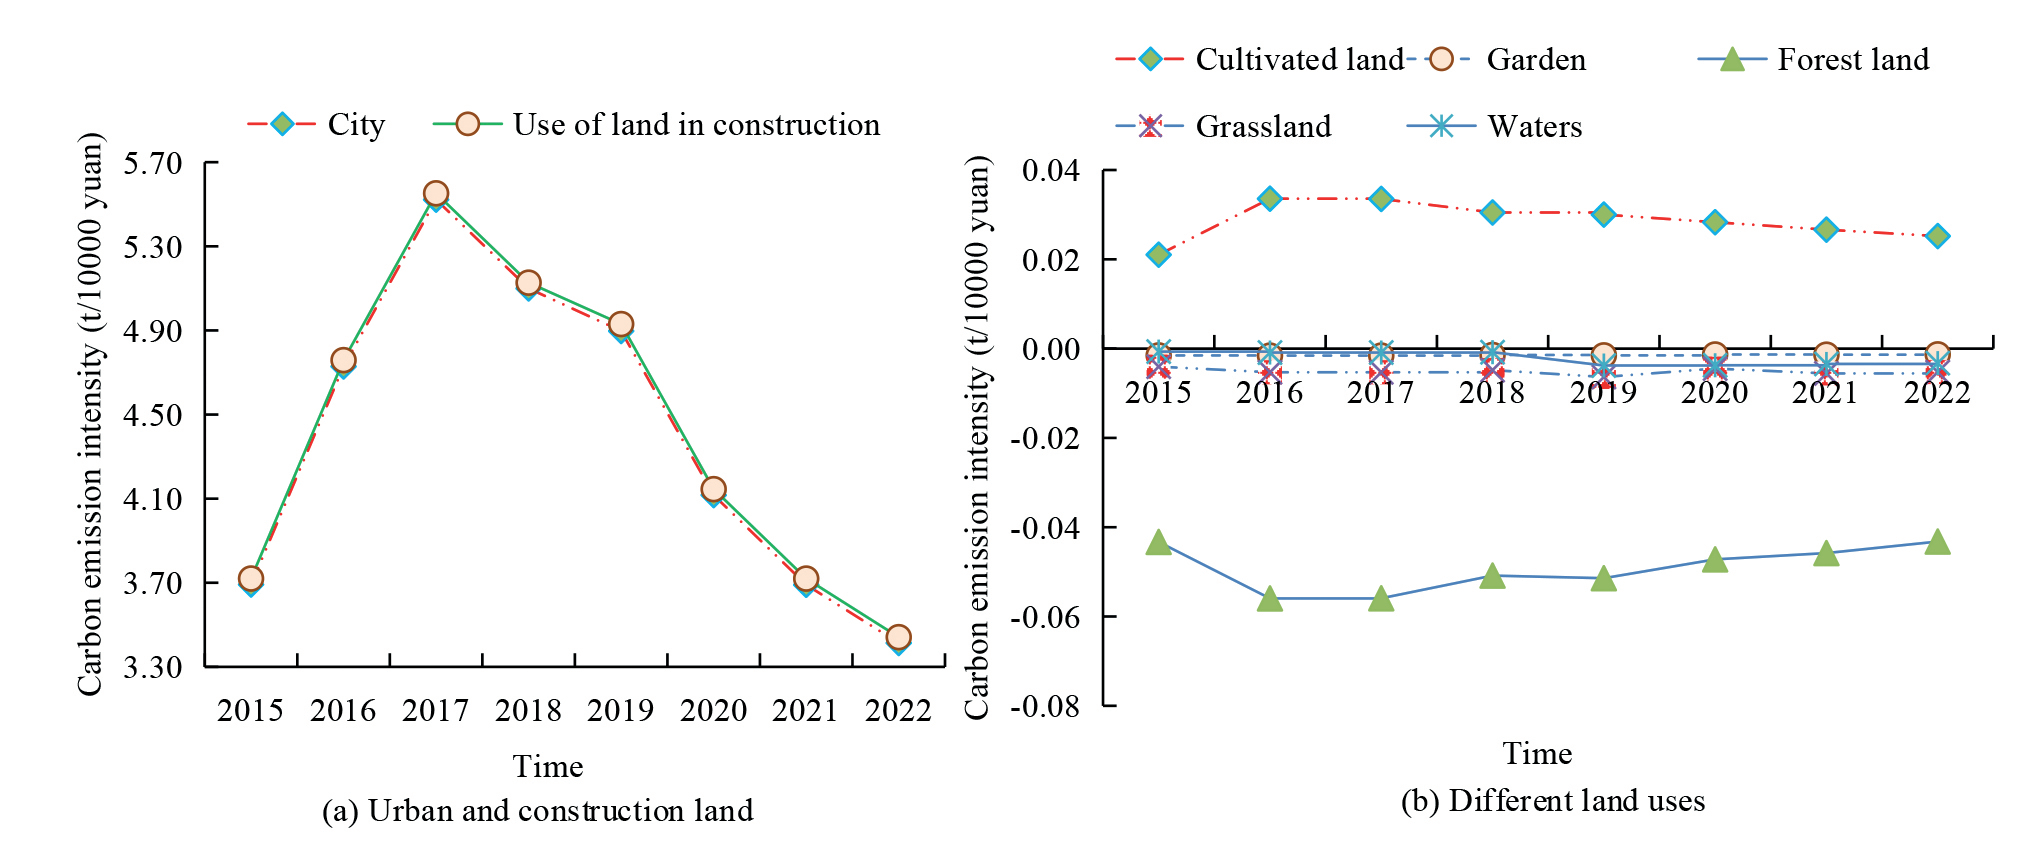
Table 5.
Decomposition results under additive decomposition mode.
Ground on Table 4, through the additive decomposition mode, the analysis is carried out, and the results of the decomposition of urban net CE factors under the additive decomposition mode are obtained in Table 5.
In Table 5, the contribution of factors to net CE is different under different time periods; different factors have various effects on net CE. In 2015–2016, the contribution value of GDP per capita was 23.46*104 t, which is 11.94*104 t larger than that in 2021–2022, and the contribution value of the latter was 11.52*104 t. The contribution value for 2016–2017 is larger, which is 274.32*104 t. In 2019–2020, the contribution of the CE intensity per unit of land is -443.49*104 t. According to the contribution of land use structure, it has a significant inhibiting effect on net CE. The contribution value of various factors to the CE of Shenyang city is analyzed in Fig. 4.
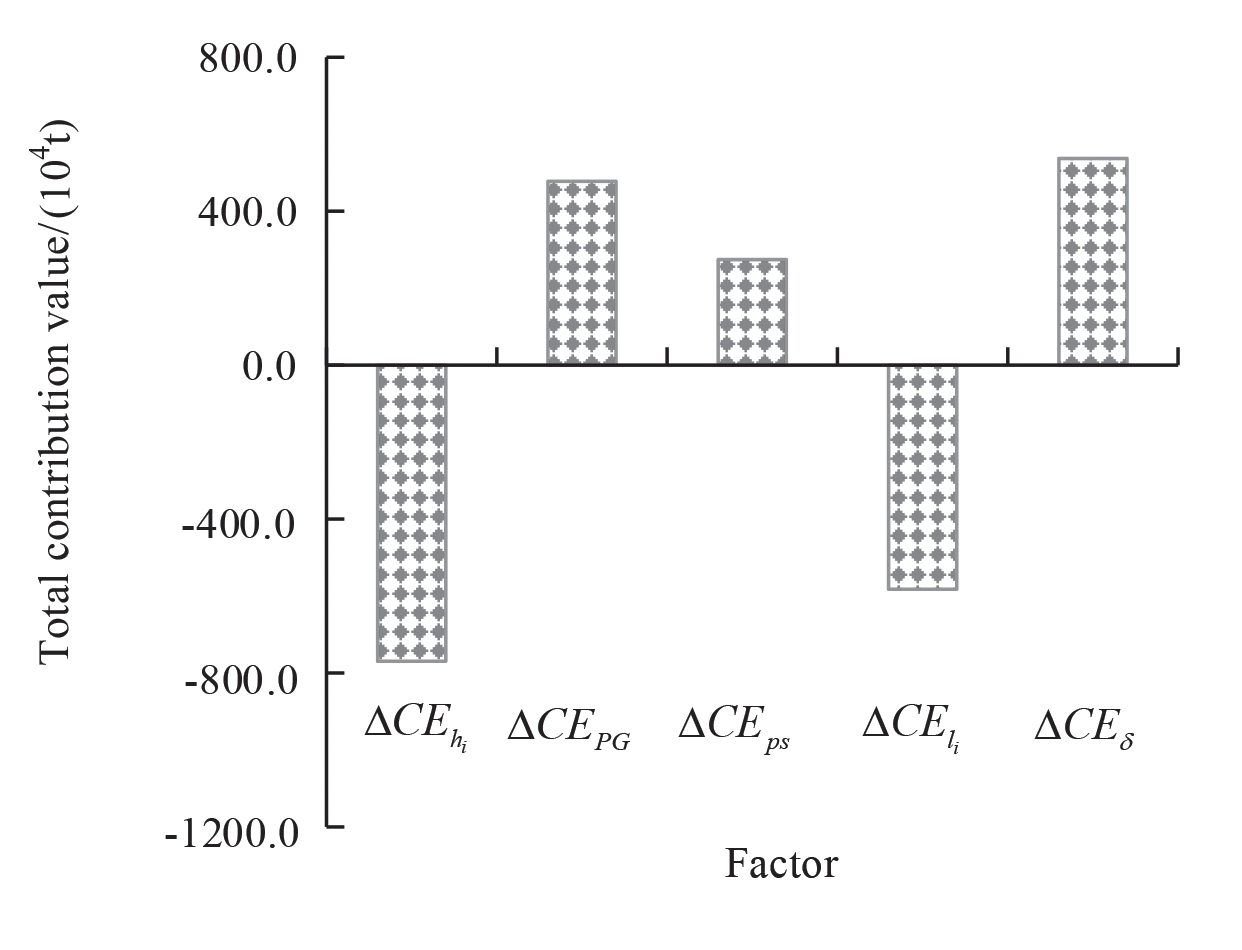
In Fig. 4, there are differences in the corresponding contribution values depending on the factors. In the negative inhibition component, the total contribution value of CE intensity per unit of land is -769.64*104 t. While GDP per capita and population size will have an active contribution to CE, the total contribution value of these two factors is 477.57*104 t and 274.33*104 t. Analyzing the influence of factors such as land-use structure on CE is shown in Fig. 5.
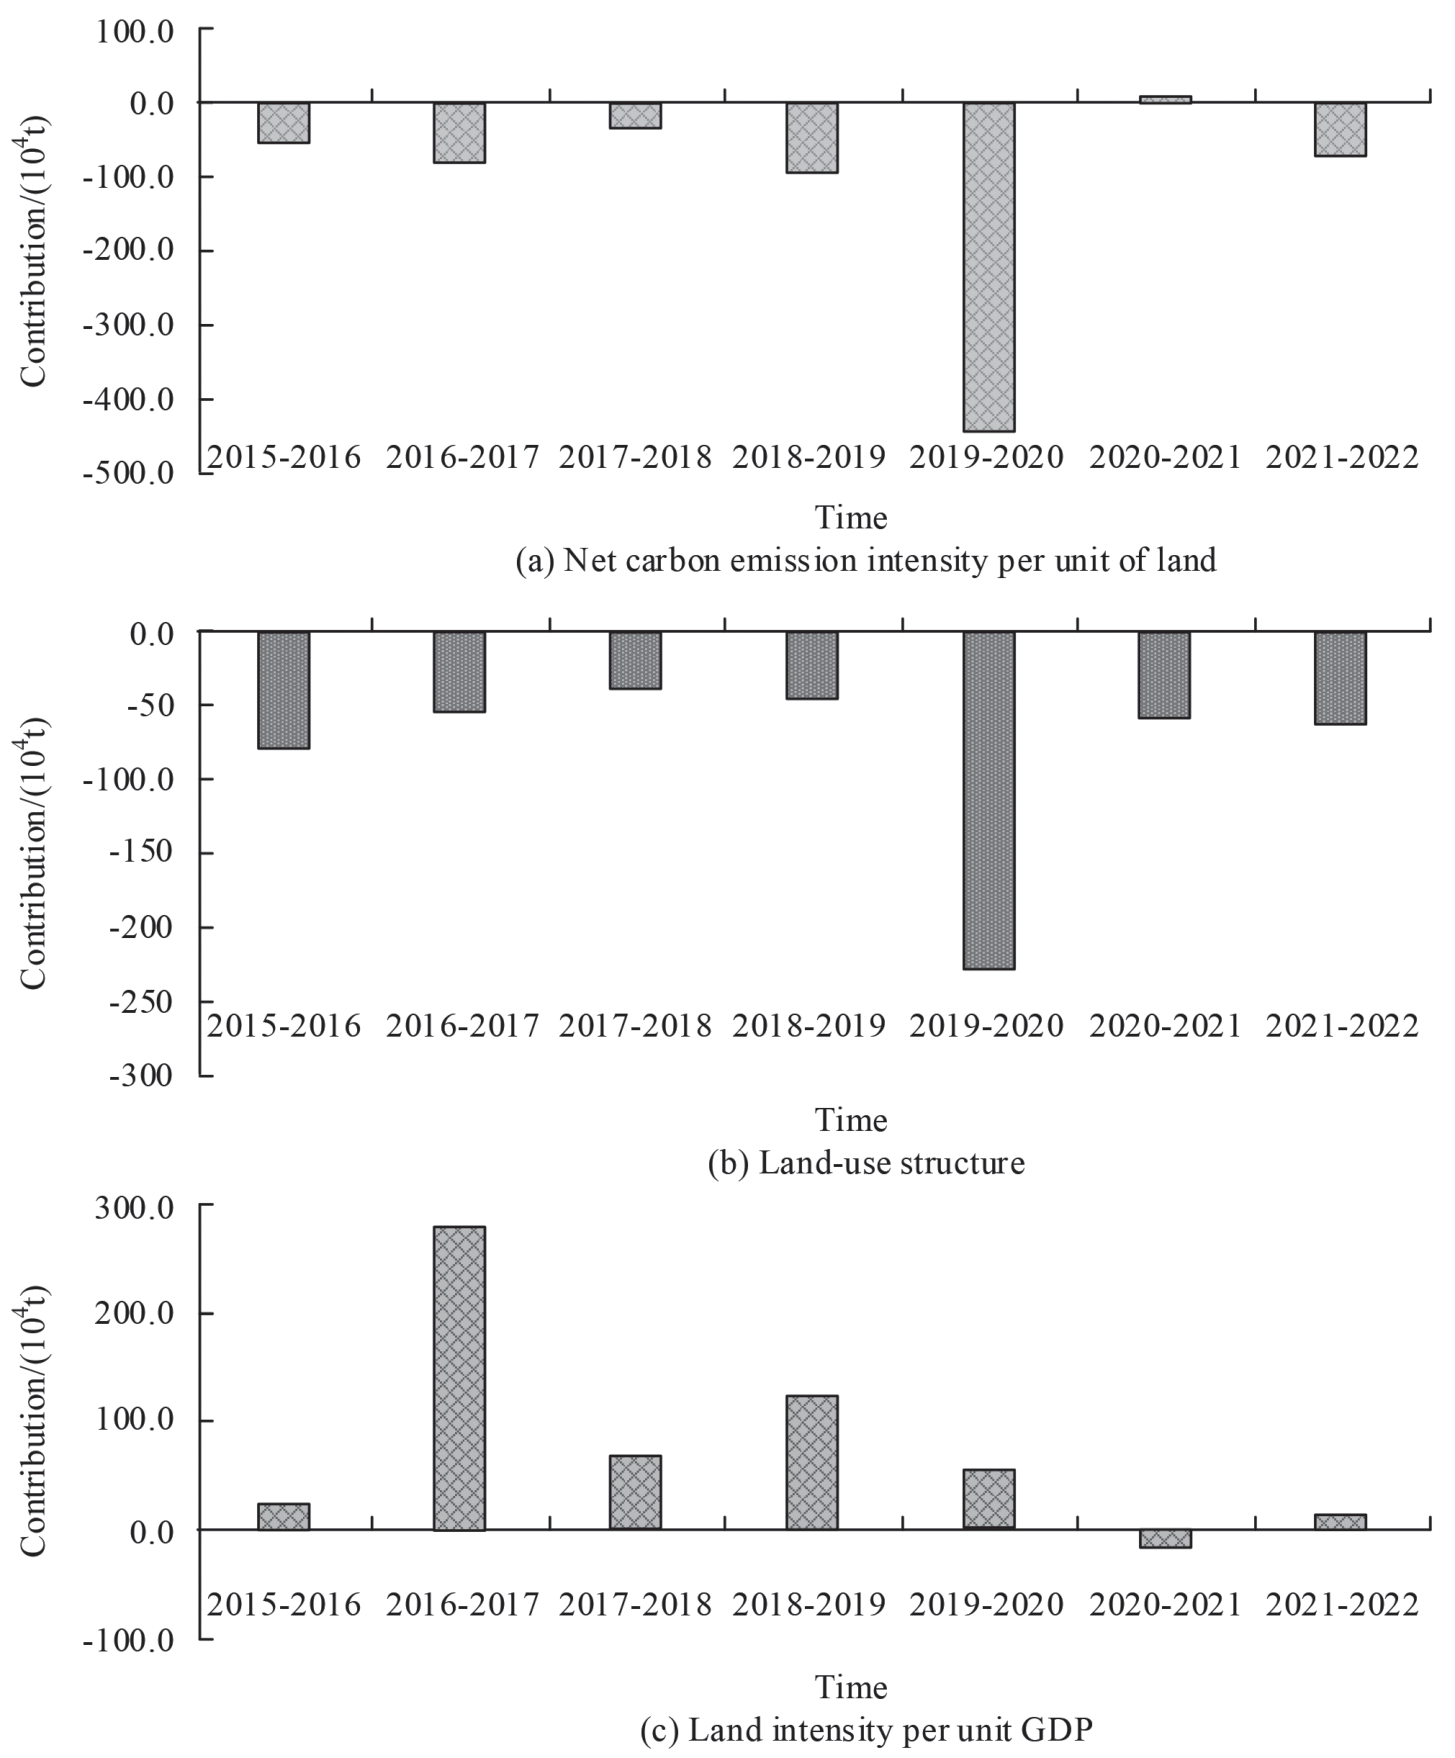
In Fig. 5(a), there are positive and negative values of the contribution of CE intensity per unit of land under different times, and in 2020–2021, the contribution of CE intensity per unit of land is positive. In 2020–2021, the contribution value is 5.23*104 t. In 2016–2017, the contribution was -81.13*104 t, and its inhibition of CE was smaller than that in 2018–2019. In 2016–2017, the intensity of CE per unit of land has the largest inhibitory effect on CE, and its corresponding contribution value was -443.49*104 t. In Fig. 5(b), the contribution value of the land use structure is less than 0 at different times, which means that this factor has an inhibitory effect on CE. Among them, in 2018–2019, the contribution of land use structure was 47.26*104 t. In Fig. 5(c), the contribution value of land use intensity per unit of GDP under different time periods has positive and negative values, which means that this factor has a suppressing as well as a promoting effect on CE. In this case, the total contribution of this factor is 537.04*104 t. Analyzing the changes in the impact of GDP per capita and population size on CE, respectively, is shown in Fig. 6.
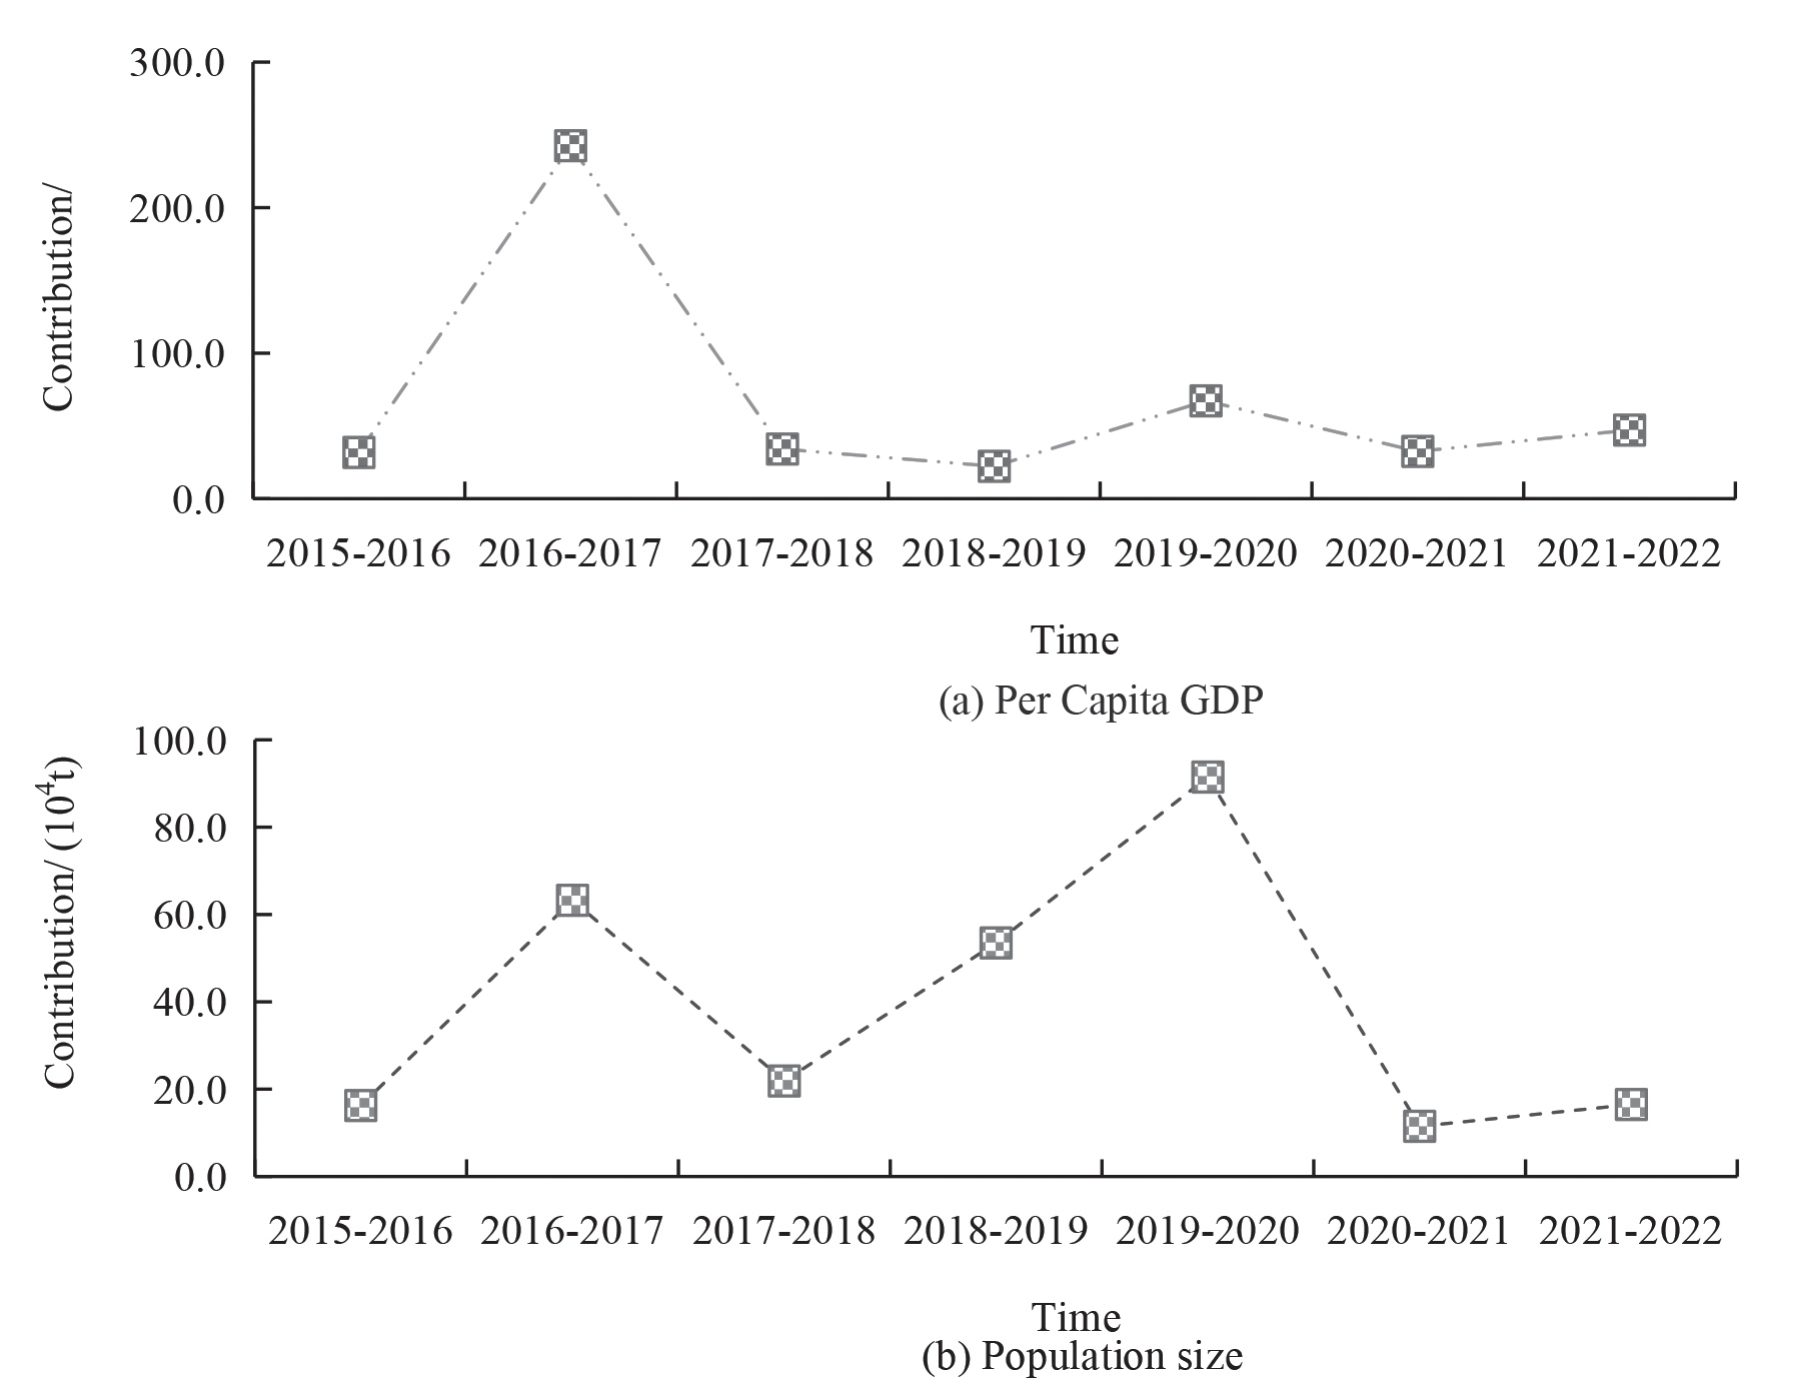
In Fig. 6 (a), the contribution values of per capita GDP in different time periods are all greater than 0. Among them, the total contribution value of per capita GDP from 2016 to 2017 was as high as 274.33 * 104 t, which is a relatively large contribution value. The contribution value of the remaining time periods is relatively low, fluctuating around 50 * 274.33 * 104 t. The reason is that during this year, national policies focused more on economic development and ignored the negative impact of carbon emissions on the environment. Subsequently, the country has introduced corresponding policies to balance economic growth and environmental protection, and carbon emissions have been controlled to a certain extent. In Fig. 6 (b), the contribution of population size is greater than 0. The impact of population size on CE is a promotion. Among them, from 2016 to 2017, the contribution of population size was 63.26 * 104 t. In 2019–2020, the contribution value of population size was as high as 90.35 * 104 t. This indicates that population growth will promote an increase in carbon emissions. The reason is that population growth has brought about an increase in demand for energy, transportation, and production, which in turn has led to an increase in carbon emissions.
Conclusion
Facing the problem of analyzing the influencing factors of LUCE in Shenyang city, the study adopts the LUCE accounting method and combines it with the improved LMDI model to carry out a detailed time-series analysis of the CE of various land use types in the city. The results show that in the time-series characterization of urban LUCE, CE occupies a much higher proportion than carbon absorption, and the total CE is calculated to be 76 times the total carbon absorption. Overall, the per capita CE intensity of Shenyang city is slightly smaller than the per capita net CE intensity of construction land. Among them, in 2017, the per capita CE intensity of Shenyang city was 4.16 t/person, which was 0.02 t/person less than that of construction land, which was 4.18 t/person. In the negative effect of LUCE, the contribution of unit land CE intensity accounts for a large proportion, and its total contribution value is -769.64*104 t. It is followed by the land use structure, and the absolute value of its total contribution value is smaller than that of unit land CE intensity. This shows that the research method is effective. The study has some shortcomings. Given the limitations of research capacity and the challenges of data acquisition, the study failed to integrate energy consumption as an assessment factor directly into the analytical framework. In the future, the incorporation of energy use and land-related factors into the assessment system will provide a more comprehensive perspective to explore in depth the drivers of GHG emissions from land use in Shenyang.

