

Introduction
Air pollutants could be effectively removed from the atmosphere via wet scavenging, resulting in an improvement in ambient air quality after precipitation [1]. Nevertheless, excessive wet deposition of sulfur and nitrogen can cause adverse impacts on terrestrial and aquatic ecosystems, such as soil acidification, eutrophication, and reduced biodiversity [2-4]. Wet deposition of sulfur is mainly from the dissolution of gaseous SO2 and particulate SO42-, whereas nitrogen deposition is more complex, from both oxidized nitrogen (i.e., gaseous NOx, NOy, HNO3, particulate NO3-) and reduced nitrogen (i.e., gaseous NH3 and particulate NH4+) through rainout and washout removal processes.
SO2 and NO2 are two precursors of acidic compounds (H2SO4 and HNO3), which are emitted primarily from fossil fuel combustion. With rapid economic development and urbanization, China has become a global hotspot for acid and nitrogen deposition [5, 6]. In the past two decades, a series of measures have been taken to control SO2 and NO2 emissions in China [7]. For example, flue gas desulfurization systems have been widely installed in power plants since 2005, resulting in significant reductions in SO2 emissions. All power plants have been required to install selective catalytic reduction equipment, and denitrification systems have been installed in some industries (e.g., power plants, or cement plants), leading to a gradual reduction of NO2 emissions since 2012. According to the National Environmental Bulletin, the above emission control policies have mitigated the occurrence of acid rain in China. In 2001, the number of cities experiencing acid rain accounted for around 60% of the total number of monitored cities, while the percentage of acid rain areas in the total surface area of the country has declined from 12.9% in 2011 to 3.8% in 2021 (https://www. mee.gov.cn/hjzl/sthjzk/, last accessed in October 2023). The decreasing trends of acid rain occurrence in China were also confirmed by a recent study. Chen et al. [8] showed that the percentage of acid rain areas in the total surface area of China declined from more than 30% in the 1990s to 5.5% in 2018. Nevertheless, acid rain remains a challenging environmental problem in Sichuan province. Liu et al. [7] showed that precipitation acidity was much greater in the Sichuan Basin by comparing simulated rainfall acidity over China. Moreover, Zhang et al. [9] stated that the annual pH value of Mt. Emei in Sichuan province was about 5.4 in 2017-2019, indicating that acid rain is still a problem in this region.
In addition to the ambient concentrations of these acidic compounds, the acid-neutralizing capacity of alkaline constituents is also responsible for the variations in precipitation acidity. Vuorenmaa et al. [10] found that the decreases of base cations (Mg2+ and Ca2+) concentrations and deposition fluxes were less than those of SO42- and NO3- in Europe over the period of 1990-2015, resulting in an increase in acid neutralization capacity and a subsequent decrease in precipitation acidity. Li et al. [11] demonstrated that the relatively high rainfall pH in northern and northwestern China was attributed to the substantial acid neutralization by some alkaline ions in the saline-alkali soils and local continental dust in this region. Besides these mineral ions, atmospheric NH3 is also an important alkaline constituent in neutralizing the acidity of rainfall. Liu et al. [7] stated that reducing NH3 emissions aggravated precipitation acidification, probably due to a shift of the gas-liquid equilibrium of NH3(g)-NH3(aq)-NH4+(aq) to the gas phase and the formation of more acidic NH4HSO4 rather than (NH4)2SO4 due to the insufficient NH3. Grider et al. [12] showed that NH4+ and Ca2+ were strongly correlated with bulk deposition pH during the period of 2021-2022, in Ohio, in the United States, emphasizing the critical role of these cations in controlling precipitation pH.
NH3 is mainly from fertilizer application and livestock, which not only plays an important role in PM2.5 pollution and the neutralization of precipitation acidity, but also contributes significantly to total nitrogen deposition [13, 14]. Globally, NH3 emissions increased by about 13% during 2008-2018, in particular in East Asia, with an annual change rate of around 6% yr-1 [15]. In addition, NH3 emissions in China are still gradually increasing in recent years due to the growth of agricultural activities [16]. Moreover, mitigation measures for NH3 emissions were initiated later compared to SO2 and NO2 control measures, which were initiated during the 11th Five-Year Plan (2006- 2010) and 12th Five-Year Plan (2011-2015), respectively. As a consequence, the dominant contributor of nitrogen species to total nitrogen deposition might change. Zhao et al. [17] found that the ratio of reduced to oxidized nitrogen deposition in China decreased from 1.72 to 0.81 between 2000 and 2010, and then increased to 0.93 in 2015, which was attributed to the different progress in controlling NOx and NH3 emissions. Furthermore, Chang et al. [5] demonstrated that total nitrogen deposition has shifted from nitrate-dominated to ammonium-dominated in most forest studies across three continents in the northern hemisphere over the last two decades. Changes in the composition of atmospheric nitrogen deposition were also observed across the United States, with oxidized nitrogen dominating during the period of 2000-2004 and reduced nitrogen dominating in 2013-2014 [18].
Previous studies on acid and nitrogen deposition in Sichuan province mainly focused on megacities such as Chengdu [19, 20] and natural ecosystems such as Mt. Emei [9], Jiuzhaigou [21], and the Gongga Mountains [22]. Nevertheless, few studies have been conducted in Mianyang [23], although it is considered to be one of the light acid rain regions, as shown in the Report on the State of the Ecology and Environment in Sichuan province (http://sthjt.sc.gov.cn/sthjt/c104157/hjglnew. shtml, last accessed in October 2023). In addition, Mianyang ranks second in Sichuan province in terms of Gross Industrial Production, and many agricultural areas are also located in Mianyang. Therefore, nitrogen deposition in this region should also be given more attention. The major aims of this study are: (1) to investigate the chemical characteristics of precipitation in Mianyang in the years 2020-2021; (2) to estimate the acid deposition flux and explore the causes of its temporal variations; and (3) to quantify the wet and dry nitrogen deposition fluxes and analyze their seasonal trends and dominant contributors. These findings will fill the gaps in atmospheric deposition in Mianyang and provide essential data for evaluating whether acid and nitrogen deposition in the study region exceeds the critical loads.
Experimental
Sampling
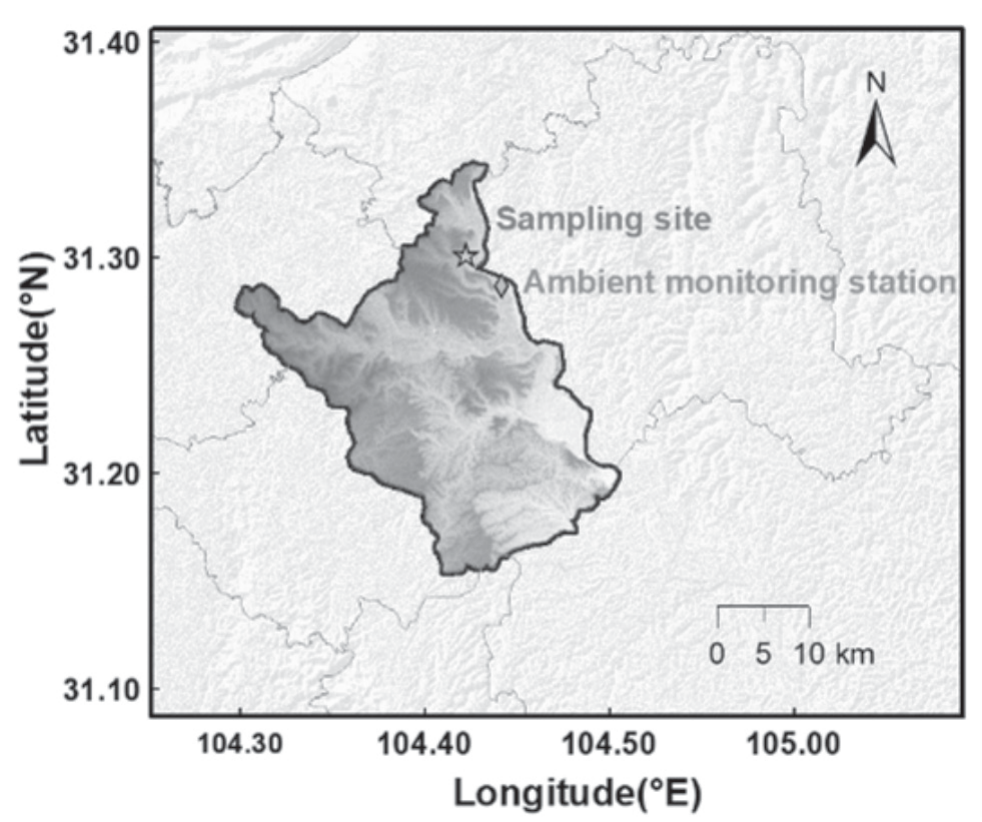
The sampling campaign was carried out on the campus of Southwest University of Science and Technology, which is situated in a suburban area of Mianyang (Fig. 1). There is no industry around the sampling site, while a road with a moderate traffic load is about 0.5 km away from the sampling site. Moreover, the campus is surrounded by sparse agricultural land planted with corn, rice, and vegetables.
Wet and dry deposition samples were collected using an automatic dry-wet deposition sampler (APS- 3A, Xianglan, China). In Mianyang, all wet deposition samples were rainfall. A 300 mm diameter plastic bucket was installed in the sampler to collect rainfall samples, while a 150 mm diameter glass canister mounted on the autosampler was used to collect dry deposition samples. Once rainfall occurs, the humidity sensor is triggered to open the lid of the wet deposition device, and rainfall flows into the 1 L plastic bottle that is kept in a refrigerated compartment (3-5ºC). When the rainfall ceases, the lid of the wet deposition device closes automatically, and particles are deposited into the glass canister. Rainfall samples were collected on a daily basis between 9:00 a.m. and 9:00 a.m. the next day from September 1, 2020, to August 31, 2021. A rain gauge installed inside the automatic sampler recorded the amount of each rainfall. Furthermore, the dry deposition samples were collected every two weeks, typically in the middle (i.e., 16th) and end (i.e., 30th or 31st) of the month. In total, 115 rainfall samples and 24 dry deposition samples were collected during the sampling period.
Hourly concentrations of SO2 and NO2 during the sampling periods were continuously monitored at an ambient monitoring station in Mianyang, about 4 km away from the sampling site (Fig. 1).
Sample Pretreatment and Chemical Analysis
After sampling, the volume of dry deposition samples was recorded, and rainfall pH was measured immediately using a pH meter (PHSJ-3F, Leici Corp., China). The remaining rainfall and dry deposition samples were then filtered with a 0.45 µm filter to remove insoluble compounds and stored at -18 ºC for further chemical analysis.
Major anions (F-, Cl-, SO42-, and NO3-) and cations (Na+, NH4+, K+, Mg2+, and Ca2+) in wet and dry deposition samples were analyzed by ion chromatography (ICS6000, Thermo Fisher, USA). The separation columns used for cation analysis were the CS12A column (4×250 mm) and the CG12A guard column (4×50 mm), and the eluent was 20 mM methanesulfonic acid at a flow rate of 1 mL min-1. Meanwhile, an AS11-HC column (4×250 mm) and an AG11-HC guard column (4×50 mm) were used for anion analysis, and the eluent was 30 mM KOH at a flow rate of 1.5 mL min-1. The calibration curves were constructed for each ion using the certified standards (o2si, USA), with correlation coefficients all higher than 0.999. In addition, certified reference materials provided by the Institute for Environmental Reference Materials of Ministry of Environmental Protection were used for quality control.
Data Analysis
The monthly or annual volume-weighted mean (VWM) pH was calculated as follows:
where pHi and Pi are the measured pH and rainfall amount (mm) in the ith rainfall sample, respectively, and n is the total number of daily rainfall samples per month or year.
The monthly or annual VWM concentration of water-soluble inorganic ions (WSIIs) in rainfall was calculated as follows:
where Ci is the concentration (μeq L-1) of WSIIs in the ith sample.
In order to comprehensively illustrate the chemical characteristics of the rainfall, the following parameters were calculated: neutralization factor (NF), acid-neutralizing capacity (ANC), and fractional acidity (FA).
NF was typically used to estimate the acid-neutralizing capacity of individual alkaline ions, which was calculated as follows [24]:
where [x] is the concentrations (μeq L-1) of alkaline ions such as Na+, NH4+, K+, Mg2+, and Ca2+ in the rainfall, and [SO42-] and [NO3-] represent the concentrations (μeq L-1) of SO42- and NO3-, respectively.
ANC was calculated based on the difference between concentrations of major alkaline ions and acidic anions [25]:
where all concentrations of WSIIs are in the unit of μeq L-1.
Besides ANC, FA was also used to evaluate the acidity of rainfall [26], which was calculated according to Eq. (5):
where [H+] is the concentration of H+ (μeq L-1), which is converted from the pH value. FA is typically equal to one when the rainfall acidity is not completely neutralized by the alkaline components.
To quantify acid deposition, wet deposition fluxes of SO42- and NO3- on an equivalent basis were calculated. The monthly (keq ha-1 month-1) or annual acid deposition flux (keq ha-1 yr-1) could be obtained by summing them as follows:
where CVMSO42- and CVMNO3- are the monthly or annual VWM concentrations (μeq L-1) of SO42- and NO3-, respectively, and Pt is the total rainfall amount (mm) in a month or a year. Furthermore, the equivalent ratio of SO42- to NO3- ([SO42-]/[NO3-]) could be used to reveal the dominant factors of acid deposition.
Monthly (kg N ha-1 month-1) or annual wet deposition fluxes (kg N ha-1 yr-1) of NH4+-N and NO3--N were calculated based on the Eqs. (7-8),
Similar to the equivalent ratio of SO42- to NO3-, the mass ratio of NH4+-N to NO3--N (NH4+-N/NO3--N) can be used to reveal the dominant sources of atmospheric nitrogen deposition.
The dry acid deposition flux (keq ha-1) for each sample was calculated as follows:
where CSO42- and CNO3- are the concentrations (μeq L-1) of SO42- and NO3-, respectively, for each dry deposition sample, V is the volume of the dry deposition sample (mL), and S is the area of the dry deposition canister (176.6 cm2). The annual dry acid deposition flux was calculated by summing FDacid of all dry deposition samples.
Dry deposition fluxes (kg N ha-1) of NH4+-N and NO3--N for each sample were calculated as follows:
where CNH4+-N and CNO3--N are the concentrations (mg N L-1) of NH4+-N and NO3--N in each dry deposition sample, respectively. The annual dry deposition flux was estimated by summing the deposition fluxes in each sampling event throughout the year.
Results and Discussion
Chemical Characteristics of Rainfall
Overview
A total of 115 rainfall samples were collected from September 2020 to August 2021 at the sampling site in Mianyang. Monthly rainfall amounts varied from 0.9 mm (January) to 258 mm (August), with a total rainfall amount of 910 mm during the sampling period. Evident seasonal variation in rainfall was observed, with higher amounts in the wet season (March to October) and lower ones in the dry season (November to February). Meanwhile, rainfall frequently occurs during the wet season, especially in August, with about 65% being rainy days. However, the number of rainy days during the dry season was very low, accounting for less than 13% of the total days.
During the sampling period, daily pH ranged from 5.5 to 7.8, with an annual pH of 6.7, which was close to that in Beijing [27], Xi’an [28], and Taiyuan [29], but higher than those regions with severe acid rain such as Chongqing [30], Shanghai, and Wuhan [11]. The annual pH in Mianyang was above the acid rain criterion (pH = 5.6), and only one rainfall sample had a pH value below 5.6 (September 24, 2020). Compared with pH values in previous years in Sichuan province, the annual pH in Mianyang was about 1.5 units higher than the mean pH value of 21 cities from 2011 to 2016 [23]. The increase in rainfall pH in recent years was probably due to an increase in acid-neutralizing capacity, which was related to decreases in acidic gas emissions (i.e., SO2 and NO2) and stable alkaline constituent levels (e.g., NH3) [31].
SO42- and NO3- are the two primary components that cause acid rain formation, while NH4+ and NO3- are the two main contributors to wet nitrogen deposition. Daily concentrations of SO42-, NO3-, and NH4+ in rainfall were in the range of 3.5-378.4, 2.2-424.0, and 1.6-496.0 μeq L-1, respectively, with annual VWM concentrations of 30.1, 28.7, and 64.9 μeq L-1. Compared with SO42- and NO3-, Cl- showed a minor contribution to rainfall acidity, with an annual VWM concentration of 4.6 μeq L-1. Daily concentrations of Cl- varied significantly, ranging from 0.3 to 358.8 μeq L-1, which was probably influenced by biomass burning events. The annual VWM concentration of Ca2+ was 31.8 μeq L-1, about half of the NH4+ concentration. The concentrations of the other three cations (i.e., Na+, K+, and Mg2+) were low, with annual VWM values lower than 6.0 μeq L-1.
The trends of the NF values of the five cations were consistent with their concentrations. NH4+ exhibited the strongest acid-neutralizing capacity, with an NF value of 1.1, followed by Ca2+ (0.54), Mg2+ (0.09), Na+ (0.07), and K+ (0.03). The ranking of the acid-neutralizing capacities of the five cations in Mianyang was different from that of Guizhou province [32], where Ca2+ showed the strongest acid-neutralizing capacity, followed by NH4+, Na+, Mg2+, and K+. The high level of Ca2+ in precipitation in Guizhou province was associated with the wide distribution of carbonate rocks in the karst region. The sampling site in Mianyang is located in a suburban area with low wind speeds all year round, which was not beneficial to the dust resuspension. Considering the weak acid-neutralizing capacity of Na+, K+, and Mg2+, only NH4+ and Ca2+ were used to calculate the ANC value. The annual ANC was 37.8 μeq L-1, indicating that SO42- and NO3- were fully neutralized by NH4+ and Ca2+. Furthermore, the annual mean value of FA was 0.0035, demonstrating that about 99% of the inorganic acids in the rainfall were neutralized by alkaline ions. The FA value in Mianyang was much lower than those in Central East Europe (0.34) [33], South Africa (0.19-0.38) [34], and France (0.17) [35], but comparable to those in Xi’an [36] and Guizhou province [32]. The extremely low FA value was consistent with the relatively high pH and ANC values, confirming less acid rain formation in Mianyang during the sampling period.
Monthly Variations
Monthly VWM concentrations of SO42-, NO3-, and NH4+ showed similar trends, with the highest concentrations in January and the lowest in July or August (Fig. 2). For SO42-, the monthly VWM concentration in January was 213.2 μeq L-1, which was about 1.5-2.0 times that in February and March and even 10-15 times that in June, July, and August. For NO3-, the maximum concentration in January was 257.2 μeq L-1, while the concentration from June to August was only 5% of that in January, around 15 μeq L-1. For NH4+, except for the peak in January (239.5 μeq L-1), the monthly VWM concentrations were still high in March (205.3 μeq L-1) and November (212.0 μeq L-1). The lowest concentration of NH4+ was observed in August (29.0 μeq L-1). For the dominant cation Ca2+, the highest concentration was found in January (314.8 μeq L-1), about 30 times higher than the lowest in August (9.7 μeq L-1).
The concentrations of WSIIs in rainfall were associated with the rainfall amounts and their concentrations in the air. As shown in Fig. 2, the concentrations of four dominant ions (i.e., SO42-, NO3-, NH4+, and Ca2+) showed an opposite trend to the rainfall amounts. In the dry season, low rainfall amounts and frequencies favored the accumulation of pollutants in the air. Once rainfall occurs, WSIIs could be effectively removed from the air, leading to a dramatic increase in their concentrations in rainfall. In contrast, the abundant rainfall in the wet season had a dilution effect, resulting in lower concentrations of WSIIs. The same finding was observed in the tropical Bangkok Metropolitan Region [37], where the concentrations of WSIIs declined significantly with increasing rainfall. Regarding gaseous pollutants, monthly concentrations of SO2 and NO2 were higher during the dry season, with peaks occurring in January, while lower concentrations were observed in the wet season, with minimum levels in September and August. It seems that the seasonal variations of SO42- and NO3- concentrations in rainfall followed the patterns of SO2 and NO2 concentrations in the air, but the monthly variations of SO42- and NO3- were larger than those of SO2 and NO2, e.g., the ratios of the maximum to minimum monthly mean concentration were 13.9 and 2.2 for SO42- and SO2, respectively, while they were around 18.6 and 2.2 for NO3- and NO2. This implies the combined effect of atmospheric chemical processes and rainfall amounts on the concentrations of WSIIs in rainfall.
For NH4+, the relatively high concentrations in March and November might be attributed to the extensive application of fertilizers, which increased NH3 emissions. The monthly variation of Ca2+ in Mianyang was consistent with that in Mt. Emei in Sichuan province [9], with the highest concentration in January and the lowest in August. However, it differed from the results conducted by Li et al. [11], in which the concentration of Ca2+ was highest in summer, followed by spring and autumn, and lowest in winter in 320 cities across China. These distinct differences were probably related to the meteorological conditions and topography of Mianyang. The low wind speeds and high relative humidity all year round were not conducive to dust resuspension. Moreover, Mianyang is located in the Sichuan Basin, and dust storms that frequently occur in northwest China in the spring have a minor influence on the crustal ions in Mianyang via long-range transport. At the same time, Ca2+ is also a typical crustal ion affected by vehicle dust. High concentrations of Ca2+ in January and March may be due to population movement during the Spring Festival holiday.
Fig. 2.
Monthly variations of rainfall amount, pH, concentrations of SO2, NO2, SO4 2-, NO3 -, NH4 +, and Ca2+, and NF values of NH4 + and Ca2+.
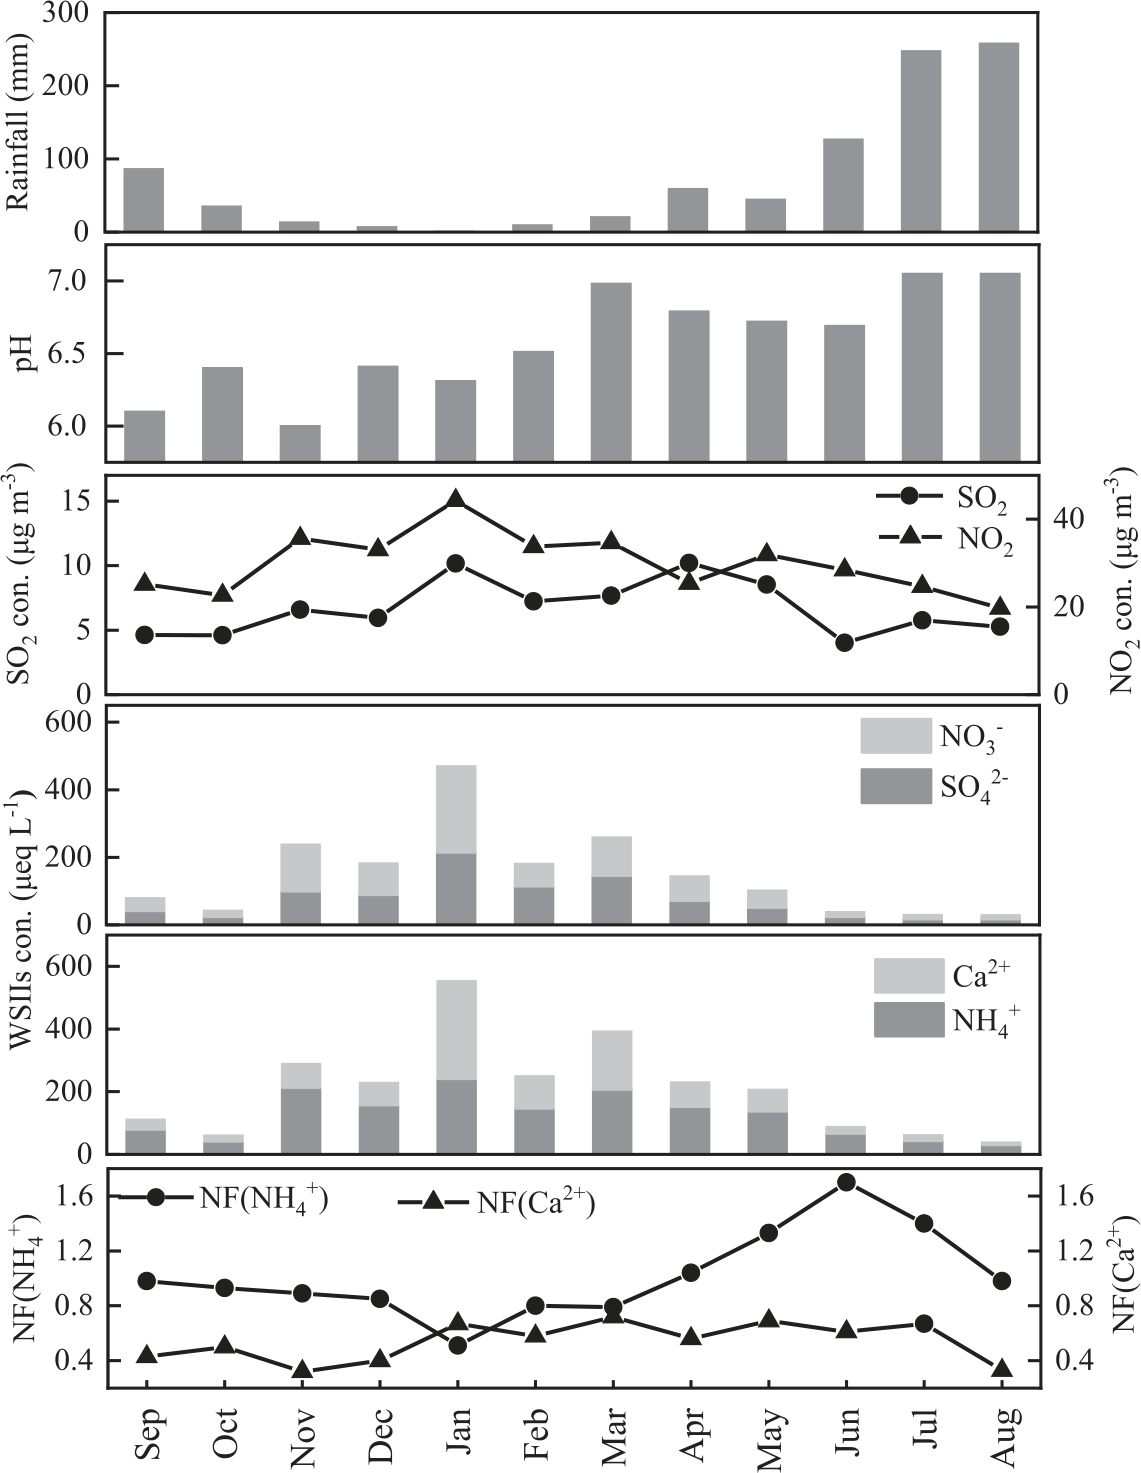
The monthly pH in rainfall varied from 6.1 to 7.0 during the sampling period. Higher pH values usually appear in the wet season except in September, while relatively lower pH values are observed in the dry season. Rainfall pH is affected by many factors, such as acidic gases and aerosol concentrations, alkaline compound levels, and rainfall amounts. In the wet season, abundant rainfall diluted the H+ concentration and thus increased the pH, and vice versa in the dry season. Moreover, more acidic species were neutralized by alkaline ions during the wet season, which was supported by the higher NF values of NH4+ from April to August (Fig. 2). Note that the higher pH in March was primarily due to the higher NF value of Ca2+. In September, the rainfall amount and NF values of Ca2+ and NH4+ were all higher than those in the dry season. Nevertheless, the pH in September was the lowest, which might be related to the existence of organic acids that were not measured in this study. This explanation was plausible since high temperatures in September could promote the emission of volatile organic compounds from natural sources and the formation of organic acids under strong solar radiation.
Acid Deposition
Although acidic compounds in rainfall were fully neutralized by alkaline ions, the influences of sulfate and nitrate deposition on surface water and soil acidification have been of great concern [38]. Acid deposition occurs via the dry deposition of acidic gases and particles and the wet deposition of major acidic compounds. Generally, wet acid deposition was mainly related to SO42- and NO3- in rainfall, while dry acid deposition included the deposition of gaseous SO2, NO2, and HNO3 as well as particulate SO42- and NO3-. In this study, coarse particles were effectively collected using a surrogate surface method by an automatic dry-wet deposition instrument. However, gases and fine particles may only be partially collected, causing an underestimation of dry acid deposition. Based on the annual VWM concentrations of SO42- and NO3- and the total rainfall amounts during the sampling period, the annual wet deposition fluxes of SO42- and NO3- were estimated to be 0.27 and 0.26 keq ha-1 yr-1, respectively, resulting in a total wet acid deposition flux (sum of wet deposition fluxes of SO42- and NO3-) of 0.53 keq ha-1 yr-1 (Table 1). Wet acid deposition flux in Mianyang was about 75% lower than that in Guizhou province [32] and the Yangtze River Delta [39], about half of the national mean acid deposition flux for natural and agricultural ecological regions across China (1.02 keq ha-1 yr-1), but comparable to the value in northwest China (0.51 keq ha-1 yr-1) [31].
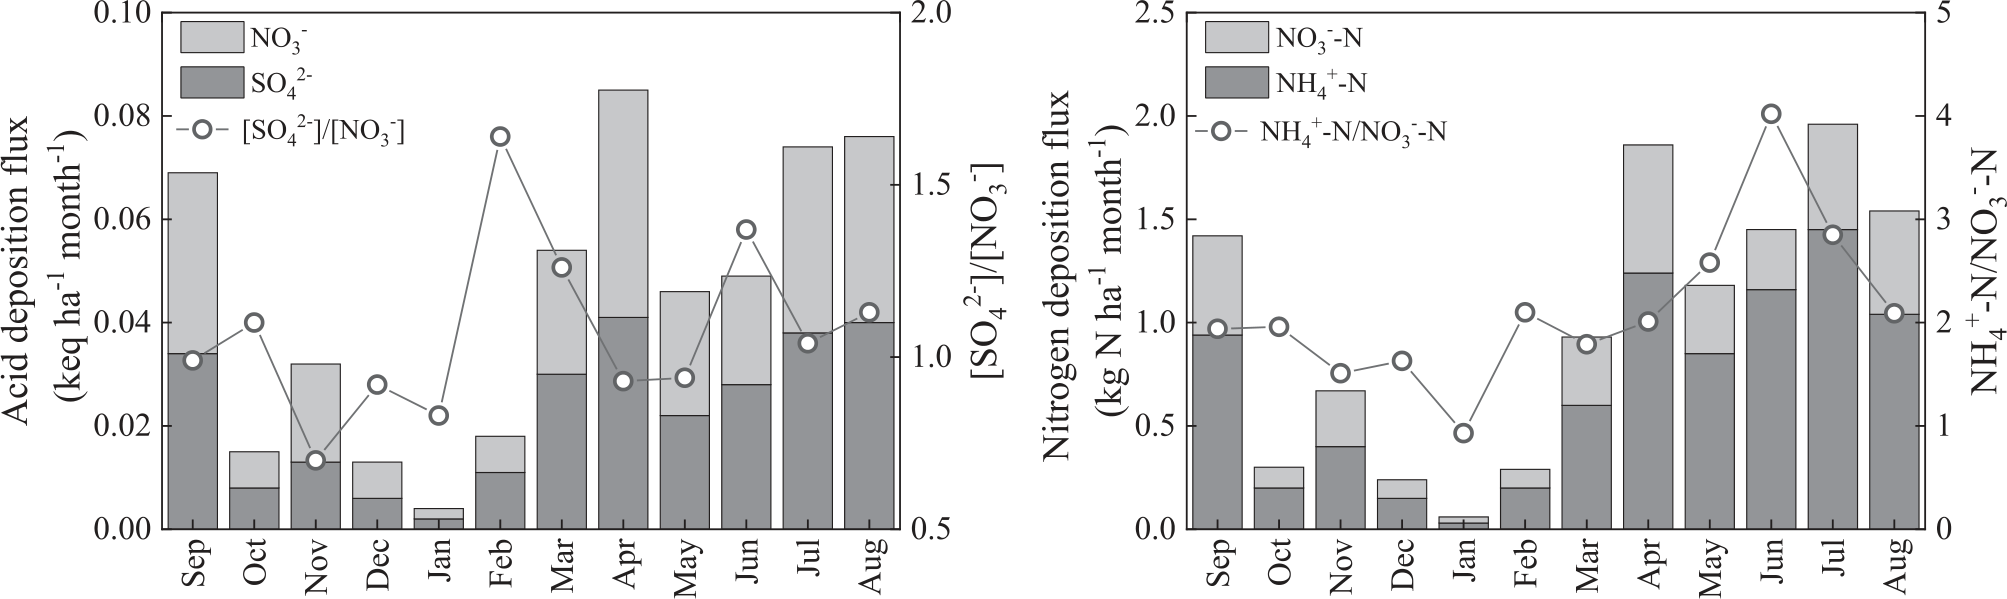
Seasonally, both SO42- and NO3- displayed higher deposition fluxes in the wet season and lower values in the dry season (Fig. 3). Wet deposition fluxes of SO42- and NO3- were highest in April, followed by July, August, and September, and lowest in January. So did the wet acid deposition flux. This monthly variation pattern was related to both the concentrations of acidic compounds and rainfall amounts. It seems that rainfall amounts play an important role in wet deposition fluxes. For example, although the concentrations of SO42- and NO3- in rainfall were highest in January, little rainfall led to the lowest deposition fluxes. On the contrary, the VWM concentrations of SO42- and NO3- were lowest in July and August, but their deposition fluxes ranked top due to substantial rainfall amounts. Furthermore, strong positive correlations between wet deposition fluxes of SO42- and NO3- and rainfall amounts were observed, with correlation coefficients of 0.72 (p<0.01) and 0.64 (p<0.05), respectively, again emphasizing the important role of rainfall amounts in wet acid deposition in Mianyang.
On an annual basis, SO42- and NO3- accounted for 51% and 49% of the total wet acid deposition flux, respectively. The equivalent ratio of [SO42-]/[NO3-] was 1.1, indicating that the acid deposition in Mianyang was a mixed type caused by both sulfuric and nitric acid. Compared with other cities, the ratio of [SO42-]/[NO3-] in this study was higher than that in Shanghai and Zhengzhou (around 0.7) [11], and close to that in rural Beijing (1.1) [27], but was much lower than that in Taiyuan (2.6) [29], Houzhai catchment in southwest China (4.4) [32], and the average value of 320 cities across China in 2016 (2.5) [11]. Because limited studies have been conducted in Mianyang city, the ratio of [SO42-]/[NO3-] in this study was compared with those conducted in Sichuan province. The equivalent ratio of [SO42-]/[NO3-] in this study was slightly lower than that at Mt. Emei in the years 2017-2019 (1.4) [9] and the mean ratio across Sichuan province between 2011 and 2016 (about 3.3) [23], implying that the role of nitrate in acid deposition in Sichuan has been increasing in recent years, and acid deposition has shifted from sulfuric acid-dominated to sulfuric-nitric acid mixed type.
The annual dry deposition fluxes of SO42- and NO3- were 0.09 and 0.11 keq ha-1 yr-1, respectively, and the total dry acid deposition flux was about 0.20 keq ha-1 yr-1. Taking the wet and dry deposition together, the total annual acid deposition flux in Mianyang was 0.73 keq ha-1 yr-1, which was close to the maximum critical load of acidity in Sichuan province (0.2-1.0 keq ha-1 yr-1) [40], indicating that harmful ecological effects would likely occur in terrestrial ecosystems around Mianyang.
Table 1.
Annual wet and dry acid and nitrogen deposition fluxes in Mianyang during the period of 2020-2021.
Nitrogen Deposition
According to the annual VWM concentrations of NH4+-N and NO3--N and the cumulative rainfall amount during the sampling period, the annual wet nitrogen deposition fluxes were estimated to be 8.3 kg N ha-1 yr-1 for NH4+-N and 3.7 kg N ha-1 yr-1 for NO3--N, respectively, resulting in a total wet nitrogen deposition of 12.0 kg N ha-1 yr-1 (Table 1). Generally, the annual wet deposition flux of NH4+-N in this study was about half of that in Guangzhou [41], the Beijing-Tianjin-Hebei region [42], and Wanzhou in southwestern China [43]; about 20-30% lower than that in Nanjing [39] and Xi’an [28]; comparable to the value in Taiyuan [29] and the mean deposition flux of 27 sampling sites in the Pearl River Delta [41]; but it was about two times higher than that of a rural site in Beijing [27], the mean deposition flux of 43 typical Chinese ecosystems [31], and the average value of 320 cities across China [11]. Compared with the results conducted in Sichuan province, the annual wet deposition flux of NH4+-N in Mianyang in this study was about 30-60% lower than that in Chongzhou in 2015-2016 [44], Mt. Emei in 2017-2018 [9], Yanting in 2009-2013 [45], and the mean wet deposition flux of 21 cities over Sichuan province [23], but it was about 3 times higher than that at a remote site in the Gongga Mountains [22].
In terms of NO3--N, the annual wet deposition flux in this study was about 2-3 times lower than that in Xi’an [28], Nanjing [39], Guangzhou [41], and the mean value in the Beijing-Tianjin-Hebei region [42], while it was comparable with the mean deposition flux of 43 typical ecosystems in China [31] and 320 cities over China [11]. In comparison with the results carried out in Sichuan province, the annual wet deposition flux of NO3--N in this study was about 3 times lower than that in Chongzhou in 2015-2016 [44] and the average value of 21 cities in Sichuan province during the period of 2011-2016 [23]. It was even 5 times lower than that in Chengdu in 2013 [22]. Overall, the wet deposition flux of NH4+-N in Mianyang fell within the range of other cities in China, but the wet deposition flux of NO3--N was at a lower level. Furthermore, both NH4+-N and NO3--N wet deposition fluxes in Sichuan province have decreased in recent years compared with previous years, which might be related to the urbanization process and the strict control of NO2 emissions.
The monthly wet deposition fluxes varied from 0.03 to 1.5 kg N ha-1 month-1 for NH4+-N and 0.03 to 0.6 kg N ha-1 month-1 for NO3--N, respectively. The maximum deposition flux was observed in July for NH4+-N and April for NO3--N, while the minimum deposition fluxes were found in January for both. Moreover, the monthly wet deposition flux of NH4+-N exhibited greater variation than NO3- -N, by a factor (ratio of maximum to minimum deposition flux) of 48 for NH4+-N and 19 for NO3- -N, respectively. Seasonally, both NH4+-N and NO3--N showed higher deposition fluxes in the wet season and lower values in the dry season. Although the rainfall amount in October was higher than the four months of the dry season, the deposition fluxes of NH4+-N and NO3--N in October were lower than or comparable to those in the dry season due to their relatively low concentrations in rainfall. Note that the wet deposition flux of NH4+-N was much higher than that of NO3--N in the wet season, whereas the difference in deposition flux between NH4+-N and NO3--N was small in the dry season. This discrepancy could be explained by two factors. First, high temperatures in the wet season might promote NH3 emissions from fertilizers, livestock, waste disposal, and sewage systems, resulting in more NH3 being transferred from the atmosphere to rainfall. Second, removing gases via wet scavenging was more efficient than removing particles. In the dry season, particulate NH4+ and NO3- were the dominant forms in the air, probably leading to a similar wet scavenging efficiency for them.
From an annual perspective, NH4+-N and NO3--N accounted for 70% and 30% of the total wet nitrogen deposition flux, respectively. The mass ratio of NH4+-N/ NO3--N was 2.3, reflecting that nitrogen deposition in Mianyang was dominated by reduced nitrogen. The ratio of NH4+-N/NO3--N in Mianyang was at a high level compared with other cities in China. e.g., the ratios of NH4+-N/NO3--N were in the range of 1.1-2.0 in Xi’an [28], Nanjing [39], Taiyuan [29], and Guangzhou [41]. Furthermore, the mass ratio of NH4+-N/NO3--N in this study was higher than the mean value of 320 cities across China during the period of 2011-2016 (about 1.5) [11] and the average ratio of 21 cities in Sichuan province (around 1.4) [23], implying the important role of agriculture activities in nitrogen deposition in Mianyang.
Regarding dry nitrogen deposition, the annual deposition fluxes of NH4+-N and NO3--N were 2.9 and 1.5 kg N ha-1 yr-1, respectively, causing a total dry nitrogen deposition of 4.4 kg N ha-1 yr-1. Together with the wet nitrogen deposition, the total annual nitrogen deposition flux was 16.4 kg N ha-1 yr-1. Duan et al. [40] reported that the critical loads of nitrogen in southeastern Sichuan were in the range of 10-20 kg ha-1 yr-1 and higher than 20 kg ha-1 yr-1 in central Sichuan. Considering the underestimation of nitrogen deposition due to the partial omission of gas deposition, especially NH3 dry deposition, which contributed more than 40% of the total reduced nitrogen deposition [46, 20], terrestrial ecosystems around Mianyang are thought to be at potential risk of eutrophication.
Conclusions
In this study, daily rainfall samples and two-week integrated dry deposition samples were continuously collected over a one-year period from September 2020 to August 2021 in Mianyang. During the observation period, daily pH values were higher than 5.6 in all rainfall samples, except for one sample, resulting in an annual pH value of 6.7. SO42- and NO3- were two dominant anions in the rainfall, with annual VWM concentrations of 30.1 and 28.7 μeq L-1, respectively, while NH4+ and Ca2+ were two major cations, with annual VWM concentrations of 64.9 and 31.8 μeq L-1, respectively. Monthly concentrations of SO42-, NO3-, NH4+, and Ca2+ showed a similar trend, showing higher concentrations in January and lower values in July or August. The high acid-neutralizing capacity of NH4+ and Ca2+ and the extremely low FA value (0.0035) implied that acidic compounds (i.e., SO42-, NO3-) were completely neutralized by alkaline ions, resulting in fewer acid rain events during the sampling period.
The annual wet and dry acid deposition fluxes were 0.53 and 0.2 keq ha-1 yr-1, causing a total acid deposition flux of 0.73 keq ha-1 yr-1. The equivalent ratio of [SO42-]/ [NO3-] was 1.1, indicating that sulfuric and nitric acid were equally important for acid deposition in Mianyang. The annual wet and dry nitrogen deposition fluxes were 8.3 and 2.9 kg N ha-1 yr-1 for NH4+-N and 3.7 and 1.5 kg N ha-1 yr-1 for NO3--N, respectively, leading to a total annual nitrogen deposition of 16.4 kg N ha-1 yr-1. Moreover, reduced nitrogen species dominated nitrogen deposition, accounting for 74% of the total flux. In the future, more emphasis should be placed on controlling NH3 emissions to reduce the nitrogen load in Mianyang effectively. Note that organic nitrogen fluxes were not estimated in this study due to the lack of data on organic nitrogen concentrations, which might cause an underestimation of total nitrogen deposition fluxes. In future studies, the contribution of organic nitrogen should be considered to evaluate the impact of nitrogen deposition on ecosystems.

