

Introduction
Sichuan Province plays a pivotal role in China’s drive towards carbon neutrality, given its unique geographical, industrial, and ecological significance. Achieving accurate assessments of the spatial and temporal distribution of carbon dioxide (CO2) concentrations in the region is essential for understanding its carbon sources and sinks, which in turn underpins the development of scientifically sound carbon reduction strategies [1, 2]. While existing ground-based observation networks, such as the Total Carbon Column Observing Network (TCCON) and the Global Greenhouse Gas Reference Network (GGGRN), offer high-precision CO2 concentration measurements, their limited spatial coverage restricts their ability to represent the full extent of CO2 variations across the vast and diverse landscapes of Sichuan Province [3]. This limitation presents a significant challenge in capturing the region’s carbon dynamics accurately, which is crucial for evaluating local emission patterns and natural carbon sinks.
To address this, satellite remote sensing has emerged as a crucial tool due to its wide coverage and high spatiotemporal resolution, making it ideal for regional carbon monitoring [4-6]. Satellites such as GOSAT, OCO-2, OCO-3, and TanSat provide extensive data on CO2 concentrations by measuring the column-averaged dry air mole fraction of CO2 (XCO2). However, despite the advantages of satellite observations, the data they generate are often incomplete due to various factors [7], including cloud cover, aerosols, and surface reflectance anomalies [8]. This non-random missing data creates gaps in satellite datasets, particularly in regions with complex meteorological conditions like Sichuan [9]. Consequently, obtaining a complete, high-resolution spatiotemporal dataset for CO2 concentrations remains a significant research challenge [10].
Recent studies have focused on developing methods to reconstruct CO2 distributions from satellite data, with machine learning models like XGBoost and Random Forest being commonly employed. However, these models have limitations when it comes to capturing the spatial heterogeneity of CO2 concentrations and accurately modeling temporal dynamics. Furthermore, integrating data from multiple satellite platforms, each with varying observation characteristics and errors remains a technical obstacle that hinders the accuracy of reconstructed datasets [11, 12]. This presents a clear research gap: while satellite remote sensing offers a powerful method for monitoring CO2, the inability to effectively merge and reconstruct multi-source datasets with high spatial and temporal accuracy limits the understanding of carbon sources and sinks in regions like Sichuan [13].
To address this gap, scholars are increasingly exploring the use of advanced deep learning techniques for spatiotemporal data fusion. Convolutional Residual Network (ResNet), known for its powerful spatial feature extraction capabilities, has demonstrated potential in identifying fine-grained spatial patterns in satellite imagery [14, 15]. In parallel, Long Short-Term Memory (LSTM) networks are well-suited for modeling temporal sequences, allowing them to capture dynamic changes in CO2 concentrations over time [16, 17]. Combining these two approaches provides a promising avenue for improving the accuracy and resolution of CO2 concentration reconstructions, effectively filling in gaps left by traditional methods.
In this study, we propose a ResNet-LSTM model to fuse and reconstruct XCO2 data from GOSAT, OCO-2, and OCO-3, addressing both the spatial and temporal gaps in the satellite observations. The model generates high-resolution (1 km grid) daily CO2 concentration distributions for Sichuan Province from 2015 to 2022, significantly enhancing the precision of CO2 monitoring compared to traditional methods. The ResNet-LSTM model achieves an R² of 0.97, demonstrating its superior accuracy in reconstructing spatiotemporal CO2 distributions. These results provide a robust data foundation for validating local emission inventories and formulating effective emission reduction strategies. The enhanced understanding of the spatial heterogeneity and temporal dynamics of carbon emissions will support Sichuan’s contribution to China’s national carbon neutrality goals and foster the development of policies promoting sustainable low-carbon growth.
Nomenclature
To facilitate understanding of the key terms used throughout this study, this section provides definitions and explanations of symbols, abbreviations, and important concepts used in the paper.
XCO2: Column-averaged dry air mole fraction of CO2, typically expressed in parts per million (ppm).
ResNet: Residual Network, a type of convolutional neural network (CNN) used for spatial feature extraction from satellite images.
LSTM: Long Short-Term Memory, a type of recurrent neural network (RNN) used for capturing temporal dependencies in time series data.
RMSE: Root Mean Square Error, a measure of the differences between predicted and observed values, indicating model accuracy.
R²: Coefficient of Determination, a statistical measure that indicates how well the model’s predictions fit the actual data.
OCO-2: Orbiting Carbon Observatory-2, a satellite designed to monitor atmospheric CO2 concentrations.
OCO-3: Orbiting Carbon Observatory-3, a CO2- monitoring instrument aboard the International Space Station designed to complement OCO-2.
GOSAT: Greenhouse Gases Observing Satellite, a satellite launched by Japan to monitor major greenhouse gases, including CO2.
Ppm: Parts per million, a unit used to measure the concentration of gases like CO2 in the atmosphere.
Data Collection
Research Area
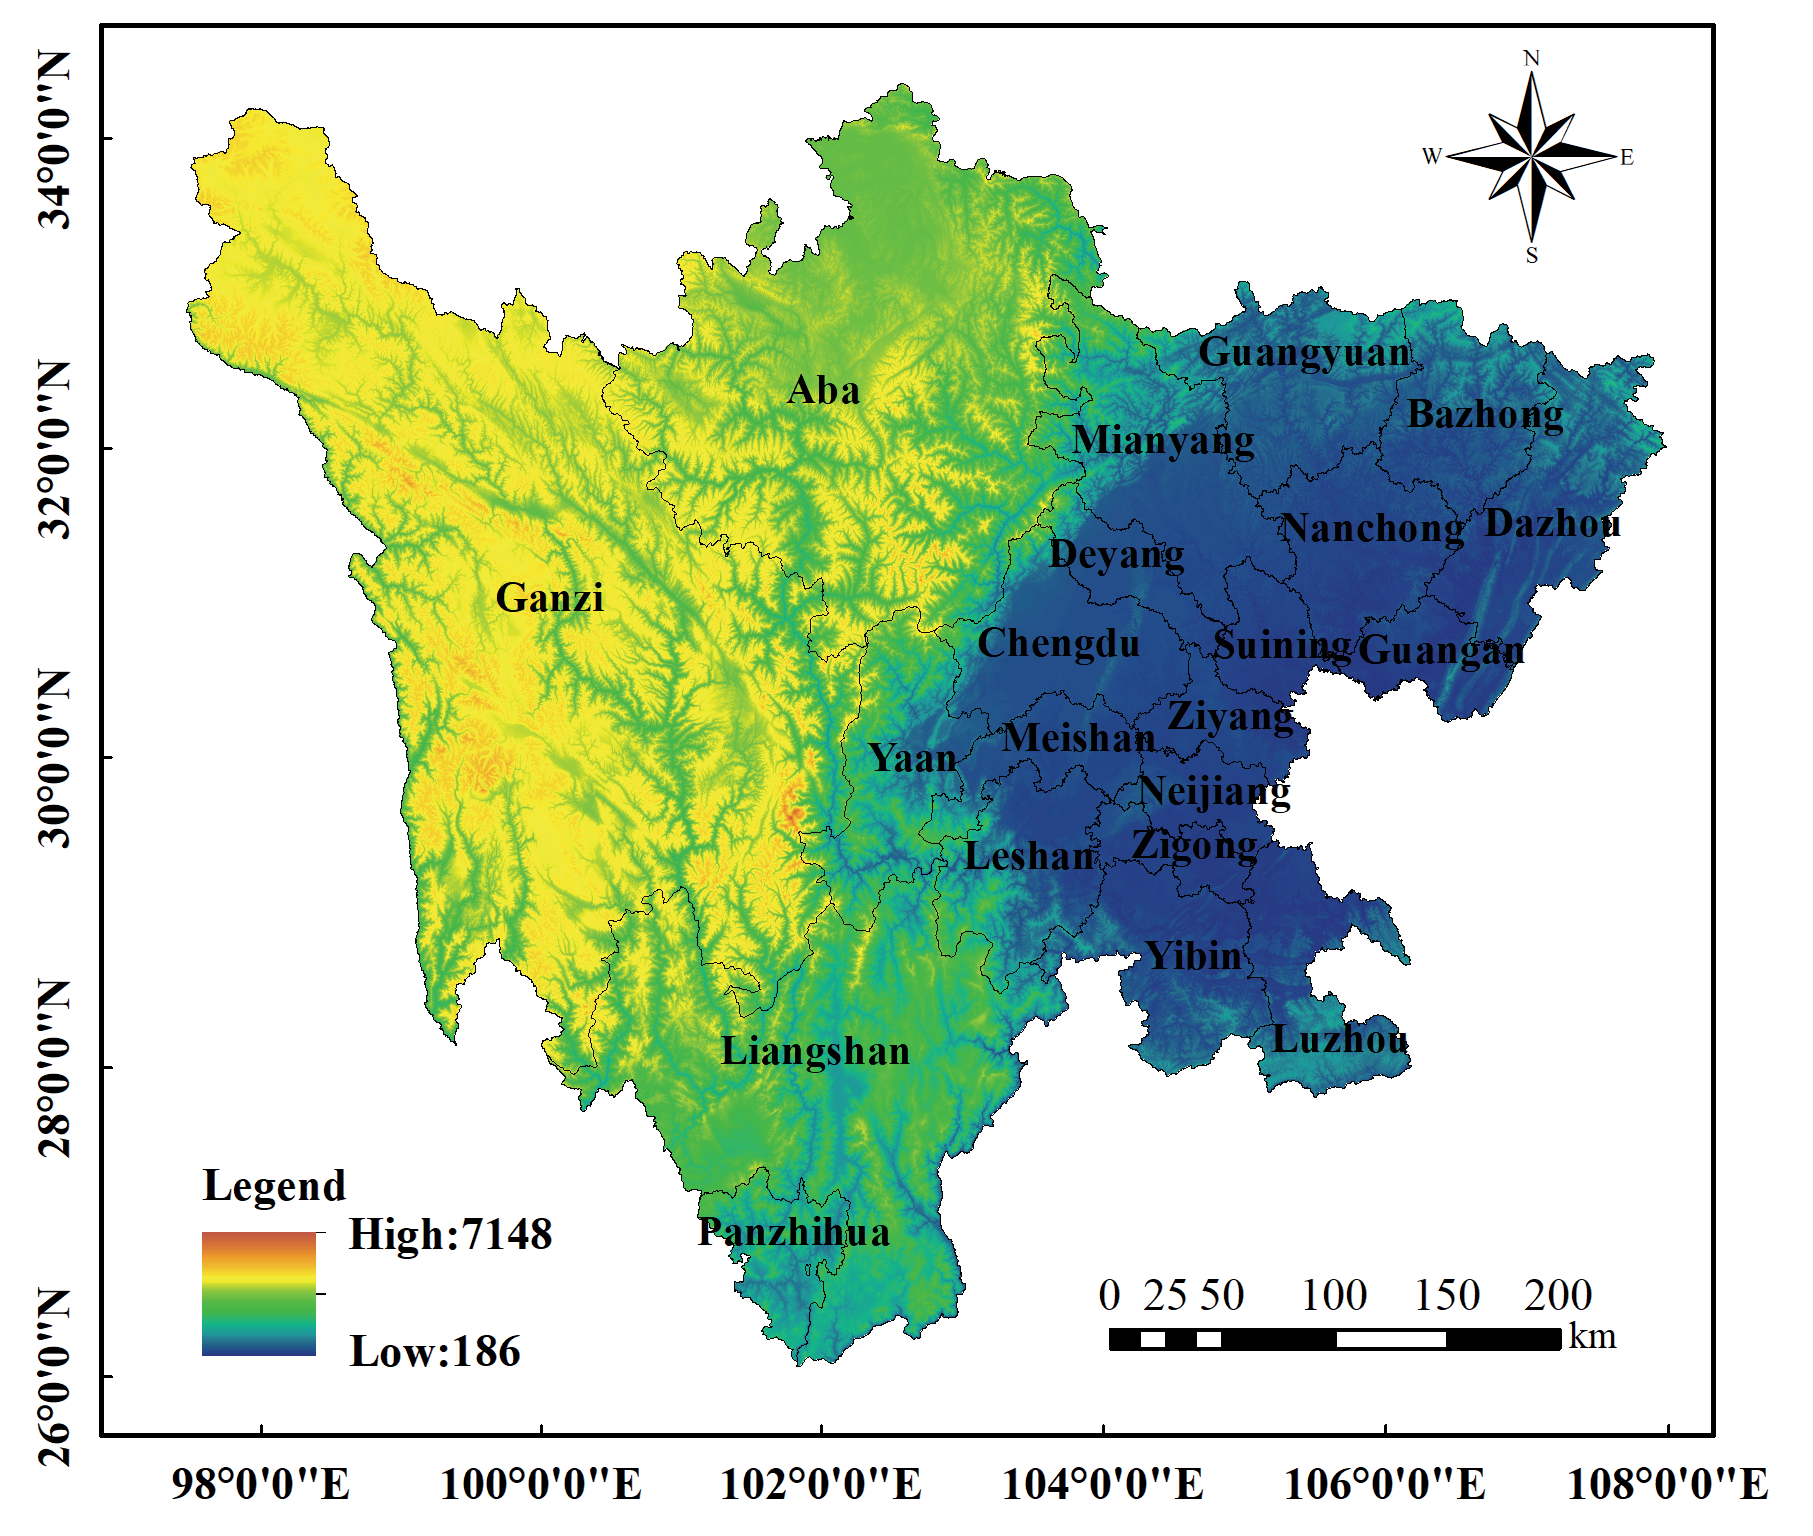
Sichuan Province is located in the hinterland of southwest China, covering an area of over 480,000 Km2 (longitude 92°21’ to 108°12’, latitude 26°03’ to 34°19’), as shown in Fig. 1. It comprises 21 prefecture-level administrative units and serves as a vital hub connecting Central and Southern China with the Southwest and Northwest regions. The province features diverse topography: the western part is an extension of the Qinghai-Tibet Plateau, characterized by high altitudes, mostly above 3,000 meters, comprising plateaus and mountains, while the eastern part is a transitional zone to the middle and lower reaches of the Yangtze River Plain, mainly consisting of basins and hilly terrain, with elevations mostly ranging from 500 to 2,000 meters. As a populous and industrialized province in China, Sichuan has a high carbon emission intensity. The province hosts numerous industrial facilities and has a high population density, resulting in concentrated carbon emission sources and a significant total carbon output. Understanding the temporal trends and spatial distribution characteristics of carbon dioxide (CO2) concentrations in Sichuan over the years is crucial for formulating scientific and rational emission reduction strategies, which are essential for achieving the carbon peak and carbon neutrality goals at both the provincial and national levels.
Satellite Remote Sensing Data
In this study, the multisource satellite remote sensing data primarily includes XCO2 datasets from OCO-2, OCO-3, and GOSAT (Table 1).
1) OCO-2 [18]: The Orbiting Carbon Observatory-2 satellite, launched by NASA on July 2, 2014, is the first satellite dedicated to monitoring atmospheric CO2 concentrations. OCO-2 operates in a sun-synchronous orbit at an altitude of 705 km and measures absorption spectra at wavelengths of 0.76 µm, 1.61 µm, and 2.06 µm. The 0.76 µm wavelength is used to acquire cloud and aerosol cover information, while the 1.61 µm and 2.06 µm wavelengths are used to obtain CO2 column concentrations. OCO-2 data are bias-corrected using the ACOS v10r Lite algorithm and include quality flags. These high-precision global CO2 concentration data provide crucial support for studying the global carbon cycle and climate change.
2) OCO-3 [19]: Designed by NASA’s Jet Propulsion Laboratory, the OCO-3 CO2 measurement instrument was launched into space aboard the International Space Station on May 4, 2019. OCO-3’s hardware performance is similar to that of OCO-2 but includes an added two-axis pointing mirror, enabling more precise monitoring of specific areas. This design gives OCO-3 greater observational flexibility, allowing it to capture CO2 variations in key areas such as cities and forests. OCO-3 data not only improve atmospheric models but also enhance the accuracy of greenhouse gas emission estimates.
3) GOSAT [20]: The Greenhouse Gases Observing Satellite, developed by the Japan Aerospace Exploration Agency (JAXA), is the world’s first satellite dedicated to monitoring major greenhouse gases like CO2 and methane. It was launched on January 23, 2009, and operates in a sun-synchronous orbit at an inclination of 98° and an altitude of about 666 km. GOSAT’s onboard greenhouse gas monitoring instrument uses Fourier transform spectroscopy. Although GOSAT’s spatial resolution is not as high as that of OCO-2 and OCO-3, its temporal resolution is higher, allowing it to better capture temporal trends in CO2. GOSAT provides valuable long-term greenhouse gas monitoring data, offering essential information for climate change research and policy-making.
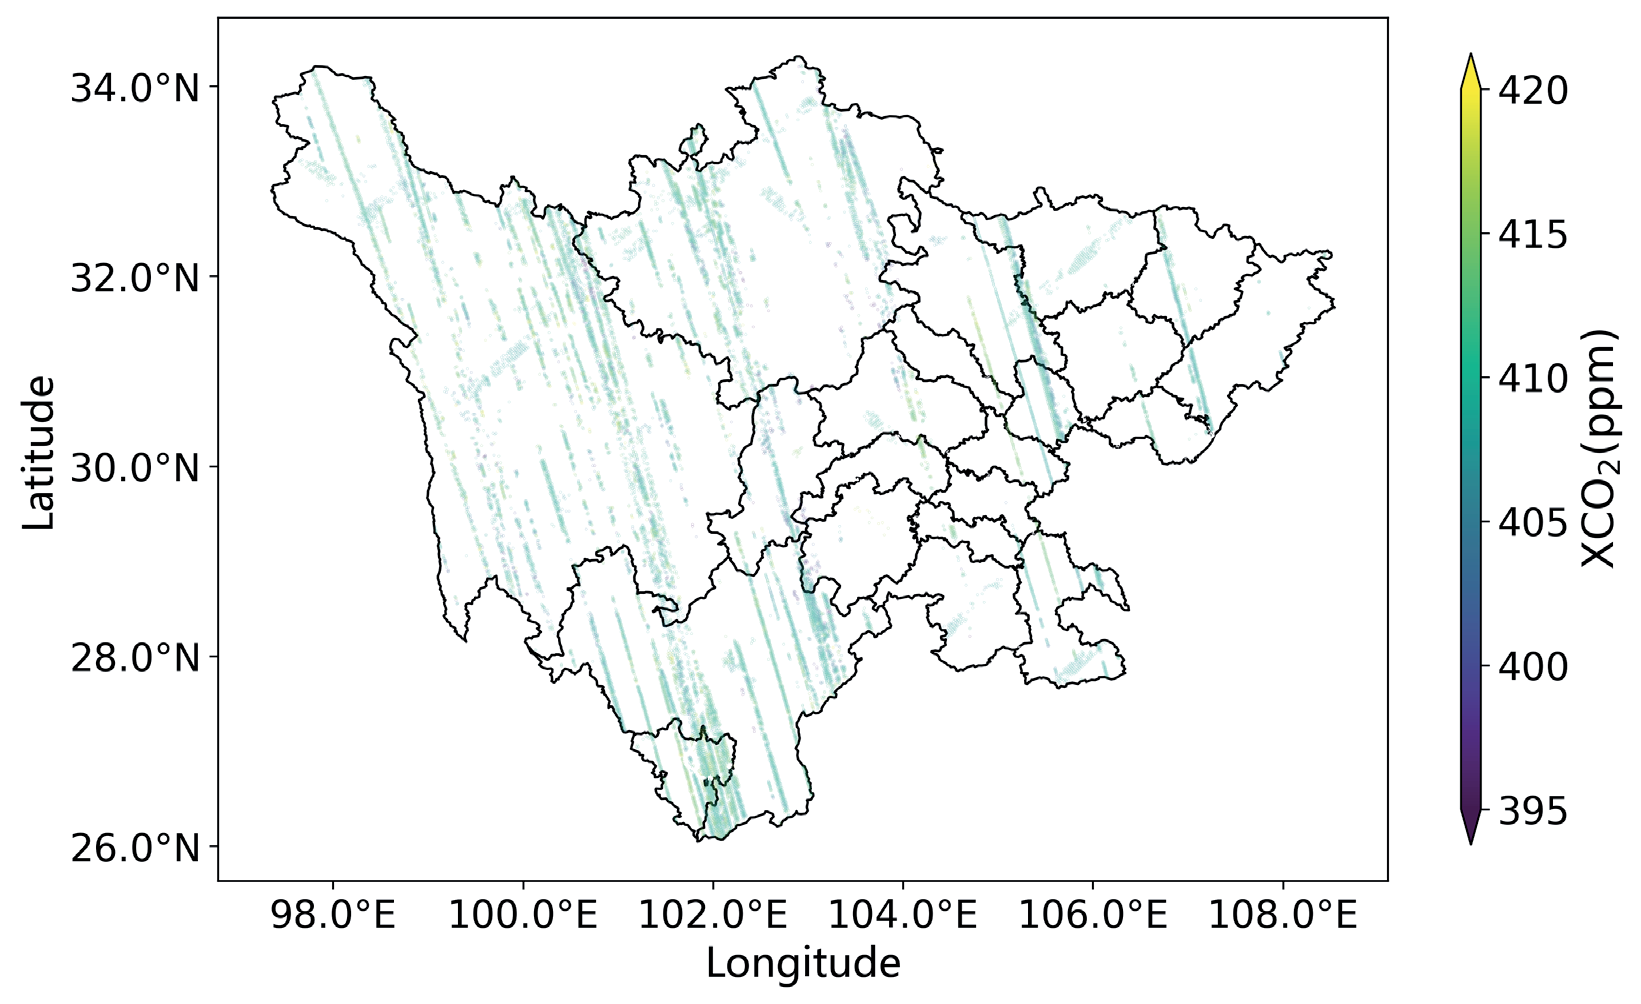
This paper utilizes the XCO2 data monitoring results from OCO-2, OCO-3, and GOSAT [21, 22]. The data processing method involves bilinear interpolation, where the new value of a grid cell is calculated based on the distance-weighted average of the surrounding four neighboring pixels. This process resamples the carbon satellite monitoring data from its original resolution to a 0.01°×0.01° (approximately 1 km×1 km) grid (see Fig. 2). As shown in Fig. 2, even when combining data from all three satellites over an entire year, the existing monitoring data still fails to achieve high-resolution spatiotemporal distribution coverage of XCO2. There are substantial gaps in the grid coverage, making it challenging to provide sufficient support for local carbon reduction and emission mitigation strategies.
Environmental Covariate Data
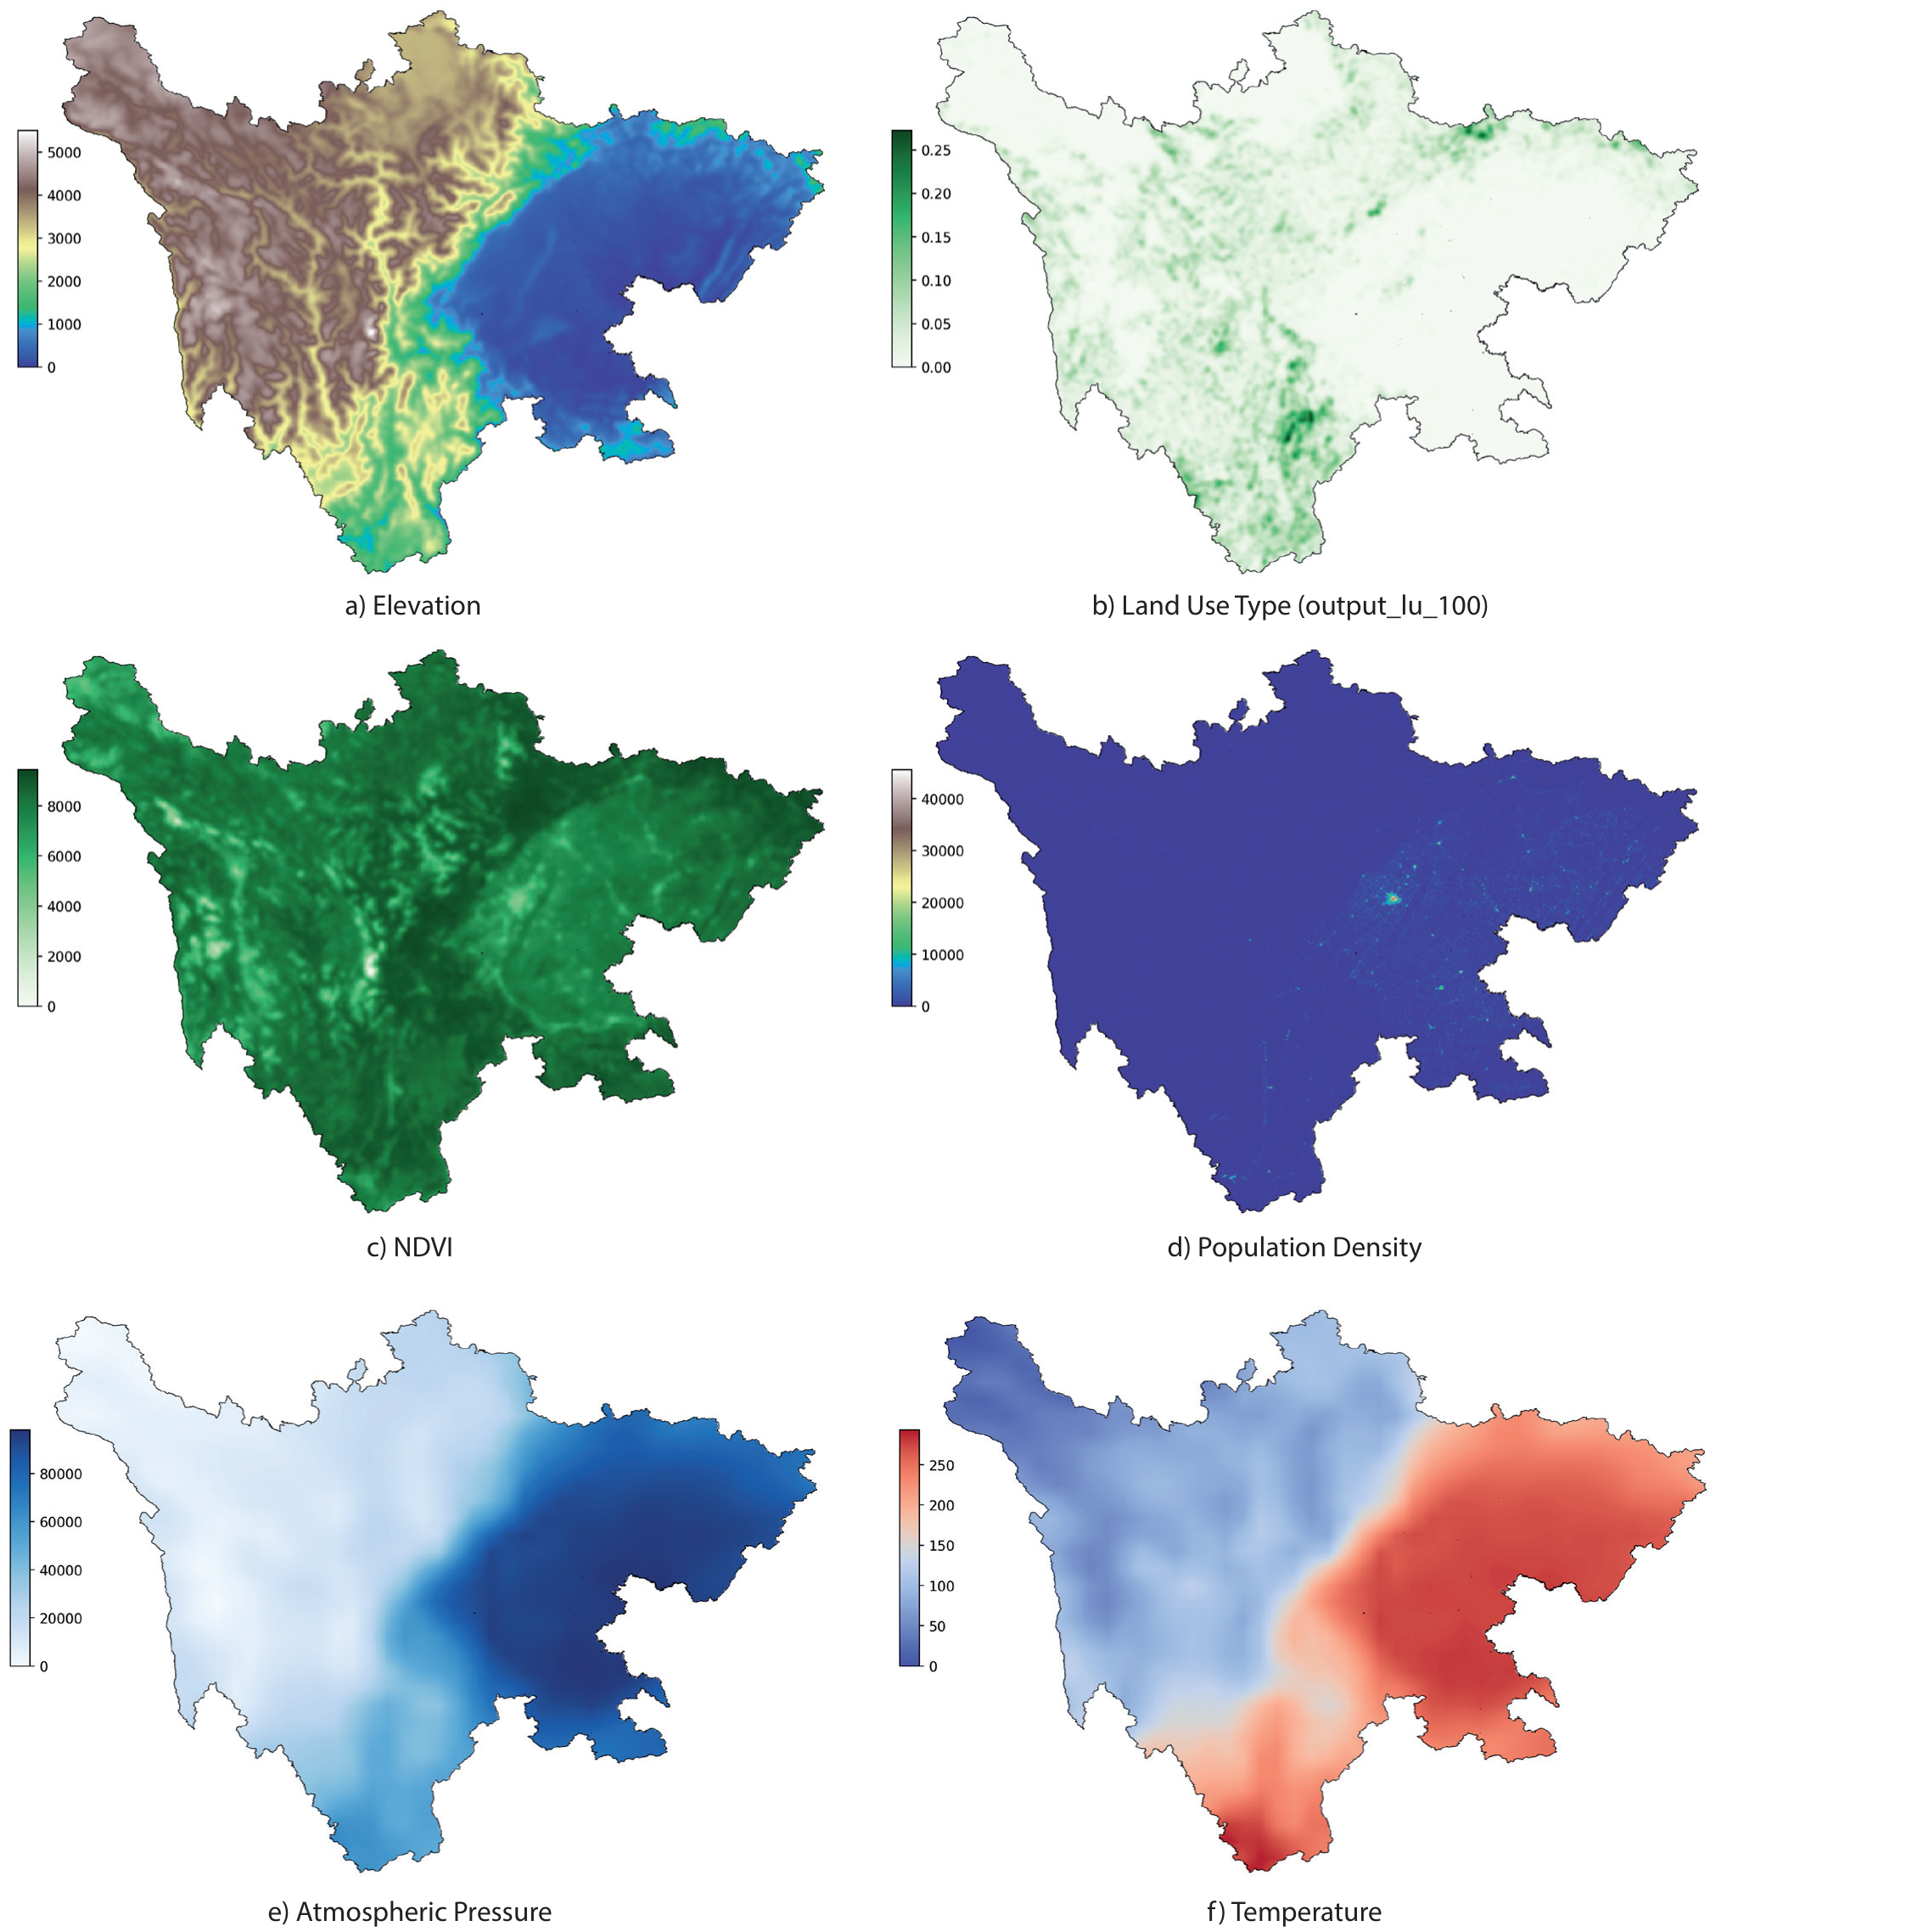
To construct an accurate high-resolution spatiotemporal distribution model for XCO2, the research team has collected various environmental covariate data, including meteorological data, elevation, Normalized Difference Vegetation Index (NDVI), population density, and land use types, as shown in Table 2.
1) Meteorological Data [23]: Sourced from the European Centre for Medium-Range Weather Forecasts (ECMWF) ERA5 reanalysis dataset, these data include key meteorological elements such as evaporation, precipitation, atmospheric pressure, relative humidity, sunshine duration, temperature, and wind speed, comprehensively reflecting the climatic conditions of the study area.
2) Elevation Data [24]: Provided by the Shuttle Radar Topography Mission (SRTM) of the National Aeronautics and Space Administration (NASA), ensuring the accuracy of terrain features; see Fig. 3a).
3) Normalized Difference Vegetation Index (NDVI) Data [25]: Obtained from NASA’s Terra and Aqua satellites, using the MOD13Q1 and MYD13Q1 datasets. These data reflect vegetation cover, aiding in the analysis of the ecological environment in the study area; see Fig. 3c).
4) Population Density Data [26]: Sourced from the Socioeconomic Data and Applications Center (SEDAC), providing detailed information on population distribution; see Fig. 3d).
5) Land Use Type Data [27]: Provided by the European Space Agency (ESA), covering major land use types in Sichuan Province, including cropland, forest, orchard, mountain, urban areas, and water bodies; see Fig. 3b).
Table 2.
Environmental covariate variables information from 2015 to 2022.
6) Additional Data: Collected from various sources, including regional Gross Domestic Product (GDP), population numbers, and carbon sequestration data for different cities and prefectures in Sichuan Province from 2015 to 2022. These data are obtained from the Sichuan Statistical Yearbook and NASA’s global Net Primary Productivity (NPP) data products; see Fig. 3e–f).
To enhance the model’s training and prediction capabilities, all collected satellite XCO2 data and various environmental covariate data were spatially resampled using appropriate methods and reallocated to a predefined 1-kilometer grid. This high-resolution spatial resampling method ensures data consistency and accuracy, laying a solid foundation for establishing a high-resolution spatiotemporal distribution model for XCO2, with the expectation of significantly improving model accuracy.
Experimental
ResNet-LSTM Model
In this study, a deep learning model based on ResNet-LSTM is proposed to achieve high-resolution spatiotemporal reconstruction of multi-source satellite XCO2 data. This model utilizes the spatial feature extraction capability of ResNet (Residual Network) and the temporal dynamics-capturing ability of LSTM (Long Short-Term Memory Network) to effectively fuse and fill in the multi-source satellite data. The specific construction process of the model is as follows:
Let X denote the XCO2 data and E denote the environmental covariate data, where each variable’s data matrix is:
Where M and N represent the number of rows and columns of the grid, T represents the number of time steps, and K represents the number of environmental covariates.
ResNet Feature Extraction
ResNet is a convolutional neural network that solves the gradient vanishing problem in deep networks by introducing residual blocks. Each residual block consists of two convolutional layers and a skip connection, with the output defined as:
Where W1 and W2 are convolution kernel weight matrices, b1 and b2 are biases, and σ is the activation function (e.g., ReLU).
In this study, ResNet is used to extract spatial features from the input data. Specifically, the input data X and E are passed through multiple convolutional layers and residual blocks to obtain high-dimensional spatial feature representations:
LSTM Temporal Modeling
LSTM is an improved recurrent neural network (RNN) that has memory cells and gating mechanisms to effectively handle long-term dependencies. The LSTM computation process includes input, forget, and output gates, defined as follows:
Where 𝑊𝑖, 𝑊𝑓, 𝑊𝑜, 𝑊𝐶 are weight matrices, 𝑏𝑖, 𝑏𝑓, 𝑏𝑜, 𝑏𝐶 are biases, 𝜎 is the activation function (e.g., sigmoid), Tanh is the hyperbolic tangent function, and ℎ𝑡 and 𝐶𝑡 represent the hidden state and cell state, respectively.
In this study, LSTM is used to model the temporal dynamics of the spatial features extracted by ResNet:
Model Fusion and Prediction
The spatial features extracted by ResNet and the temporal features extracted by LSTM are fused to obtain the final high-resolution XCO2 spatiotemporal distribution predictions:
Where dense denotes a fully connected layer that outputs the prediction results through linear transformation and activation functions.
Model Training and Validation
During model training, mean squared error (RMSE) is used as the loss function to optimize the model parameters. The dataset is split into training and validation sets, and cross-validation is used to evaluate the model’s performance.
Where 𝑦𝑖 and
In addition, a holdout method is employed to assess the performance of the XCO2 gap-filling model. The holdout method involves dividing the dataset D into two mutually exclusive subsets based on certain criteria, one of which is used as the training set S and the other as the validation set T, such that D = S ∪ T and S ∩ T = 0. After training the model using the training set, the validation set is utilized to evaluate its test error, serving as an assessment of the model’s performance.
High-Resolution XCO2 Spatiotemporal Distribution Method
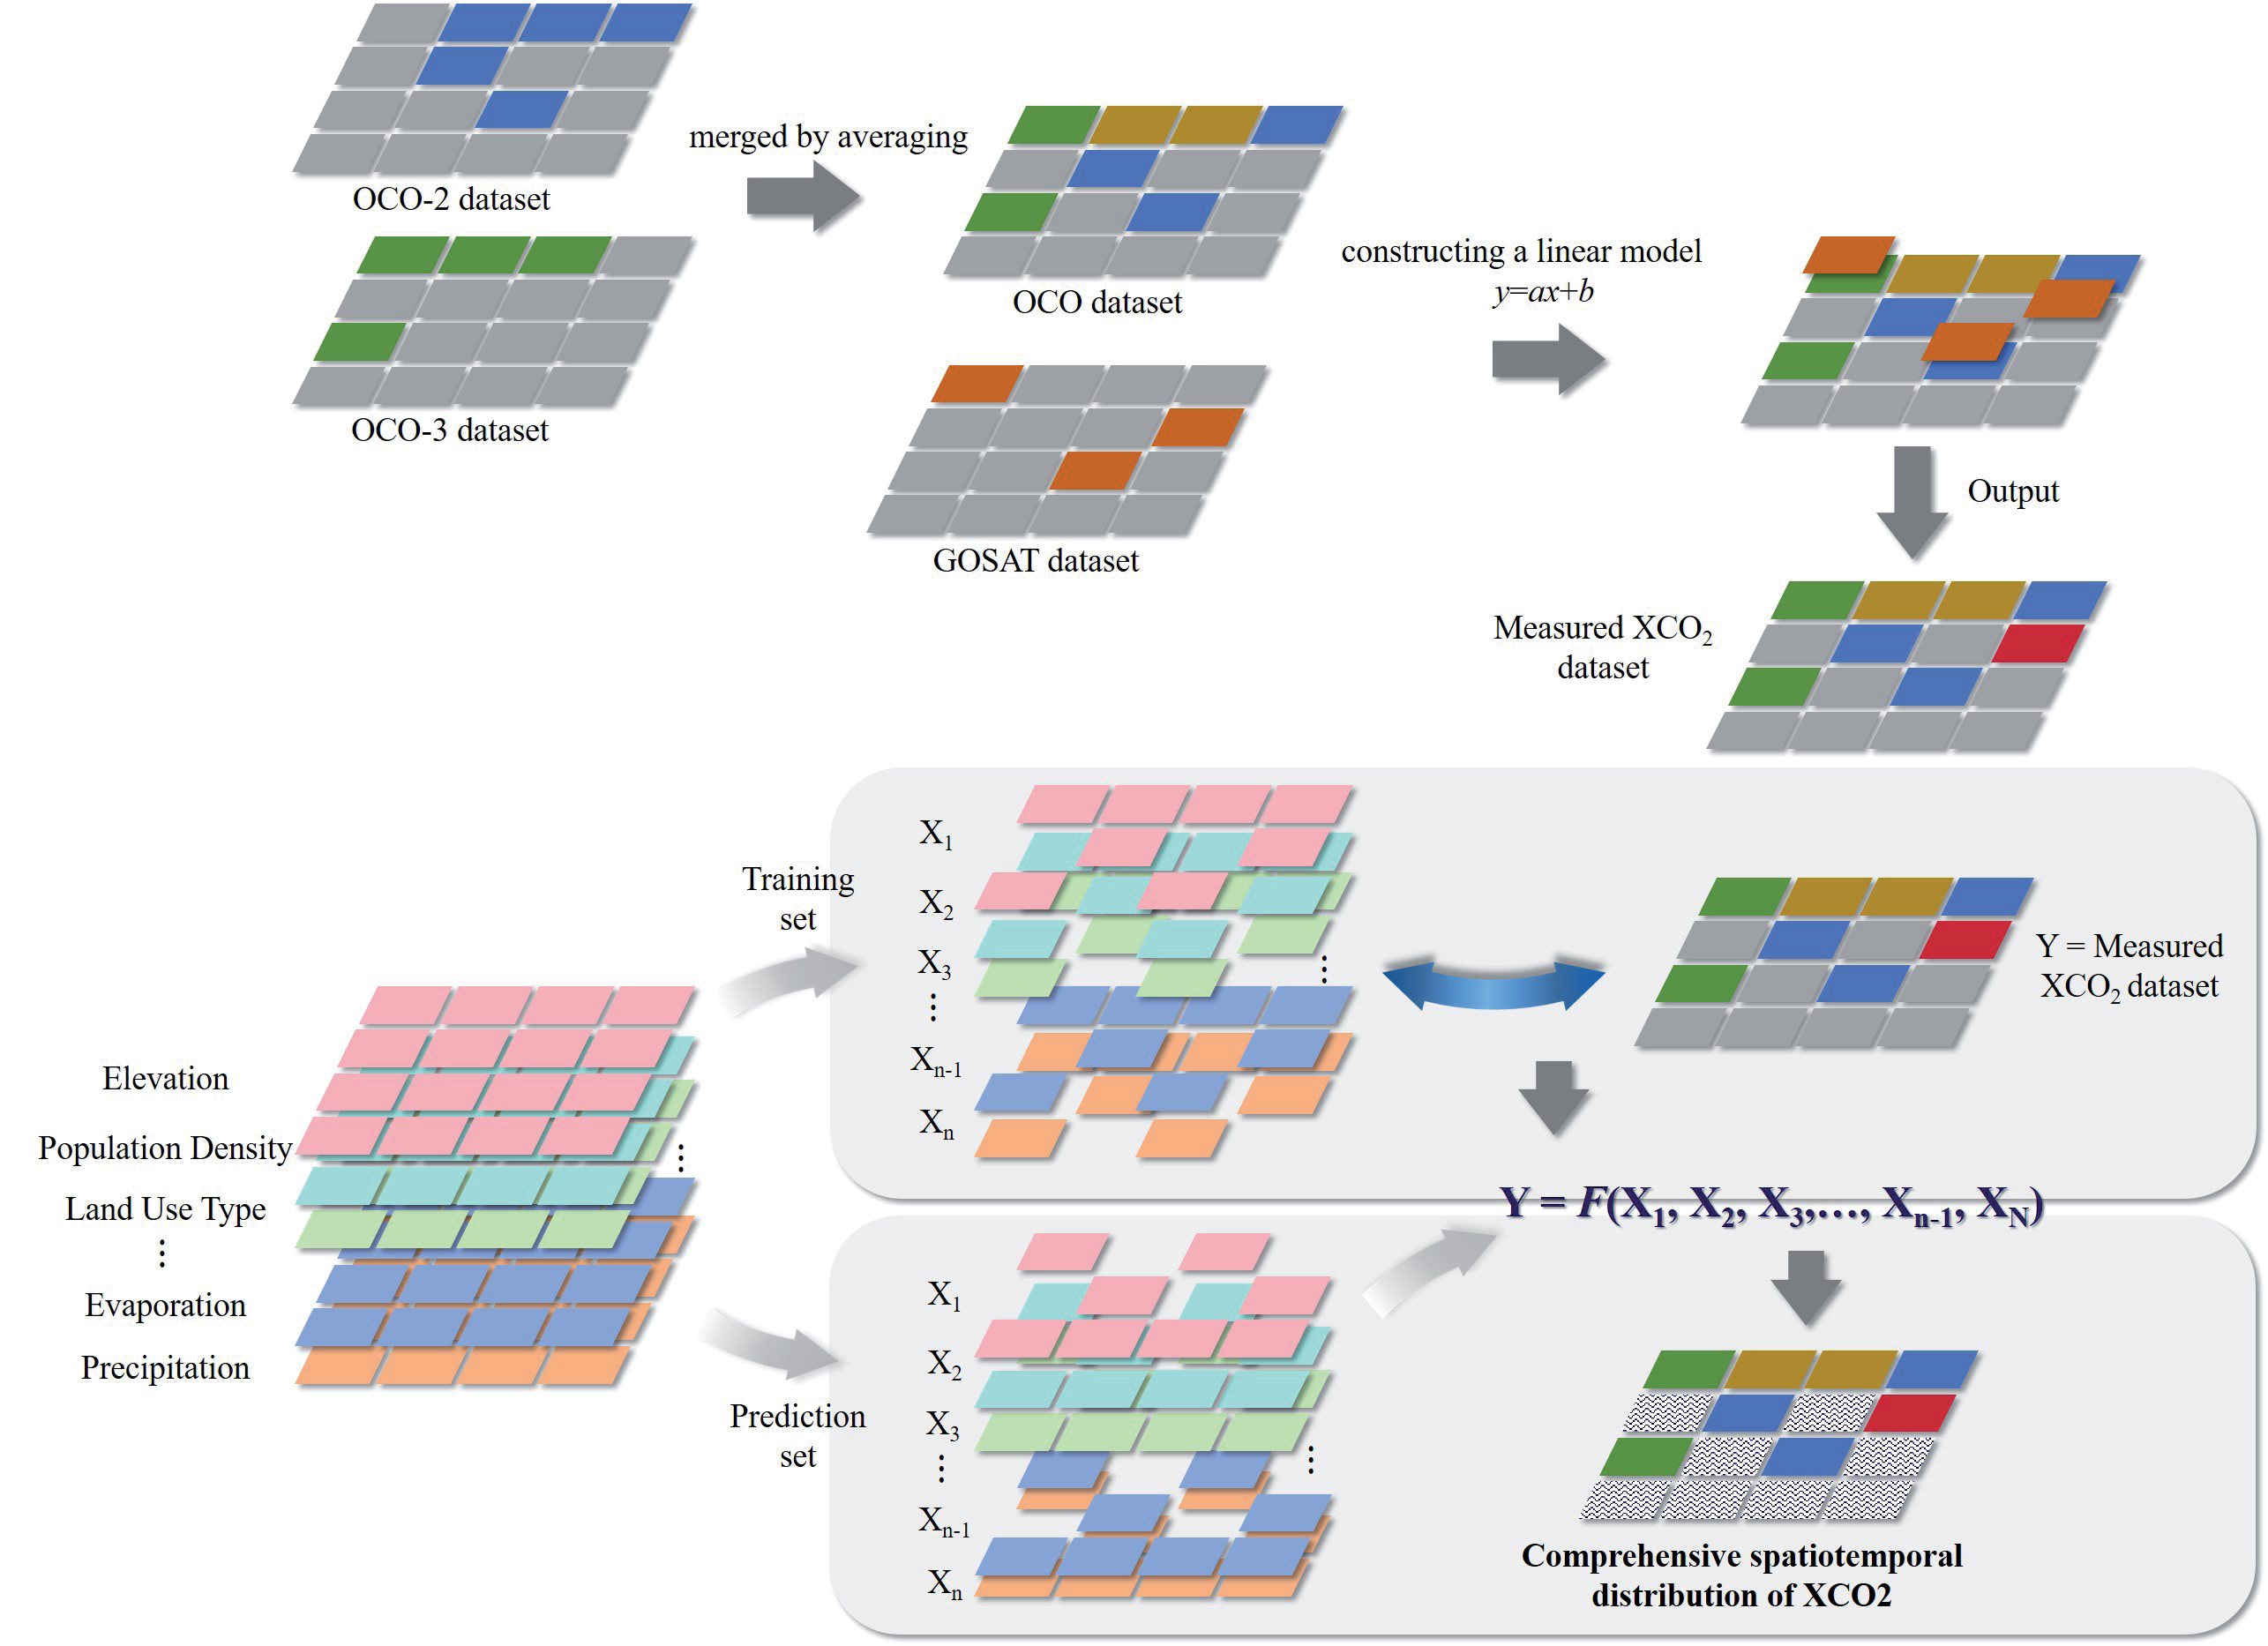
This study aims to reconstruct the spatiotemporal distribution of XCO2 in Sichuan Province through the fusion of multi-source satellite data and deep learning models. The detailed methodology is as follows (see Fig. 4).
Data Processing and Fusion
1) Merging OCO-2 and OCO-3 Data: First, we merge the data from OCO-2 and OCO-3 to obtain the OCO dataset. Since OCO-2 and OCO-3 use the same retrieval algorithm to calculate XCO2, we average the grid cells with observations from both satellites to ensure data consistency and reliability.
2) Fusion of OCO and GOSAT Data: Considering the spatiotemporal sparsity of GOSAT data and the different algorithms used by OCO and GOSAT, we adopt a linear model for their fusion. The specific steps are as follows: For samples with observations from both OCO and GOSAT, use GOSAT as the independent variable and OCO as the dependent variable to establish a linear model. Use the established linear model to input GOSAT data for prediction, obtaining the prediction set (GO). Merge the prediction set (GO) with the OCO data to obtain the nationwide satellite XCO2 training dataset.
Model Training and Prediction
3) Selection of Environmental Covariates: Select a series of environmental covariates related to the distribution of XCO2, such as temperature, humidity, precipitation, vegetation index, etc. These covariates can be obtained from various sources, such as meteorological stations and remote sensing images.
4) Training the ResNet-LSTM Model: Using the nationwide satellite XCO2 training dataset, train the ResNet-LSTM model with XCO2 as the dependent variable and environmental covariates as independent variables. ResNet (Residual Network) effectively extracts high-dimensional spatial features, while LSTM (Long Short-Term Memory) captures long-term dependencies in time series data. Combining these two models allows for full utilization of spatiotemporal information, improving prediction accuracy.
Spatiotemporal Distribution Reconstruction
5) Reconstructing the Spatiotemporal Distribution of XCO2 in Sichuan Province: Apply the trained ResNet-LSTM model to Sichuan Province, input the environmental covariate data of Sichuan, and predict the spatiotemporal distribution of XCO2. The prediction results from the model provide a comprehensive spatiotemporal distribution map of XCO2 for Sichuan Province.
Results and Discussion
Statistical Analysis of Satellite Observation Data
Table 3 presents statistical information on XCO2 concentrations and sample sizes retrieved by multiple satellites (OCO-2, OCO-3, and GO-SAT) in China and Sichuan Province during different quarters.
Sample Sizes: In terms of sample sizes, the data volume in China is significantly larger than in Sichuan Province. For example, OCO-2 has over 90 million samples each quarter in China, while Sichuan Province has tens of thousands of samples. OCO-3 and GO-SAT show similar trends in sample sizes.
Quarterly Changes: OCO-2: In China, the XCO2 concentration is relatively higher in the first quarter (408.1±50.9 ppm) and the second quarter (409.8±51.4 ppm), while it decreases in the third quarter (407.9±48.8 ppm) and the fourth quarter (407.3±49.6 ppm). In Sichuan Province, the concentration is highest in the second quarter (412.4±53.7 ppm) and lower in other quarters, especially in the fourth quarter (406.6±53.3 ppm). OCO-3: Data from OCO-3 show that XCO2 concentrations reach their peak in the second quarter (417.0±16.7 ppm for China and 419.8±32.8 ppm for Sichuan Province) and decrease in the third quarter. GO-SAT: GO-SAT data indicate that XCO2 concentrations in China are highest in the first quarter (419.0±8.6 ppm) and lowest in the third quarter (413.0±9.3 ppm). Sichuan Province shows a similar trend, with the highest concentration in the first quarter (419.9±7.9 ppm) and the lowest in the third quarter (416.2±2.2 ppm).
Model Validation and Performance Evaluation
1) Model Validation: The structure of the ResNet-LSTM model is detailed in Table 4, which includes the types of layers, input/output dimensions, and key hyperparameters. The convolutional layers employ a kernel size of 3 with stride adjustments across residual blocks to progressively downsample the sequence, allowing the model to capture both local and high-level patterns. The LSTM layer with 128 hidden units and 2 layers captures temporal dependencies, incorporating a dropout rate of 0.5 to mitigate overfitting.
In terms of training parameters, Table 5 lists the key configurations. The model is trained using a batch size of 1024 with an initial learning rate of 0.001. A scheduler is used to reduce the learning rate when performance plateaus, while early stopping ensures the model does not overfit. This optimization of hyperparameters effectively balances feature extraction and temporal modeling, resulting in significant performance improvements.
Table 3.
Statistical information of XCO2 concentrations and samples retrieved by multi-source satellites in China and Sichuan Province.
Table 4.
Model Structure Parameters.
Table 5.
Training Parameters.
The original input data has 46 features. To make it suitable for 1D convolution, we reshape it into a tensor with dimensions [batch_size, 1, n_features], where the ‘1’ represents a single input channel. This transformation ensures that the data is properly aligned for processing through the convolutional layers.
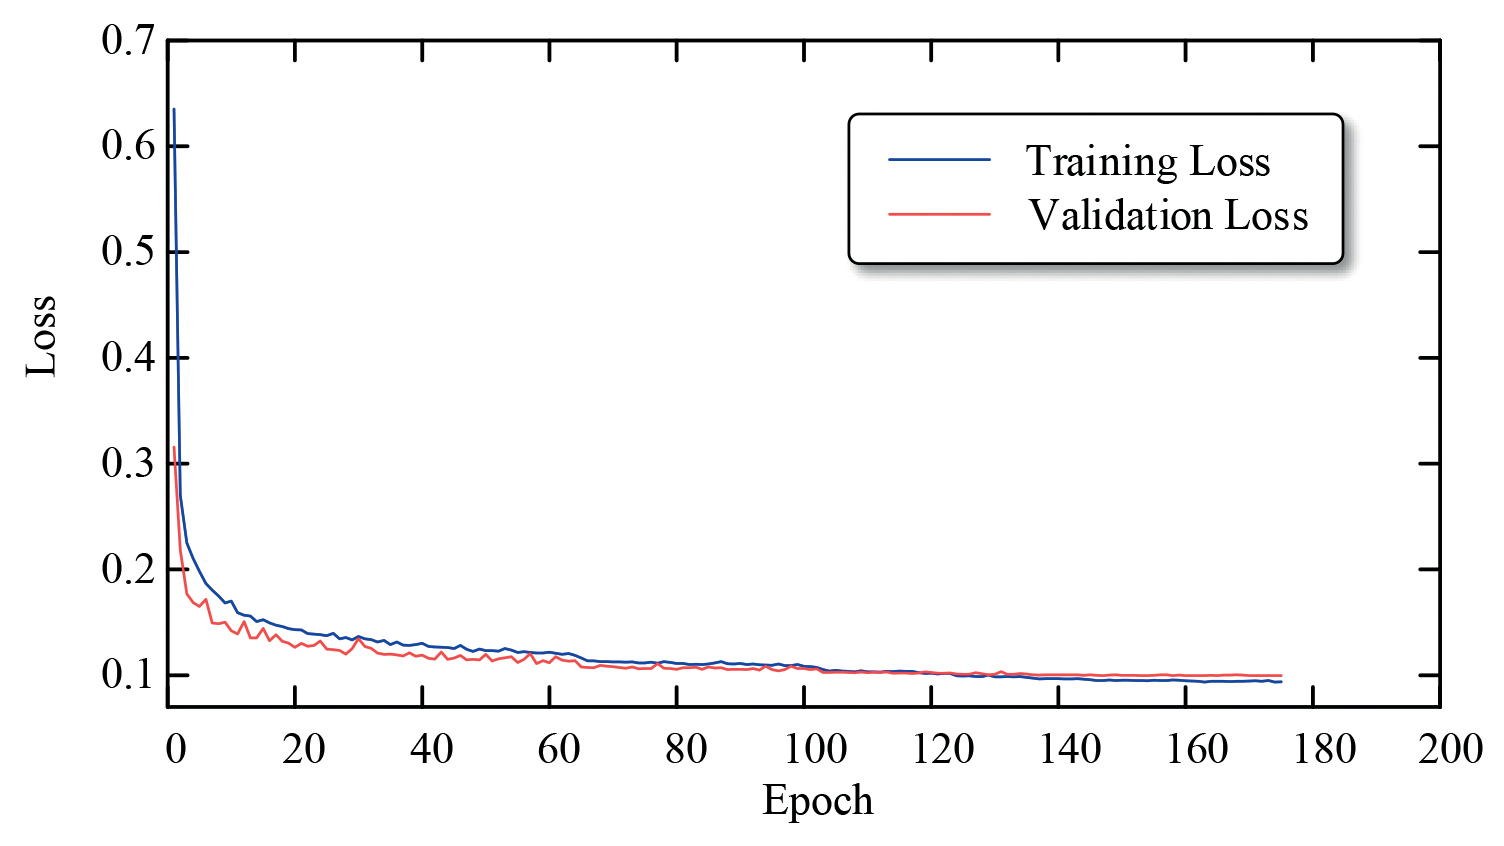
The training and validation results of the ResNet-LSTM model are shown in Fig. 5. The changes in training loss and validation loss curves during the training process. In the initial stage, the loss values were high due to the model’s insufficient learning of the data patterns. As training progressed, the model gradually learned effective information from the data, and the loss values rapidly decreased and eventually stabilized. This indicates that the model’s performance has reached an optimal state without significant overfitting, which is crucial as overfitting can lead to good performance on training data but poor performance on new data.
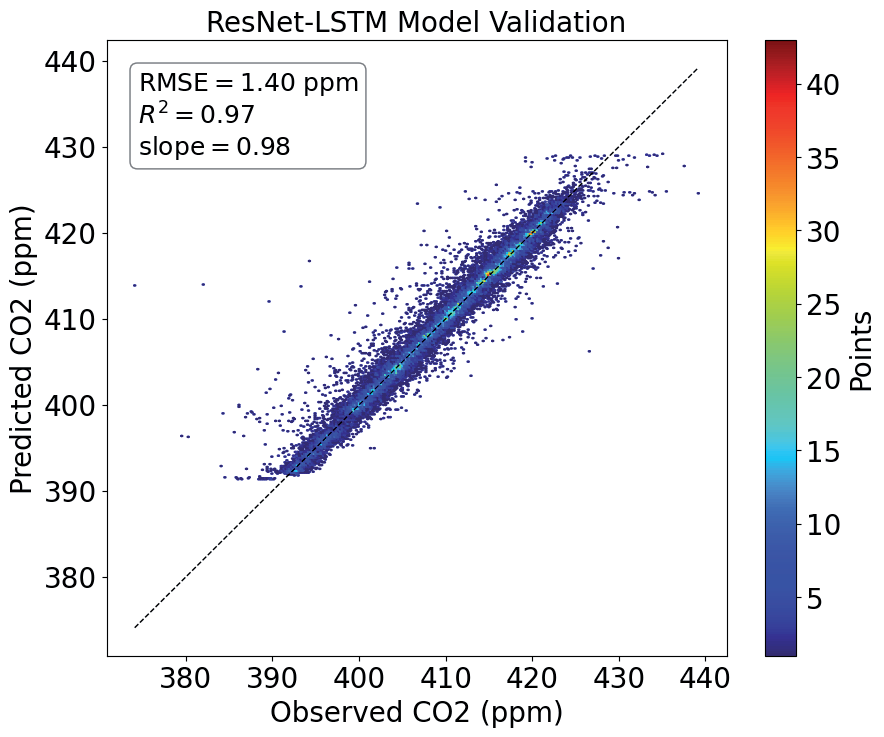
Fig. 6 shows the scatter plot of the predicted versus actual values on the validation set. Most data points are distributed along the ideal diagonal line, indicating small errors. Specifically, the RMSE on the validation set is 1.40 ppm, the R² is 0.97, and the slope is 0.98. These metrics indicate that the model has high prediction accuracy and stability. A low RMSE indicates high prediction precision, while the R² and slope close to 1 indicate a strong linear relationship and good proportionality between the predicted and actual values.
In summary, the combined application of these two validation strategies and multiple evaluation metrics allows us to comprehensively assess the performance of the ResNet-LSTM model under different spatial and temporal conditions, ensuring high accuracy and stability under various complex scenarios. The results demonstrate that the model has good adaptability and reliability in handling the uncertainties and complexities of real-world data.
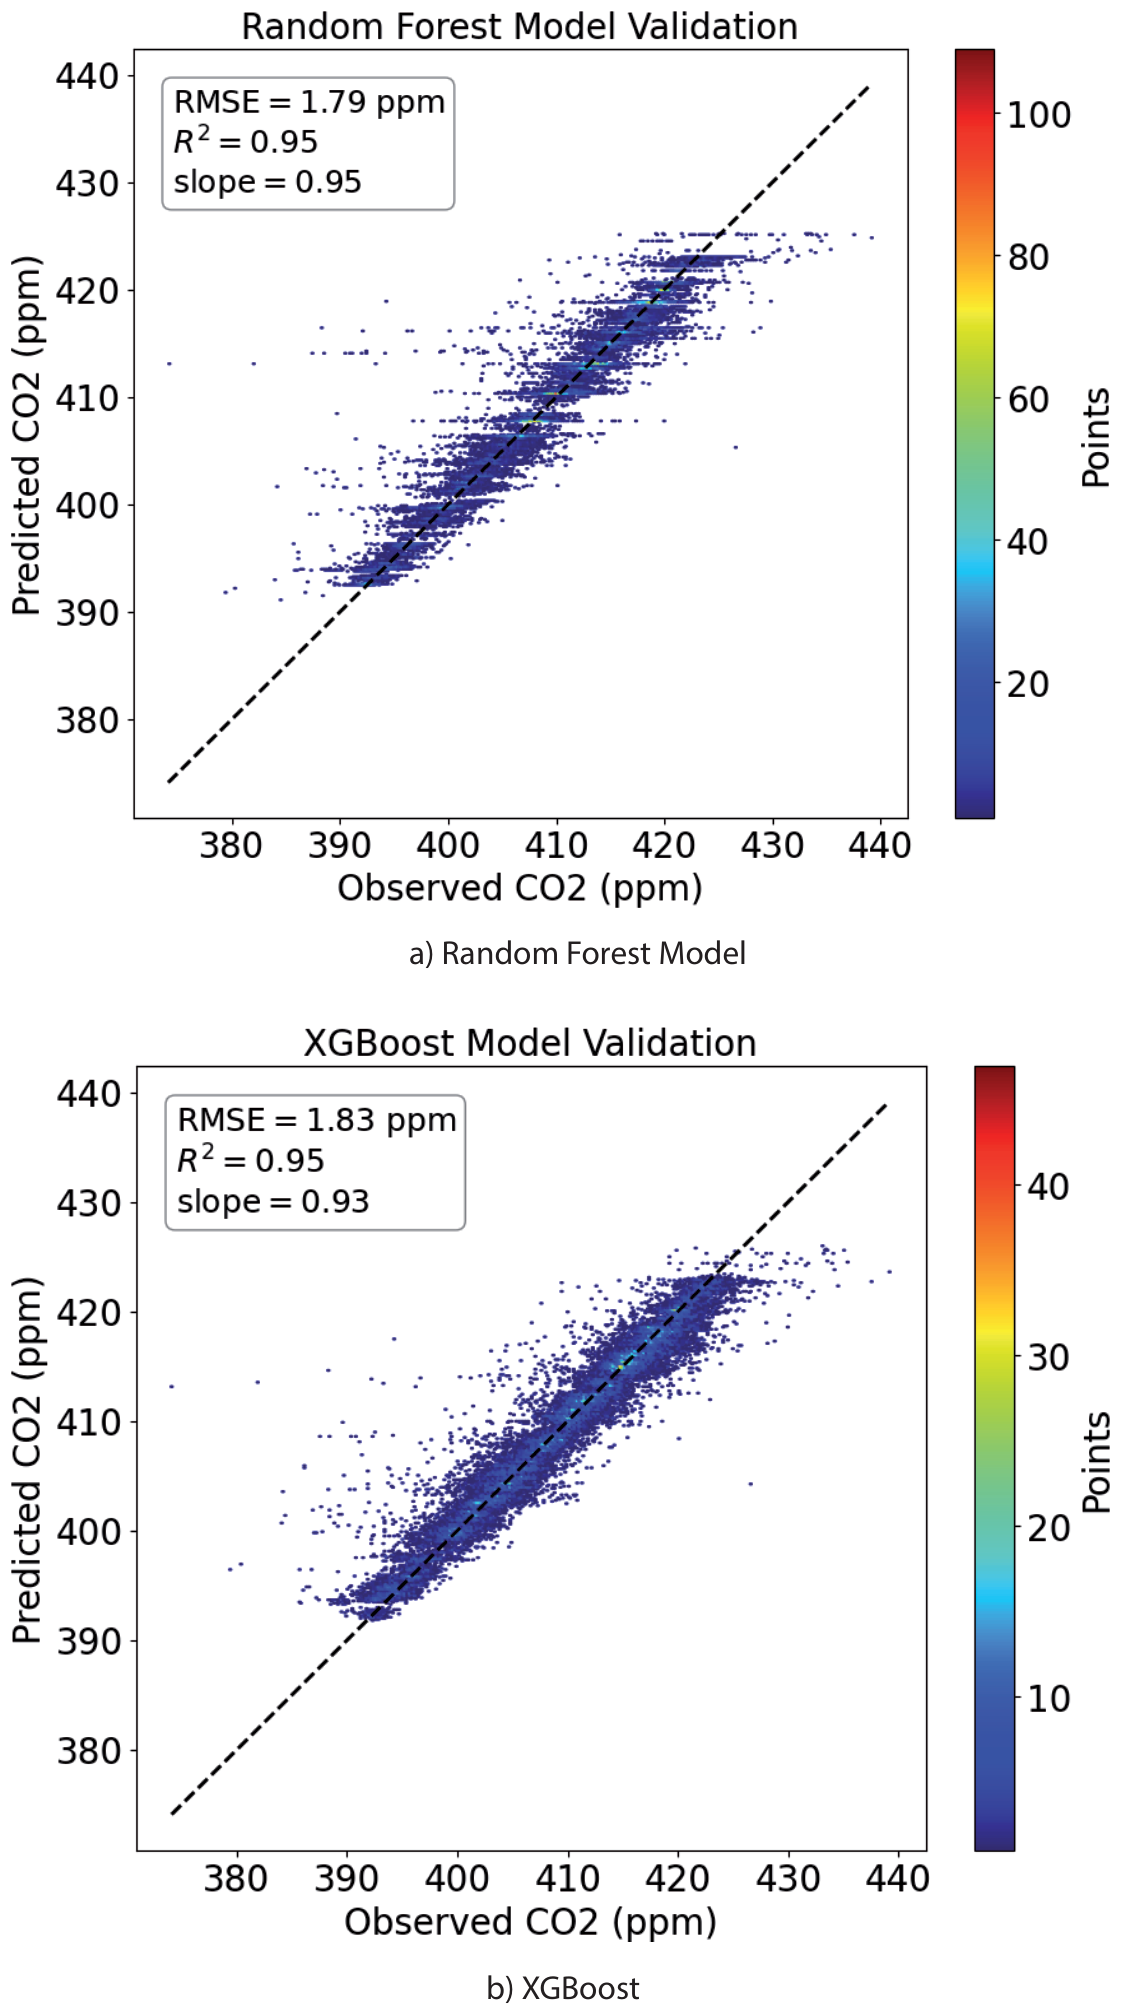
2) Performance Evaluation: To further validate the performance of the ResNet-LSTM model, this paper introduces Random Forest and XGBoost as strong baseline models due to their proven effectiveness with structured data.
As shown in Fig. 7, the Random Forest model achieved an RMSE of 1.40 ppm, an R² of 0.95, and a slope of 0.95 on the validation set, while XGBoost achieved an RMSE of 1.83 ppm, an R² of 0.95, and a slope of 0.93 on the validation set. Compared to the ResNet-LSTM model, both the RMSE, R², and slope on the validation set showed a certain degree of decline, indicating that the ResNet-LSTM model has higher predictive accuracy and stability, making it more suitable for high-precision spatiotemporal reconstruction of XCO2 data.
While advanced deep learning models may yield even better accuracy, we found that the ResNet-LSTM model achieved a satisfactory performance level for this study, and thus, we did not explore more complex models.
Analysis of the Spatiotemporal Distribution of XCO2 in Sichuan Province
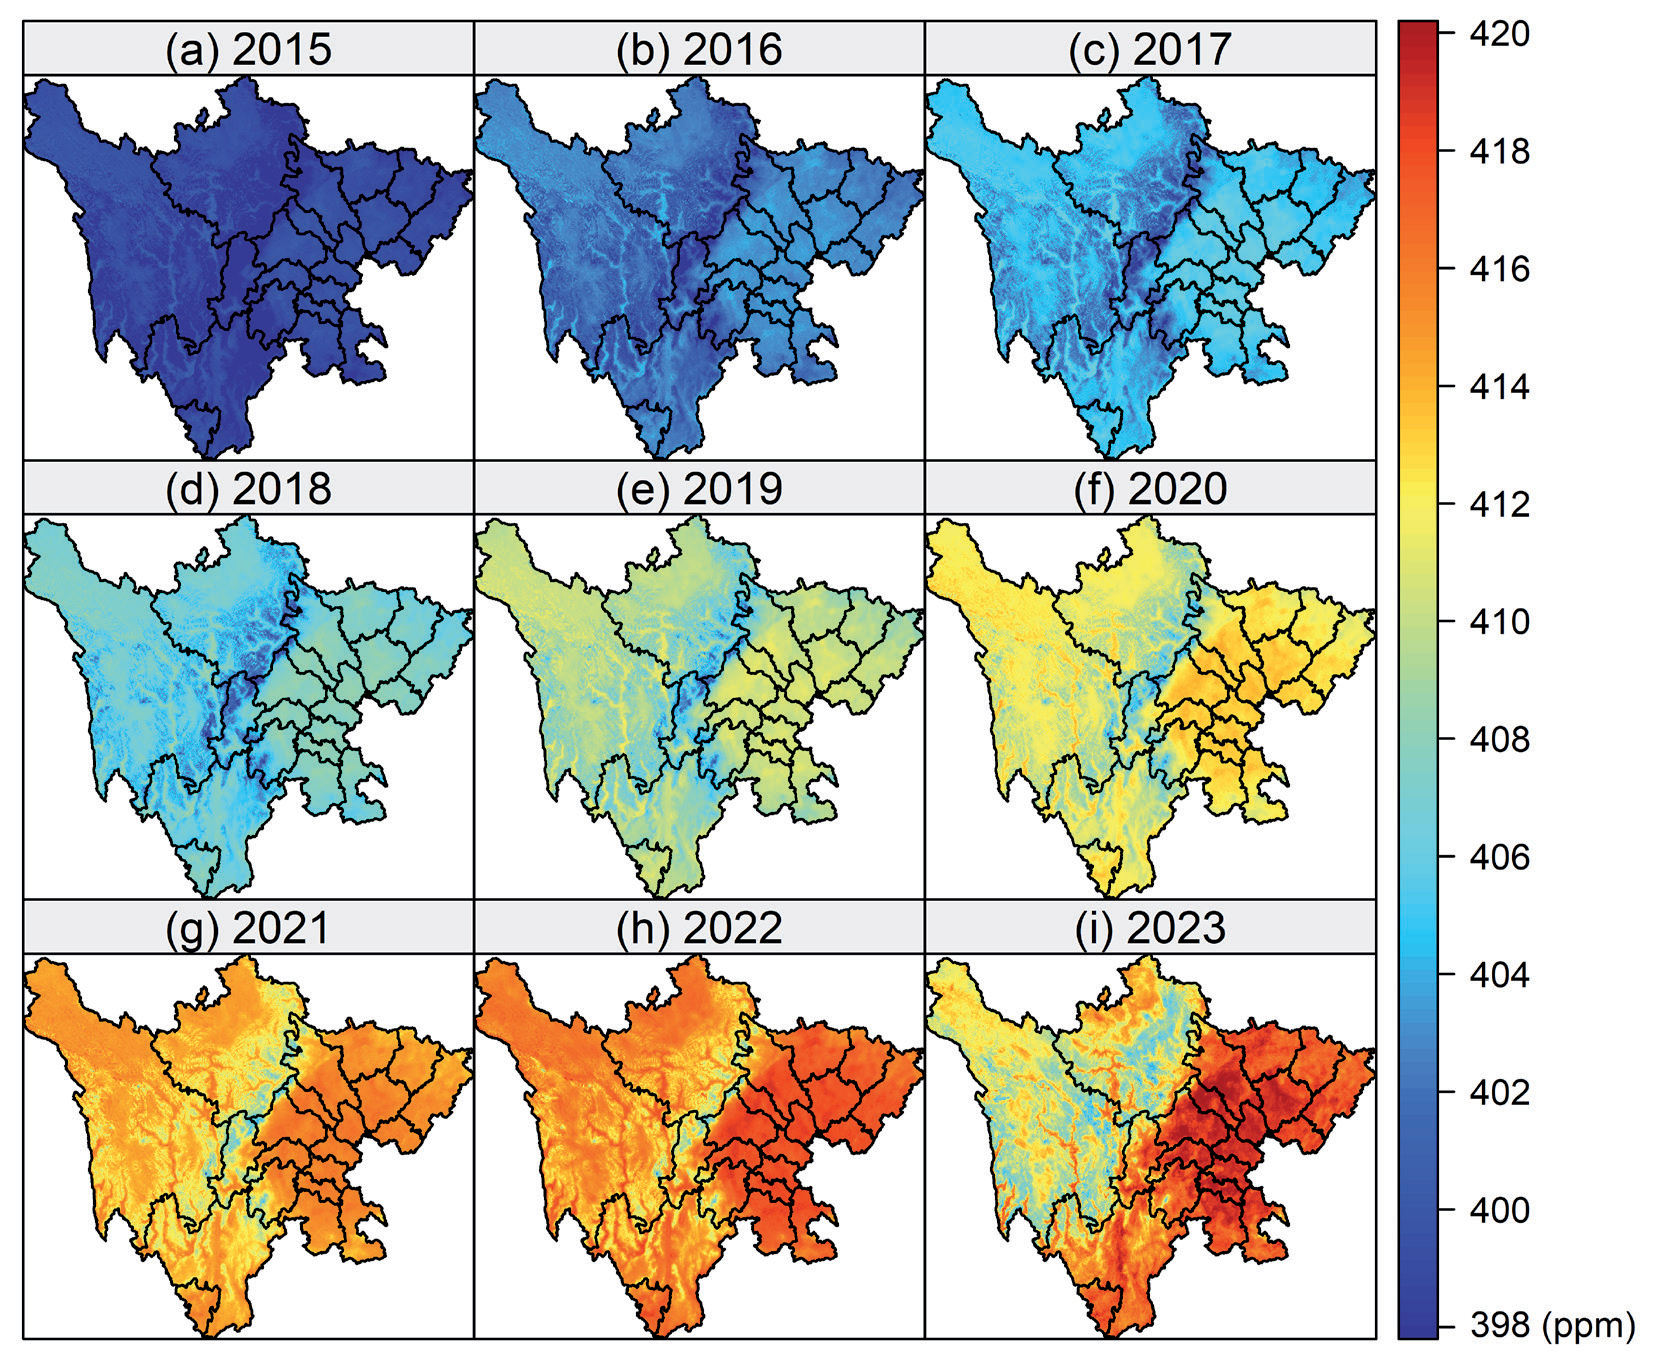
Based on the established ResNet-LSTM model, a daily average XCO2 concentration dataset with a 1 km grid resolution for Sichuan Province from 2015 to 2022 was created, providing high-resolution spatial and temporal information (see Fig. 8).
During the period from January 1, 2015, to December 31, 2022, the average XCO2 concentration in Sichuan Province showed a continuous upward trend (see Table 6). In 2015, the average XCO2 concentration was 398.9 ppm, which increased to 416.6 ppm by 2022, with an overall average concentration of 408.3 ppm. During this period, the annual average growth rate of XCO2 concentration in Sichuan Province was 2.21 ppm/year.
Further analysis revealed variations in the growth rate of XCO2 concentration between different years. From 2015 to 2018, the average growth rate of XCO2 concentration in Sichuan Province was 2.04 ppm/year, while from 2019 to 2022, the average growth rate was 2.04 ppm/year. This indicates that although the overall XCO2 concentration is rising, the growth rate has slowed in recent years. This phenomenon could be attributed to various factors, including changes in economic development patterns, adjustments in industrial structure, and various policy measures taken by the government to reduce emissions.
The XCO2 concentration in Sichuan Province shows significant seasonal variations, as can be seen from the analysis of the seasonal average concentration data from 2015 to 2022 (Fig. 9). During this period, the XCO2 concentration in Sichuan Province is highest in spring, with an average of 409.7 ppm, and lowest in autumn, with an average of 406.3 ppm. The maximum concentration change within the seasons is 3.4 ppm.
Table 6.
Mean XCO2 spatial distribution in Sichuan (ppm) from 2015 to 2022.
| Year | Mean XCO2 spatial distribution in Sichuan (ppm) |
|---|---|
| 2015 | 398.92 |
| 2016 | 402.52 |
| 2017 | 404.93 |
| 2018 | 407.07 |
| 2019 | 409.72 |
| 2020 | 412.38 |
| 2021 | 414.57 |
| 2022 | 416.60 |
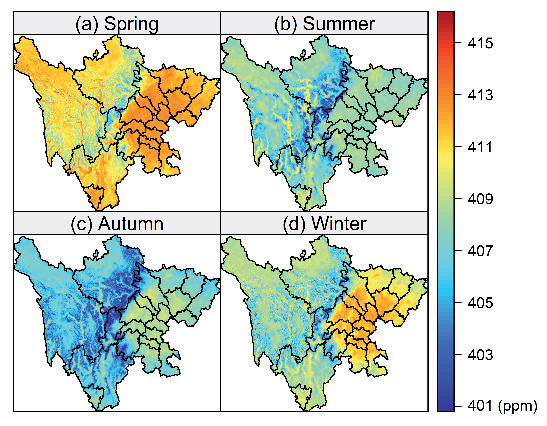
In winter, due to the reduction in vegetation coverage and the weakening of photosynthesis, the XCO2 concentration begins to rise. As winter approaches, many plants enter a dormant state, significantly reducing photosynthesis, while human activities continue to emit carbon, leading to a gradual increase in atmospheric XCO2 concentration.
Spring is the season when vegetation begins to regrow and plant activity starts to increase. However, the decomposition of organic matter in the soil accelerates at higher temperatures, and the respiration of vegetation intensifies, resulting in a continued rise in atmospheric XCO2 concentration. Although photosynthesis starts to increase in spring, the amount of CO2 absorbed is still insufficient to balance the emissions from vegetation and soil respiration, leading to the highest XCO2 concentration of the year.
Summer and autumn are the periods when vegetation growth is most vigorous and photosynthesis reaches its peak, effectively absorbing CO2 from the atmosphere. This results in significantly lower XCO2 concentrations in summer and autumn compared to spring and winter. Particularly in autumn, the enhanced photosynthesis and carbon sink capacity lead to the lowest XCO2 concentration of the year.
This trend of seasonal variation is consistent with the results of nationwide studies. National studies have also found that XCO2 concentration is higher in spring due to increased soil decomposition and vegetation respiration, while it is lower in summer and autumn due to robust photosynthesis.
Moreover, the geographical characteristics and climate conditions of Sichuan Province play a crucial role in these seasonal variations. Sichuan Province’s mountainous and plateau regions have complex climates and vegetation types, giving its carbon cycle processes unique characteristics. For instance, plants in high-altitude areas exhibit strong photosynthetic capabilities during the summer growing season, effectively absorbing atmospheric CO2.
In summary, the seasonal variation in XCO2 concentration in Sichuan Province reflects the dynamic balance between vegetation activity and soil respiration, revealing the impact of climate change and human activities on the regional carbon cycle. These findings are important for understanding the carbon cycle processes in Sichuan Province and nationwide and for formulating effective carbon emission control and environmental protection policies.
The monthly average variation of XCO2 concentration in Sichuan Province is significant (as shown in Fig. 10), exhibiting clear seasonal fluctuations. According to the observed data, XCO2 concentration starts to increase continuously from October each year, reaching its peak (410.2 ppm) in May of the following year. Subsequently, XCO2 concentration gradually decreases from June, reaching its lowest point (405.2 ppm) in September, with a monthly average fluctuation range of 5.0 ppm.
Spring (March, April, May): During spring, XCO2 concentration shows a continuous upward trend, rising from 408.9 ppm in March to 410.2 ppm in May. This upward trend may be related to the fact that plants are entering their growing season, with photosynthesis gradually increasing, although at this time the plants’ absorption has not yet fully offset anthropogenic CO2 emissions.
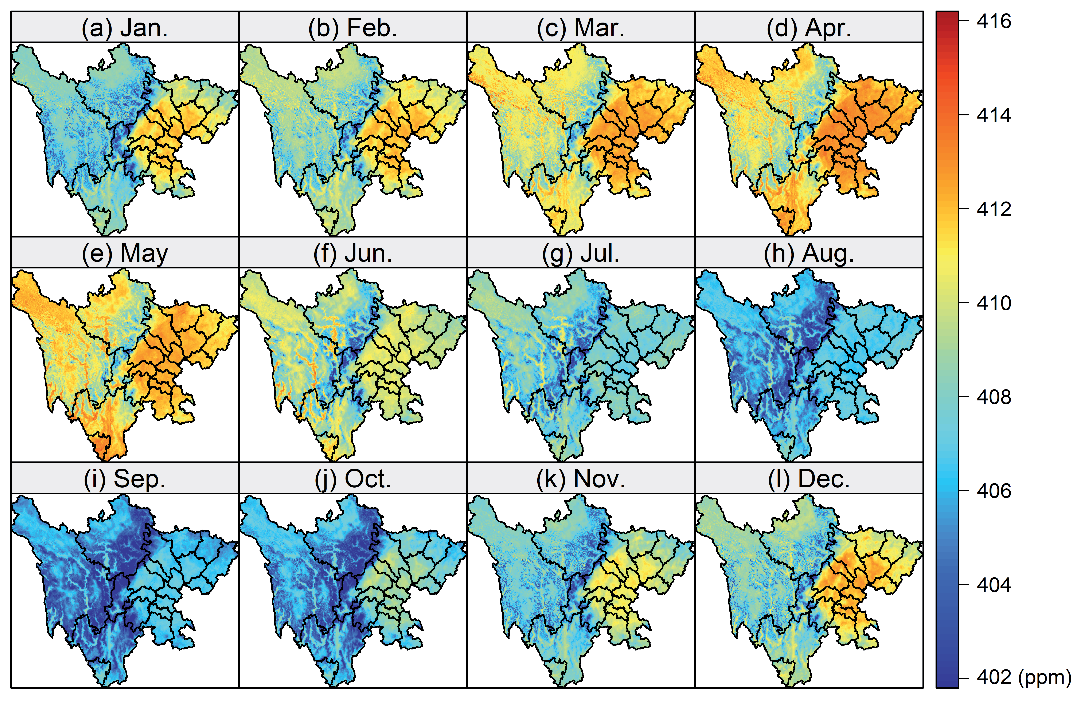
Summer (June, July, August): During summer, XCO2 concentration decreases significantly, from 408.7 ppm in June to 405.4 ppm in August. During this period, the photosynthesis of plants reaches its peak, absorbing a large amount of CO2, which reduces the concentration of CO2 in the atmosphere. Additionally, the high temperatures and longer daylight hours in summer also promote plant growth and CO2 absorption efficiency.
Autumn (September, October, November): In autumn, XCO2 concentration starts to increase again month by month, reaching 407.4 ppm in November. In autumn, plants gradually enter their dormant period, photosynthesis weakens, and CO2 absorption decreases. Meanwhile, human activities (such as agricultural and industrial emissions) continue to release CO2, causing the atmospheric CO2 concentration to gradually rise.
Winter (December, January, February): The changes in XCO2 concentration are relatively stable during winter. The concentration is lowest in January, at 407.0 ppm, and the concentrations in December and February are relatively close, at 408.1 ppm and 408.0 ppm, respectively. During winter, plants basically stop photosynthesis; CO2 absorption is weak, but due to the low temperatures, the processes of CO2 release and absorption are relatively slow, leading to small fluctuations in concentration.
These seasonal variations reflect the significant influence of plant growth cycles and human activities on the XCO2 concentration in Sichuan Province. Spring and autumn are transitional periods with increasing and decreasing trends in XCO2 concentration, respectively; summer is the peak period for photosynthesis, resulting in a significant decrease in concentration; while in winter, due to plant dormancy and the cold environment, the concentration changes are relatively stable.
Further studying these seasonal variations can better understand the dynamic processes of the regional carbon cycle and provide a scientific basis for formulating effective emission reduction strategies. For instance, enhancing afforestation and greening measures in spring and autumn to strengthen plants’ ability to absorb CO2, or implementing stricter emission control measures in winter to reduce anthropogenic CO2 emissions, is important for stabilizing atmospheric CO2 concentration.
Applicability of High-Resolution XCO2 Spatiotemporal Distribution Reconstruction
The ResNet-LSTM model developed in this study is designed to handle the spatiotemporal fusion of multisource satellite data for CO2 distribution. While the model was specifically trained and validated using data from Sichuan Province, it can be generalized and applied to other regions with similar datasets. Key factors for its application in different regions include the availability of satellite data such as XCO2 from sources like GOSAT, OCO-2, and OCO-3, as well as any region-specific atmospheric conditions, land use, and topographical features that may affect CO2 distribution.
To apply this model to other regions, the following steps would be necessary:
1) Data Availability: Ensuring that multi-source satellite data (e.g., XCO2 measurements) for the target region are available and that missing data can be filled similarly to the approach used in this study.
2) Model Adaptation: The ResNet-LSTM structure is versatile and can be retrained using region-specific data. This adaptability allows the model to learn the unique spatial and temporal CO2 distribution characteristics of other geographic areas, such as urban centers, forested regions, or coastal zones.
By following these steps, the model can provide high-resolution CO2 distribution reconstructions for regions beyond Sichuan, contributing to global efforts in carbon monitoring and supporting the development of localized emission reduction strategies. This flexibility underscores the model’s broader applicability in diverse environmental and geographical contexts.
Conclusions
This study constructs a ResNet-LSTM deep learning model to address the spatiotemporal gaps in CO2 dry air column-averaged mole fraction (XCO2) data from multiple satellite sources (GOSAT, OCO-2, and OCO-3). By reconstructing high-resolution XCO2 distributions on a 1 km daily grid for Sichuan Province from 2015 to 2022, the model demonstrates superior performance in spatial and temporal feature extraction. Achieving an R² value of 0.97 and outperforming traditional models like XGBoost and Random Forest, the ResNet-LSTM model provides precise, stable reconstructions, significantly contributing to the verification of local emission inventories and the formulation of effective emission reduction strategies.
The study reveals key trends in XCO2 concentrations, including a steady rise from 398.9 ppm in 2015 to 416.6 ppm in 2022, with an annual growth rate of 2.21 ppm/ year. While XCO2 concentrations continue to increase, the growth rate has slowed, potentially due to changes in economic development, industrial restructuring, and emission reduction policies. The study also identifies significant seasonal variation, with XCO2 peaking in spring, declining during the summer growing season, and stabilizing in winter. Additionally, notable regional differences exist, with high-altitude areas showing stronger photosynthesis activity, affecting the spatial distribution of XCO2.
These findings offer a solid data foundation for local governments to develop carbon reduction strategies based on quantitative data. By increasing afforestation efforts in spring and autumn and enforcing stricter emission controls in winter, policymakers can optimize CO2 absorption and reduce emissions. This study not only contributes to the academic understanding of carbon distribution dynamics but also holds practical value in supporting Sichuan Province’s and other regions’ efforts toward achieving carbon neutrality and sustainable development goals.

