

Introduction
As an agricultural powerhouse, China’s agricultural carbon emissions are an important component of its overall carbon emissions [1, 2]. In recent years, the production of grain in China has been facing issues such as high costs, high energy consumption, and low efficiency. Particularly in grain production, there is a shortage of rural labor, leading to excessive use of fertilizers and pesticides by farmers in order to increase yields. This has resulted in a significant amount of carbon emissions and the worsening of unsustainable land use, posing a further threat to China’s food security. Therefore, green production in grain production is not only a necessary requirement for energy saving and emission reduction but also an essential requirement for safeguarding China’s food security.Against the backdrop of achieving “carbon neutrality” and “peak carbon emissions,” it is crucial to explore the current level of green production efficiency in grain production. Which factors influence the green production efficiency of grain? And what are the main factors influencing it? Identifying the driving forces behind green production in Chinese grain and exploring the guarantee of green and sustainable production in ensuring food security is of great significance.
The green production efficiency of food refers to reducing carbon emissions and minimizing environmental pollution while ensuring output [3, 4]. The academic community has conducted extensive research on the green production efficiency of agriculture. From a research perspective, there are mainly two angles: first, based on existing economic theories and the perspective of sustainable agricultural development, research on the green production of food mainly focuses on environmental pollution caused by agricultural production, considering factors such as pollution from fertilizers and pesticides [5, 6]; Second, from the perspective of overall balance in the ecosystem and analyzing research results within a global framework, exploring how to promote the development of food production without damaging the ecological environment [7-9]. In terms of research content, current studies on the green production efficiency of food mostly rely on macro-level data from provinces and countries to measure and compare the green production efficiency of food, analyze the deficiencies, and propose improvement strategies. However, there is less analysis of the impact of micro-level factors on the green production efficiency of food [10-13]. In terms of research methods, traditional DEA models are mostly used to calculate the green production efficiency of food, and some scholars use SFA models, SBM models, and others. However, they rarely consider the influence of external environmental factors, leading to biases in the calculation of agricultural green production efficiency. Furthermore, current research mainly employs the Tobit model to study subsequent influencing factors, which cannot further reveal the relationships between factors affecting the green production efficiency of food and lacks systematic analysis.
In summary, based on the literature review and problem analysis, this study’s main marginal contributions are as follows: First,this study examines the production efficiency of different plots using micro-level data and thoroughly explores the factors influencing the green production efficiency of food in different plots, providing more targeted recommendations. Second, considering the varying levels of disasters and land quality in different plots, this study utilizes a three-stage DEA model. Analyzes the impact of external environmental factors and random errors on input variables.Third, this study constructs a random forest model to identify the factors with the greatest impact on the green production efficiency of food and explores heterogeneity based on regional characteristics. The study utilizes partial dependence plots to reveal the impact pathways of important features on the green production efficiency of food. Overall, this study aims to make significant contributions by investigating the factors influencing the green production efficiency of food at the micro-level, incorporating external environmental factors, and exploring the causal pathways and relationships among these factors.
Materials and Methods
Theoretical Analysis
This study systematically analyzes the impact of household characteristics on the efficiency of green food production from five perspectives: village characteristics, household decision-maker characteristics, household characteristics, green production behavior characteristics, and land management characteristics.
Village Characteristics
Farmers take measures according to the external environment, and the transportation and economic characteristics of the villages where farmers are located affect the input of external resources, thereby affecting the efficiency of green production. Existing research has shown that the improvement of agricultural infrastructure is conducive to agricultural production. Rural infrastructure construction is an“early investment” that enables cost-saving measures such as large-scale agricultural production and technological progress, which can affect the efficiency of green food production [14].
Household Decision-Maker Characteristics
Household decision-makers determine the allocation of household resources, as well as the allocation of food production materials [15]. The level of resource allocation by farmers is a microcosm of the efficiency of green food production, often influenced by individual characteristics of farmers. For example, younger farmers with higher education levels have a higher willingness to accept green production technologies, which affects the efficiency of green food production.
Household Characteristics
Household characteristics determine the quantity of household production materials, and the input of green food production by farmers is the result of measuring the existing capital endowment of the household. As a labor-intensive industry, grain production requires a large amount of labor. However, the current transfer of rural labor to cities and the rise in labor costs inevitably lead to a loss of production efficiency [16]. In order to avoid the loss of production efficiency, farmers may use large amounts of pesticides, fertilizers, and other inputs to ensure production efficiency, but this also causes pollution and loss of green production efficiency. Therefore, labor is an important factor affecting the efficiency of green food production [17]. Therefore, household characteristics are important factors affecting the efficiency of green food production.
Green Production Behavior
Green production behavior refers to a production method that reduces rural environmental pollution and efficiently utilizes resources while ensuring agricultural production capacity [17]. It mainly includes soil testing and fertilization, and the use of low-toxicity pesticides. Studies have found that carbon emissions from crops mainly come from the use of fertilizers, pesticides, and other agricultural inputs during agricultural production, and the use of fertilizers and pesticides by farmers affects the efficiency of agricultural green production [14]. The green production behavior of farmers affects the allocation of production materials by farmers.
Land Management Characteristics
Land management characteristics affect the allocation of production materials by farmers, thereby affecting the efficiency of green food production. According to the theory of economies of scale, land management scale and land fragmentation can affect the compatible development of the environment and economy [18]. Large-scale operations can improve the level of mechanized operations, have a substitution effect on labor, and also provide favorable conditions for the application of green food production technologies [19, 20]. According to the theory of property rights incentives, there are differences in the property rights attributes between transfer-in land and contracted land, which also lead to differences in land inputs [21, 22]. Because the transfer-in party pursues maximizing benefits on the transferred land, it may increase the input of resources such as fertilizers and pesticides, resulting in a large amount of carbon emissions and pollution, causing soil compaction, degradation, etc. [23].
Data Sources
The data for this study were sourced from the “China Land Economic Survey (CLES).” This study chose to combine data from the years 2020 and 2021 to create a mixed cross-sectional dataset. The CLES survey at the plot level collected information on the “largest plot” from the interviewed households, including basic information such as plot yield and area, which can effectively meet the needs of this study. After data processing and screening, a total of 1,810 plot samples were obtained.
Model Setting
Three-Stage DEA
The three-stage DEA model is able to remove environmental and stochastic perturbations and more accurately measure productivity efficiency [24]. The three-stage DEA model can more accurately measure productivity efficiency by eliminating environmental and random factors. The process is as follows:
Stage 1: Traditional DEA modeling.
Stage 2: SFA modeling. SFA regression was used to exclude the effects of external environmental factors and random disturbances.
Stage 3: Adjusted DEA model. The inputs and outputs adjusted by the second stage are used to measure the green production efficiency of food again using the DEA model.
RF Random Forest Model
The Random Forest (RF) model is an ensemble machine learning algorithm proposed by Breiman [25, 26]. It consists of multiple decision tree models. Compared to individual decision tree models, Random Forest adopts an ensemble learning approach, where predictions are made based on the predictions of numerous decision trees. This enhances the fitting performance and stability of the Random Forest model [27, 28]. Due to its ability to process each decision tree in parallel, Random Forest has high computational efficiency when dealing with large-scale datasets. Random Forest provides the ranking of feature importance, which helps understand which features contribute the most to the prediction results. Random Forest has good robustness against missing values and outliers, and it can handle incomplete or noisy data. Compared to traditional linear regression models, Random Forest has non-parametric advantages, as it can output non-linear relationships between data and handle multicollinearity well. Therefore, it is widely used as an important machine learning technique [29, 30].
ISM-MICMAC Model
The Interpretive Structural Modeling (ISM) is a model that establishes the relationships between different factors based on theoretical analysis and expert consultation. It utilizes MATLAB software to hierarchically and categorically analyze the factors, thereby exploring the hierarchical relationships among them [31, 32].
Variable Settings and Descriptions
Three-Stage DEA
The evaluation and research on grain production efficiency are conducted from the perspective of inputs and outputs. Therefore, the constructed grain production efficiency evaluation indicator system mainly includes two aspects: input indicators and output indicators. The input indicators include land input, labor input, and capital input. Land input is measured by the area; labor input is measured by the number of self-employed workers in the households; capital input includes expenses such as pesticides, seed fees, and machinery operation fees. The output indicators are divided into two parts: expected output and non-expected output. The expected output is primarily measured by the total rice yield of the plot, while the non-expected output is mainly measured by carbon emissions. The coefficient values for various carbon emission indicators can be found in the research by Gai Zhaoxue and Li Bo [12, 13]. Environmental variables include the plot’s disaster situation, soil condition, and fertility [14]. The explanation of each variable indicator is shown in Table 1.
RF Variable Construction
This study uses the Random Forest (RF) model to examine the factors influencing grain production efficiency. The dependent variable in the model is the grain production efficiency, which is calculated using the three-stage DEA method. However, since the grain production efficiency variable is a continuous variable with values ranging from 0 to 1, when constructing the decision tree, if the dependent variable is continuous, the decision tree will become a regression tree. In regression trees, impurity is measured using mean squared error, while in decision trees, impurity is measured using the Gini coefficient and information entropy. In simple terms, the closer a decision tree is to the top root node, the greater the decrease in impurity. From an economic perspective, the root node has the greatest impact on the dependent variable. Therefore, in this study, a decision tree is used to form a random forest, dividing grain production efficiency into two groups: high efficiency and low efficiency. Based on the current input factors related to grain production, this study divides the factors influencing grain production efficiency into five parts. The first part is village characteristics, including accessibility (Tra) and economic conditions (Eco). The second part is household decision-maker characteristics, including gender (Gen), age (Age), education level (Edu), and health condition (Hea). The third part is household characteristics, including labor proportion (Lab), proportion of agricultural labor force (ALab), and number of owned agricultural machinery (Mac). The fourth part is green production behavior characteristics, including plastic film recycling (Fil), pesticide use (Pes), and fertilizer use (Fer). The fifth part is plot characteristics, including plot area (Are), whether it is contracted land (Con), and degree of land fragmentation (Fra).
Empirical Results and Analysis
Three-Stage DEA Results
Stage 1: Traditional DEA Rice Food Green Production Efficiency
In the first stage, the DEA model was primarily used to evaluate the grain production efficiency of 1810 plots, and the measurement results are presented in Table 2. The measurement results from the first stage show that the average ecological comprehensive efficiency of grain production for these 1810 plots is 0.758, indicating that there is still 24.2% room for improvement. There are 1100 plots, accounting for 60.77% of the total, with grain production efficiency above 0.9. Among them, 20 plots have a grain production efficiency value of 1, reaching the optimal efficiency and accounting for 1.1% of the total.
Stage 2: The Influence of Environmental Factors on the Green Production Efficiency
Since the first stage did not eliminate the influence of environmental factors and random disturbances, it could not accurately reflect the grain production efficiency of each farmer. In the second stage, the slack values of the input variables from the first stage were used as the dependent variable, while environmental factors such as disaster situation, soil, and fertility were used as explanatory variables. With the help of Frontier 4.1 software, the SFA regression results were obtained and presented in Table 3. From Table 3, it can be observed that the slack variables (γ values) for land input, labor input, and capital input approach 1. Furthermore, through a significance test at the 1% level, it indicates that the selection of environmental variables is reasonable. The LR one-tailed test for all three environmental variables also passed the 1% significance test, indicating that eliminating the environmental variables is both reasonable and necessary.
Stage 3: Adjusting the Green Production Efficiency Measurement Results
After adjusting the input variables based on the SFA regression results from the second stage and incorporating the original output variables into the DEA model, the adjusted green food production efficiency is obtained and presented in Table 4. The average green food production efficiency has increased after adjusting for environmental and random disturbances. The number of farms with optimal efficiency has also increased, with 31 plots achieving an efficiency value of 1, accounting for 1.71% of the total. Furthermore, 62.7% of the farms have an efficiency value above 0.9. This indicates that the presence of external environmental factors and random disturbances significantly underestimated the green food production efficiency of these plots.
Table 1.
Meaning of the variables and their descriptive statistics.
Table 2.
Results of the first stage of the green production efficiency measurement of grain.
RF Random Forest Results
RF Random Forest Construction
From the above results, it can be observed that only 31 production units are located on the frontier, accounting for 1.7% of the total. The majority of production units do not lie on the frontier, which leads to a severe issue of imbalanced data in the obtained dataset. This imbalance can greatly interfere with the learning process of the random forest algorithm. Therefore, determining whether a production unit is located on the frontier cannot be used as a classification label for machine learning [16].
Table 4.
Results of the third stage of the green production efficiency measurement.
Additionally, the purpose of analyzing the factors influencing the green food production efficiency of each decision unit is to promote energy conservation, reduce consumption, improve quality, and increase efficiency. However, even if the input-output situation is improved, the majority of farmers find it difficult to reach the production frontier due to their resource endowments and technological conditions. This will reduce the actual value of the random forest model. Taking into account the characteristics of the dataset, in the construction of the random forest model, farmers with a production efficiency greater than 0.9 in the third stage are considered as high-efficiency samples, while the remaining samples are considered as low-efficiency samples.
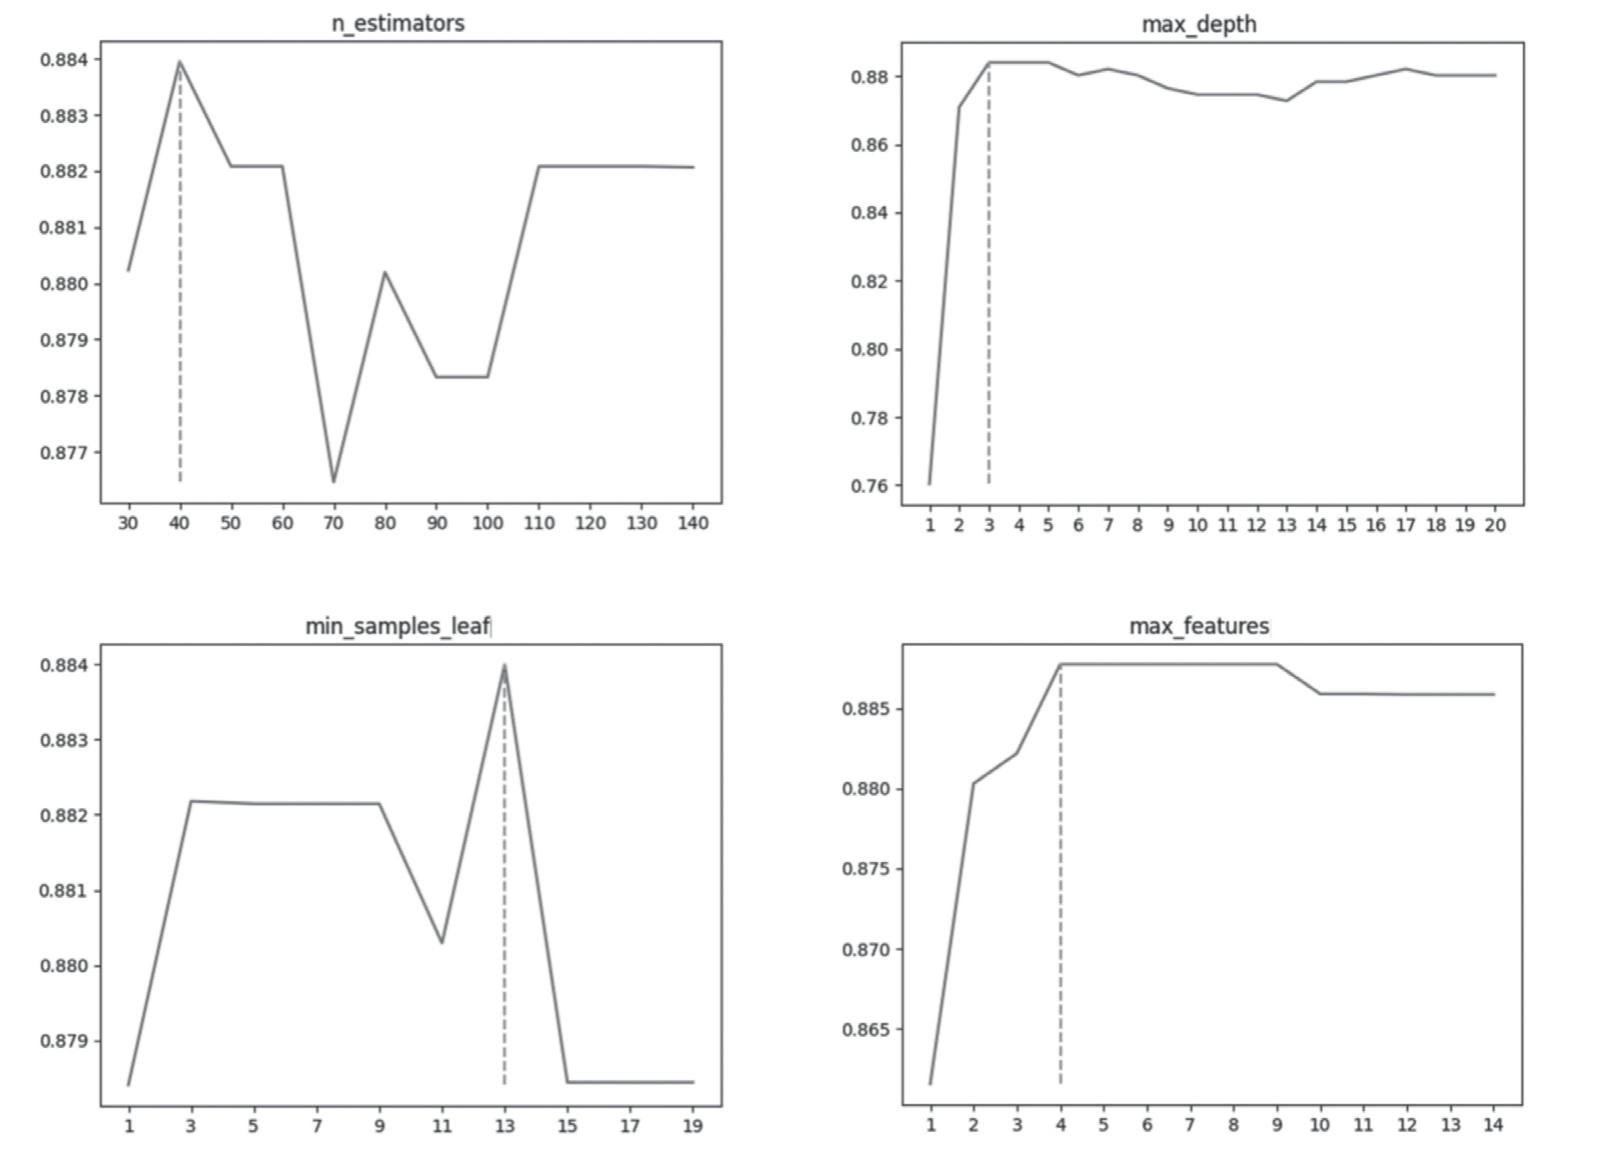
During the construction of the random forest model, considering the dataset characteristics, the model’s predictive results are validated using cross-validation to determine the four parameters that have the greatest impact on the model’s complexity. This helps in determining the optimal random forest model. In this study, the optimal combination of hyperparameters for the random forest model was determined as n_estimators = 40, max_depth = 3, min_samples_ leaf = 13, and max_features = 4. The specific parameter tuning process can be referred to in Fig. 1.
Table 3.
Estimation results of the second stage based on SFA.
Importance Analysis of Full Sample Characteristics
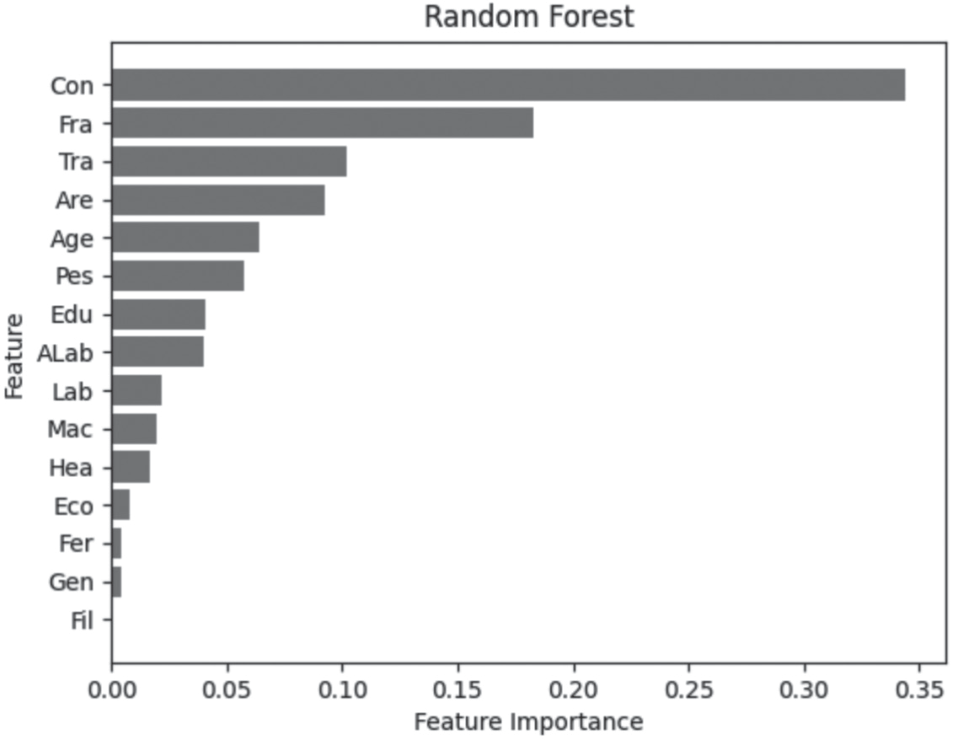
Fig. 2 presents the ranking of feature importance for the entire sample, with the horizontal axis representing the level of importance score, which is the average decrease in mean squared error of the random forest model after including that feature. It can be observed that the first four variables, namely Contracting of Land (Con), Fragmentation of Land (Fra), Accessibility of Transportation (Tra), and Plot Area (Are), result in significantly higher decreases in mean squared error compared to other variables. Firstly, under the stable land tenure situation, the remaining claim rights are explicitly and long-term allocated to contracted farmers, which provides economic incentives for farmers to pursue surplus profits in agricultural production [33, 34]. There is a coupling relationship between the stability of land tenure and the pursuit of green production efficiency by farmers. As contracted land parcels have long-term and stable operating rights and remaining claim rights for farmers, they value the long-term returns and sustainable development options of these parcels. Therefore, farmers choose green production technologies that are beneficial for the long-term sustainable development of land, aiming to improve green production efficiency and obtain surplus profits. For instance, if farmers become aware that excessive fertilizer application may lead to soil compaction and affect future land output, they may choose to use organic fertilizers. Regarding incoming land parcels, farmers have short-term and uncertain operating rights and remaining claim rights. Therefore, their objective is to maximize profits within the contracting period, without much concern for the sustainability of production, which leads to a decrease in green production efficiency. Secondly, intensive and large-scale land use can reduce the input of resources and energy per unit area [35]. The larger the plot area and the lower the fragmentation of cultivated land, the more scale benefits can be realized. When farmers manage fragmented land, they need to move between different plots, resulting in time and labor waste. To compensate for this waste, farmers may increase the input of resources and energy per unit area to maintain production efficiency but neglect the green production efficiency of food production. Finally, ensuring transportation accessibility facilitates the input of large-scale agricultural machinery and promotes the improvement of food production efficiency [36]. Transportation accessibility also provides conditions for the transportation of agricultural production materials and the handling of crop residues, thereby enhancing green production efficiency in food production.
Random Forest Robustness Test
To further validate the explanatory power of random forest, this study employed multiple linear regression models and a logistic regression model to examine the factors influencing green production efficiency in food production. The results were compared with the estimates from the random forest model, as shown in Table 5. Specifically, significant factors (at the 10% level) that influence green production efficiency were selected from the OLS and logit models, and their rankings were determined based on the magnitude of regression coefficients. From the perspective of R-squared (R2), the OLS and logit models had similar R2 values of 0.386 and 0.329, respectively, while the random forest model achieved a significantly higher R2 of 0.895, indicating that the random forest model has stronger explanatory power. In terms of rankings, the top four factors in the OLS and logit models were Con, ALab, Tra, and Pes, whereas the top four factors in the random forest model were Con, Fra, Tra, and Are. The variable “Contracting of Land” (Con) consistently ranked first in importance across all three models, and “Accessibility of Transportation” (Tra) consistently ranked third. This also suggests the robustness of the research findings. Due to the inclusion of multiple features, traditional estimation using statistical measures may face the problem of loss of degrees of freedom, leading to poorer significance of feature estimation coefficients. Random forest can effectively avoid the reduction of degrees of freedom and the issue of collinearity, thus providing more accurate feature importance rankings.
Food Green Production Efficiency Impact Path Analysis
In the previous analysis, the feature importance provided important guidance for further analyzing the pathways influencing green production efficiency in food production. Due to space constraints and for the convenience of analysis, this study only reports the top four features contributing to the improvement of green production efficiency: Contracting of Land (Con), Fragmentation of Land (Fra), Accessibility of Transportation (Tra), and Plot Area (Are). Fig. 3 displays the partial effects of these four features on ecological characteristics of food production, with the vertical axis representing the features affecting green production efficiency and the horizontal axis representing green production efficiency. The partial effects plot reflects the marginal impact of a feature change on green production efficiency while keeping other conditions constant, with higher slopes indicating higher marginal effects. The partial effects curve for Contracting of Land (Con) shows a stable slope of 1, indicating a positive correlation with green production efficiency. The partial effects curve for Fragmentation of Land (Fra) exhibits a turning point, with slopes close to 90 degrees between 0 and 0.1, positive slopes between 0 and 0.3, and negative slopes between 0.3 and 2. This suggests that, overall, Fragmentation of Land is negatively correlated with green production efficiency. The partial effects curve for Accessibility of Transportation (Tra) shows a decreasing trend between 1 and 1.2, indicating an overall increasing trend in green production efficiency as transportation accessibility improves. The partial effects curve for Plot Area (Are) indicates that larger plot areas lead to higher green production efficiency within the range of 0 to 5. However, a decreasing trend is observed between 5 and 30, indicating that larger plot areas are associated with lower green production efficiency.
ISM Model Construction
Constructing the Adjacency Matrix
Through random forest analysis, the importance ranking of factors influencing the green production efficiency of grain has been obtained. However, the hierarchical relationships between these factors cannot be determined solely based on random forest analysis. To provide reliable policy recommendations for improving green production efficiency, the ISM model was further employed to determine the hierarchical relationships among different factors. Based on the importance ranking, it was observed that the importance of plastic film recycling (Fil) is nearly zero. Therefore, plastic film recycling was excluded from the ISM model. The factors influencing green production efficiency were represented as Si (i = 1, 2, ..., n) and include land fragmentation (Fra), contracting status (Con), plot size (Are), fertilizer usage (Fer), pesticide usage (Pes), number of self-owned agricultural machinery (Mac), proportion of agricultural labor force (ALab), proportion of labor force (Lab), health condition (Hea), education level (Edu), age (Age), gender (Gen), economic condition (Eco), and accessibility (Tra). S0 represents green production efficiency. By consulting relevant experts and analyzing existing literature and theories, the relationships between these factors were determined. In this context, “V” represents the influence of a row factor i on a column factor j, “A” represents the influence of a column factor j on a row factor i, and “0” indicates no influence between the row factor i and column factor j. The reachability matrix can be found in Table 6.
Table 5.
OLS, Logit and RF meter results.
| Importance Ranking | OLS | Logit | RF |
|---|---|---|---|
| 1 | Con | Con | Con |
| 2 | ALab | ALab | Fra |
| 3 | Tra | Tra | Tra |
| 4 | Pes | Pes | Are |
| R2 | 0.386 | 0.329 | 0.895 |
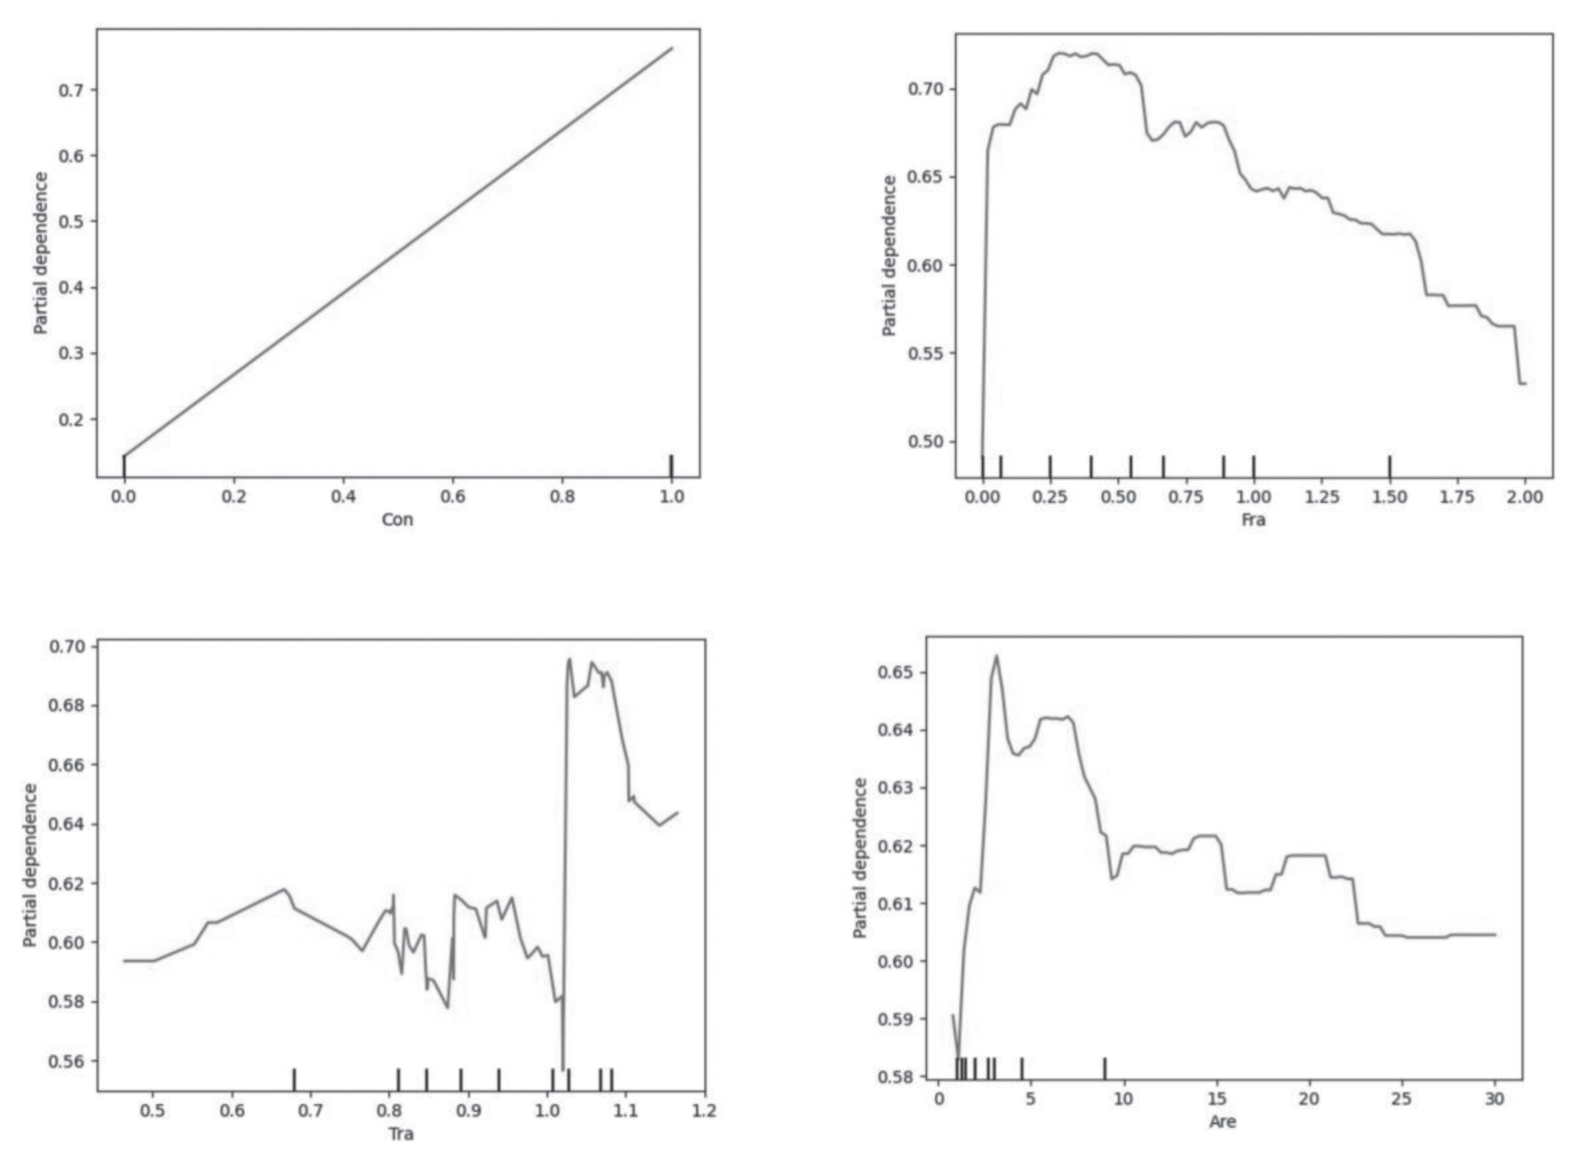
Table 6.
Reachable matrix.
Constructing an Explanatory Structural Model
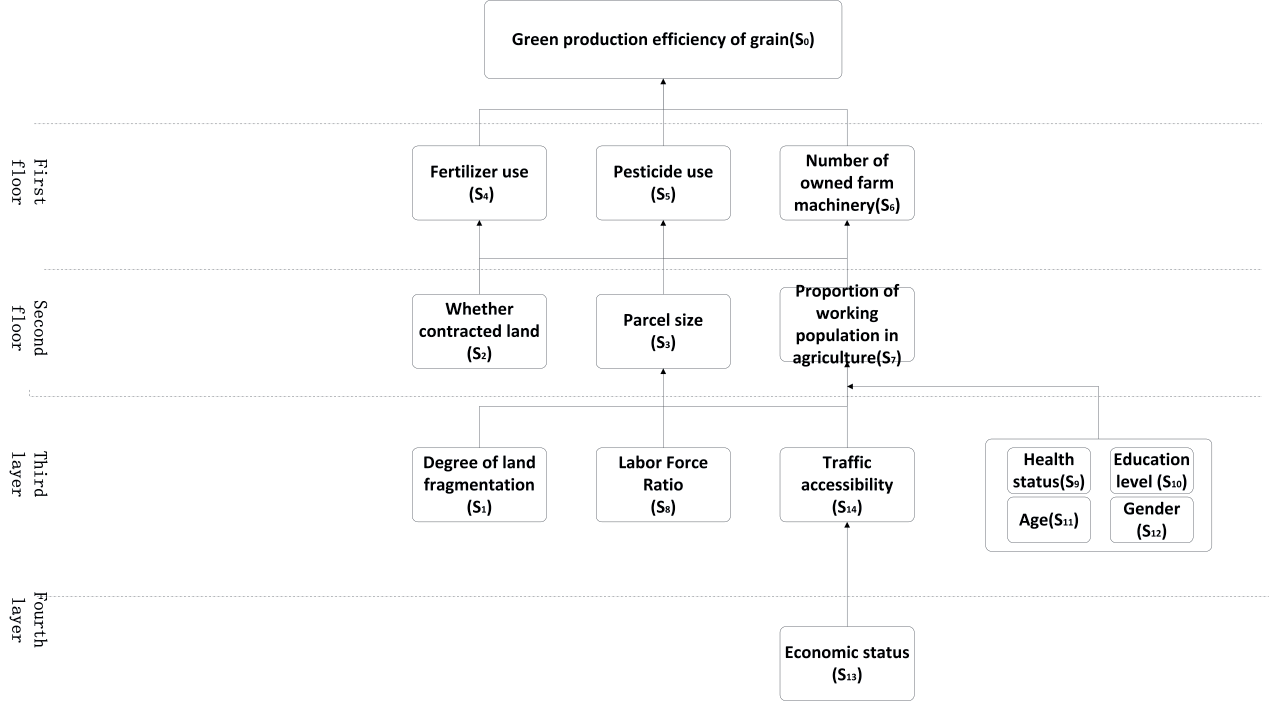
The hierarchical structure of the factors influencing the green production efficiency of food can be obtained according to the ISM hierarchical division table, which is detailed in Fig. 4.
Based on Fig. 4, the influencing factors can be divided into three categories: the first layer consists of direct factors, the second layer includes indirect factors, and the third and fourth layers represent deeper factors.
The direct influencing factors are fertilizer usage, pesticide usage, and the number of self-owned machinery. These factors directly affect the green production efficiency of grain, and it can be observed that these three factors primarily relate to material aspects. The indirect influencing factors primarily consist of three factors in the first layer. These factors indirectly affect the green production efficiency of grain by influencing the direct factors. The indirect factors include contracting status, plot size, and the proportion of agricultural labor force. The deep-level factors mainly comprise two layers, totaling eight factors. These factors are family-related factors, age, education level, gender, health condition, proportion of family labor force, land fragmentation degree, plot size, village accessibility, and economic condition. These factors have a more profound influence on the green production efficiency of grain.
Based on Fig. 4, we can observe five main causal paths:
“Contracting status → (Fertilizer usage, Pesticide usage, Number of self-owned machinery) → Green production efficiency of grain”: This path validates the influence of contracting status mentioned in the random forest feature importance analysis. Farmers who have contracted land are more likely to reduce the use of chemical fertilizers and pesticides due to long-term sustainable production considerations.
“Land fragmentation degree → Plot size → (Fertilizer usage, Pesticide usage, Number of self-owned machinery) → Green production efficiency of grain”: This path validates the impact of land fragmentation degree and plot size mentioned in the random forest feature importance analysis. These factors influence farmers’ input into their land, which in turn affects their operational efficiency. Farmers may excessively invest in resources such as fertilizers and pesticides to improve efficiency, leading to a decrease in green production efficiency.
“Proportion of family labor force → (Plot size, Proportion of agricultural labor force) → (Fertilizer usage, Pesticide usage, Number of self-owned machinery) → Green production efficiency of grain”: The proportion of family labor force influences the proportion of agricultural labor force in the family. As grain production is a labor-intensive industry, it requires a significant amount of labor. Insufficient labor force may lead to excessive investment in resources such as fertilizers and pesticides by farmers, resulting in a decrease in green production efficiency.
“Economic condition → Village accessibility → (Plot size, Proportion of agricultural labor force) → (Fertilizer usage, Pesticide usage, Number of self-owned machinery) → Green production efficiency of grain”: The local economic condition influences village accessibility, which affects mechanized operations and the input and output of materials in agriculture. On one hand, good village accessibility facilitates grain sales and the externalization of by-products such as straw, reducing carbon emissions from straw burning. On the other hand, village accessibility contributes to cross-regional agricultural machinery operations and facilitates farmers’ service purchasing, avoiding redundant machinery purchases within the same region, which would waste resources and increase carbon emissions.
“(Age, Education level, Gender, Health condition) → (Fertilizer usage, Pesticide usage, Number of self-owned machinery) → Green production efficiency of grain”: This path is related to the perceptions of household decision-makers. Decision-makers from different backgrounds may make different decisions, influencing the material inputs of households in grain production.
These five causal paths share the common characteristic of influencing the usage of fertilizers, pesticides, and the number of self-owned machinery, thereby affecting the green production efficiency of grain.
Discussion
This research also has its limitations. Firstly, the study utilizes data from the China Land Economics Survey (CLES), which focuses on the Jiangsu province – a region known for its strong economy, favorable geographical location, and being a major rice production area in China. Further investigation and validation are required to determine whether the findings of this study are applicable to economically disadvantaged, non-rice-producing, and remote areas. Secondly, the data used in this study primarily pertains to rice production, and there may be differences in the production processes of other cereal crops. Further exploration and validation are needed to determine the applicability of the conclusions to other grain crops.
In conclusion, this study provides empirical evidence for the factors influencing green food production efficiency. However, it is important to note that this research is preliminary and further in-depth analysis is necessary. The next steps of the research can be outlined as follows: Firstly, broaden the research scope to include the Chinese region and assess the applicability of the research conclusions within this context. Secondly, extend the research focus to include grains such as wheat and examine the variations among different grain crops. Lastly, perform regression analysis on significant factors that influence the efficiency of green food production to derive more robust conclusions.
Conclusion and Policy Recommendations
Conclusion
This study conducted research on the factors influencing green food production efficiency through a combined modeling approach of three-stage DEA-RF-ISM based on CLES data. The following conclusions were drawn:
(1) After excluding the influence of environmental factors, the efficiency values changed, indicating that green food production efficiency is affected by external environmental factors. After excluding environmental factors, the average green production efficiency was found to be 0.762, which still remains relatively low, indicating significant room for improvement.
(2) By constructing the Random Forest model, the importance ranking of features was obtained to identify the factors that have the greatest impact on green food production efficiency. The results of the partial effect analysis indicated that the top four factors with the highest impact on ecological production efficiency are contracting status (Con), land fragmentation (Fra), transportation accessibility (Tra), and land area (Are). Among these factors, contracting status and transportation accessibility have a positive impact on green food production efficiency, while land fragmentation and land area have an overall negative impact.
(3) The ISM analysis revealed that the relationships among factors affecting green food production efficiency can be divided into four levels and three layers, with five propagation paths identified. These five propagation paths have a common characteristic of influencing the use of fertilizers, pesticides, and the number of self-owned machinery, thereby affecting green food production efficiency.
Recommendations
(1) Encourage farmers to engage in land consolidation to reduce land fragmentation and achieve scale-based operations. However, it should be noted that a larger land area is not always better. Reasonable land area and layout can promote the integration of agricultural production scale and green production, thereby improving green food production efficiency.
(2) Guide farmers to make reasonable inputs of production resources and avoid excessive input of production resources per unit area, which may lead to a decrease in green food production efficiency. At the same time, promote the improvement of agricultural machinery, fertilizers, and other production resources to reduce carbon emissions and improve green food production efficiency.
(3) Improve agricultural infrastructure and strengthen the construction of agricultural transportation roads. This provides the necessary conditions for mechanization in food production and improves the conditions for agricultural product output and input of agricultural resources, thereby enhancing green food production efficiency.

