

Introduction
Over the past years, Chinese resource-based cities have achieved rapid economic development through resource exploitation, which has also caused much damage to the regional ecological environment [1-4]. Zoucheng City is located southwest of Shandong Province and is a typical coal resource-based city. The exploitation of coal resources has significantly damaged the local ecological environment. Thus, assessing its ecological environmental quality is crucial for harmonizing coal resource extraction with environmental conservation.
Urban ecological environmental monitoring is a complex task, and currently, it lacks clear and unified standards. In the 1970s, China began to conduct research on the ecological environment quality assessment system. In 1992, the Chinese Academy of Sciences and the Ministry of Agriculture conducted research on domestic resource environments using remote sensing and geographic information techniques [5]. In the same year, Fu created an index system to comprehensively assess regional environmental quality [6]. With the development of remote sensing techniques, the methods used for ecological environment monitoring have gradually increased, such as changes in vegetation indices, land use, and land cover changes. Remote sensing and geographic information techniques have provided new technical approaches for assessing ecological environment quality. In 1997, Li discussed the evaluation system for an ecological environment quality in mountainous areas [7], which includes indicators of overall quality that reflect the characteristics of the natural environment and indicators specifically related to human activities. In 2009, Ma et al. used vegetation information from SPOT-VGT NDVI time series data to monitor changes in vegetation and land desertification in the Shandong mining area [8]. In 2013, Xu proposed the Remote Sensing Ecological Index (RSEI) to monitor and evaluate the ecological quality of a city, which demonstrated strong comparability with other environmental assessment methods [9]. Xu conducted a spatiotemporal evolution study of the ecological environment quality of the entire country from 2002 to 2013 based on multi-source remote sensing data [10], providing an in-depth analysis of the spatiotemporal variation patterns of China’s ecological environment quality. More recently, Chen et al. (2023) utilized improved RSEI to analyze urban ecological quality in Jining from 2000 to 2020, revealing the spatial distribution of environmental quality and its response to human activities [11]. Fang et al. (2023) extended RSEI applications to study Suzhou’s environmental quality from 2010 to 2020, emphasizing the positive influence of urban green spaces and water bodies on the ecological improvement of the region [12].
In this study, we aim to explore an evaluation method for assessing the ecological environmental quality of coal resource-based cities. Specifically, this study aims to: (i) extract the four ecological indicators from remotely sensed data in Zoucheng City to build an RSEI; (ii) generate time series RSEI data for 2006 to 2022; and (iii) combine LULC data produced from Landsat satellite images using a random forest algorithm with the RSEI data to analyze the spatiotemporal change characteristics of the ecological environment in Zoucheng City.
The remainder of this article is organized as follows. Materials and Methods Section introduces the study area and data sources and describes the details of the classification method and the construction method of the RSEI. Results Section presents the analysis of spatiotemporal dynamic change characteristics. Conclusions Section presents the main conclusions and suggestions for future work.
Materials and Methods
Study Area and Dataset
Study Area
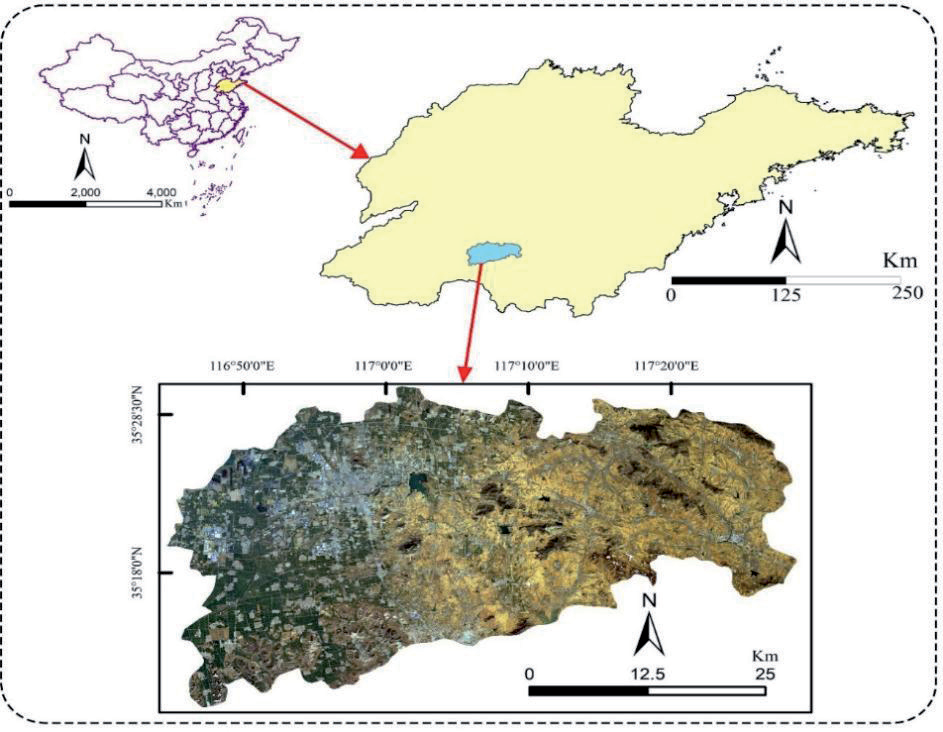
Zoucheng City, a prefecture-level city in Shandong Province, is situated in the southwestern part of the province, near the eastern region of Jining City. Its geographical coordinates roughly range between longitude 116°44′30″E to 117°28′54″E and latitude 35°09′12″N to 35°32′54″N. The city spans approximately 63 km from east to west and 35 km from north to south, covering a total area of around 1616 km2. Zoucheng City boasts abundant geological coal reserves, totaling 4.1 billion tons, which accounts for 17.22% of the proven coal reserves in Shandong Province (Fig. 1).
Data Sources and Processing
The study utilized Landsat remote sensing image data for Zoucheng City from 2006, 2011, 2016, and 2022. The images from 2006 and 2011 were obtained from Landsat 5 TM, while those from 2016 and 2022 were from Landsat 8 OLI. The overall cloud cover in the remote sensing images was less than 0.7%, with the imaging dates for all images around August. This ensured a high level of similarity in vegetation growth and ground conditions, which is crucial for guaranteeing comparability among the four periods of images. Additionally, visual interpretation was conducted using high-resolution images from the Google Earth platform, spanning 2006 to 2022. To reduce and eliminate distortions, as well as to enhance the display effects and interpretation accuracy of the Landsat remote sensing images, radiometric calibration, atmospheric correction, and geometric correction processes were applied [13, 14]. At the same time, auxiliary data in the study area were collected, including administrative boundaries and the distribution of mining areas.
Research Methods
Workflow
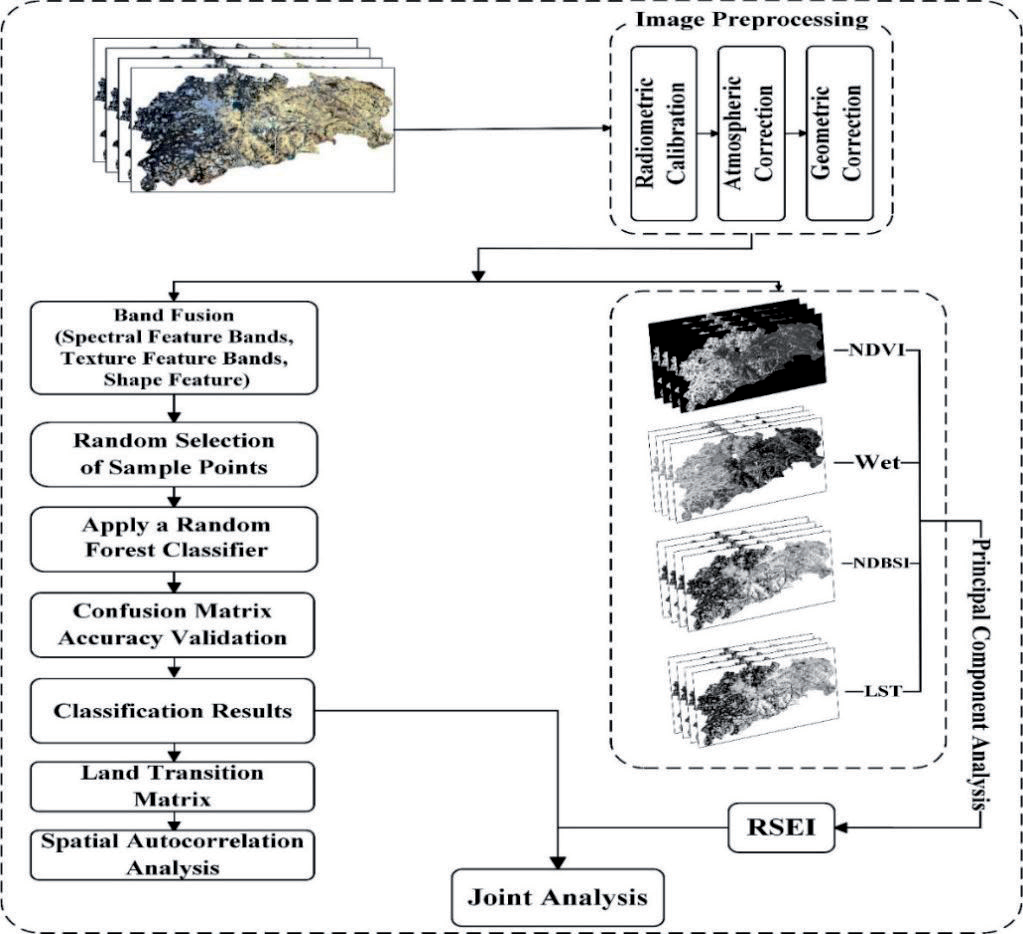
The method for evaluating the ecological environment quality of coal resource-based cities, explored in this study and depicted in Fig. 2, can be summarized in four key steps that include:
(i) downloading and preprocessing data; (ii) extracting four ecological indicators for Zoucheng city and constructing time series remote sensing ecological indices; (iii) classifying LULC by combining the Random Forest classifier with multi-feature remote sensing imagery; and (iv) analyzing the spatiotemporal dynamics of the city to provide an evaluation of the ecological quality in coal resource-based cities.
Construction of the Multi-Feature Sample Set
To decrease confusion among different land covers with similar spectral features, relying solely on spectral information is insufficient for research needs. As this is especially important to improve the classification accuracy of mining areas, we extracted additional features from multispectral images [15]. While fully considering the spectral characteristics of remote sensing data, this study utilized the six least correlated texture measures, namely mean (MEA), standard deviation (STD), homogeneity (HOM), dissimilarity (DIS), entropy (ENT), and angular second moment (ASM). The texture statistics used were as follows. Additionally, considering the high correlation between spectral bands, we initially applied Principal Component Analysis (PCA) to fuse the bands and then used the first principal component for texture calculation to minimize computational requirements. Finally, this data is fused with the preprocessed multispectral data. This approach results in remote sensing data comprising thirteen bands, as shown in Table 1:
Where N is the number of gray levels, P is the normalized symmetric GLCM of dimension N × N, and P (i, j) is the normalized gray level value in the cell i, j of the co-occurrence matrix such that the sum of P (i, j) equals 1. The calculation of texture statistics was based on a moving window around each pixel land, and the statistics were then attributed to the pixel itself.
Random Forest Classification
Random Forest (RF) is a comprehensive model of decision tree classifiers [16], a part of ensemble learning methods [17, 18] commonly used for classification, regression, and feature selection. RF improves prediction accuracy by constructing decision trees and voting on their results. It also improves prediction accuracy and robustness [19]. The random selection of samples and features and the ensemble of multiple decision trees mitigate the risk of overfitting [20] and improve the model’s generalization ability. RF is particularly effective in handling large-scale data [21], high-dimensional features [22], and complex relationships. This study utilizes the random forest algorithm for land use classification.
In this study, we randomly selected six types of LULC samples: Cropland, water, urban, forest grassland, bare land, and mining areas from the four periods of remote sensing data based on the land cover characteristics of Zoucheng City. To ensure the reliability of our classification results, we used multi-temporal high-resolution remote sensing images provided by Google Earth to assist in sample selection while also ensuring that the number of training samples for each category is not less than 150. Subsequently, corrections were made after classification, and accuracy was validated using a confusion matrix, with no fewer than 100 test samples for each period. The final classification results achieved an accuracy rate of over 80%, with the Kappa coefficient exceeding 0.8 for each period, as shown in Table 2.
Construction of the Remote Sensing Ecological Index
NDVI is a commonly used vegetation index that can reflect the growth status of surface vegetation, making it particularly suitable for ecological environment monitoring. In coal-resource-based cities, especially in areas with frequent coal mining activities, NDVI can effectively reflect vegetation restoration and degradation. Furthermore, since mining activities are often accompanied by vegetation destruction, changes in NDVI can reflect the process of vegetation degradation and recovery in these areas.
Table 2.
Sample information (Training/Test).
Wet typically reflects surface moisture conditions by combining multiple surface reflectance bands, effectively capturing changes in wetlands, grasslands, and water bodies. In coal-resource-based cities, mining activities, vegetation cover, and water body changes often influence moisture changes. Wet can reflect these ecological changes.
NDBSI is used to distinguish between urban built-up areas and bare soil, reflecting human activities and surface cover changes during urbanization. In coal-resource-based cities, NDBSI can effectively identify urbanization processes in mining areas and surrounding regions and the extent of bare soil exposure.
LST represents the land surface temperature and reflects surface heat changes. LST can effectively reveal the urban heat island effect and surface temperature variations caused by mining activities. In coal-resource-based cities, where large areas of bare soil and mining activities are common, LST changes are often quite significant, reflecting the thermal environment changes in urban and mining areas.
The heat index is represented using land surface temperature, calculated using the model provided in the Landsat user manual:
Lλ represents the radiance value at the sensor, QCAL is the pixel grayscale value (DN) in the thermal infrared band, and Grescale and Brescale are the gain and bias values for the thermal infrared band, corresponding to the bias (gain) and gain values in the image header file.
The sensor is configured with specific parameters based on different references. It is important to note that the ETM sensor has two main sets of parameters: low gain and high gain. Low gain is primarily used for high-reflectance areas, while high gain is used for large water bodies and other low-reflectance areas. This study focuses on urban and vegetation-covered areas, excluding large water bodies, so the corresponding parameters with lower gain values are selected here.
Brightness temperature, also known as the temperature of the top of the atmosphere, refers to the blackbody temperature with the same radiance as the observed object. The calculation method for brightness temperature is given by formula (10). According to this formula, the radiance temperature image can be transformed into brightness and temperature images on the satellite.
Where T is the temperature value at the sensor, also known as the brightness temperature by the satellite. K1 and K2 are calibration parameters with specific values K1 = c1/λ K2 = c2/λ; c2 is the Planck constant, with a value of 1438.7; λ is the central wavelength of the thermal infrared band; Lλ represents radiance data, measured in W/(m2∙μm∙K).
Where LST is the land surface temperature after emissivity correction, and λ is the central wavelength of the thermal infrared band: ρ = 1.438×10⁻²m∙K (ρ = h×c/σ, h is Planck’s constant 6.626×10⁻³⁴ J∙s, c is the speed of light 2.998×10⁸ m/s, σ is Boltzmann constant 1.38×10–38 J/K), and ε is the land surface emissivity. Land surface emissivity is used to describe the emissive capacity of the Earth’s surface and is a crucial input parameter for surface temperature inversion techniques.
Because the moisture fraction is also related to variables such as vegetation coverage, degree of coverage, and soil moisture in the environment, the term ‘Wet’ is used in this article to represent the humidity index. The formulas for Landsat 5 TM and Landsat 8 OLI are as follows:
where ρBlue, ρGreen, ρRed, ρNir, ρSwir1, ρSwir2 represent the reflectance values in the TM, OLI blue, green, red, near-infrared, shortwave infrared 1, and shortwave infrared 2 bands, respectively.
To fully consider the impact of bare soil and urban building structures in the images, the dryness index is calculated by averaging the normalized bare soil index (SI) and the building index (IBI), namely the following NDBSI. The mathematical expression is as follows. (ρ + ρ ) − (ρ + ρ ) BI = Swir1 Red Nir Blue
(15)
where ρBlue, ρGreen, ρRed, ρNir, and ρSwir1 represent the reflectance values in the TM, OLI blue, green, red, near-infrared, and shortwave infrared 1 bands, respectively.
Vegetation coverage is a key indicator for assessing the ecological environment quality of a region [23]. One commonly used vegetation index is the Normalized Difference Vegetation Index (NDVI), which utilizes the unique characteristics of vegetation in the near-infrared spectrum, such as a red-light absorption valley and high reflectance. This index can reflect specific information about the total quantity of green plants and the Leaf Area Index (LAI). The expression for NDVI is:
where ρRed and ρNir represent the reflectance values in the red and near-infrared bands of TM and OLI, respectively.
Principal Component Analysis (PCA), based on the concept of dimensionality reduction, employs linear transformation to convert multiple original variables into a few comprehensive variables that contain the majority of the important information from the original variables. This approach helps reduce redundant steps in information statistics research, thereby avoiding data overlap and reducing the correlation between datasets. The variance contribution rate can be used to characterize the quantity of information contained in each major factor. To ensure that the selected indicators contain the majority of the information from the original data and are representative, new indicators with an average contribution rate exceeding 80% can be chosen. For ease of measurement and comparison between indicators, standardization is also applied:
The range of values for the RSEI is [0, 1]. A higher RSEI value indicates better ecological environment quality, approaching 1, while a lower RSEI value indicates poorer ecological environment quality, approaching 0.
Results and Discussion
Analysis of Land Use Evolution
The LULC transfer situation can intuitively reflect changes in regional ecology. The mutual conversion among cropland, forest grassland, bare land, mining, and urban areas in Zoucheng City is a crucial factor influencing the local ecological quality. Table 3 shows the mutual land use transfers among the six primary land classes in Zoucheng City during three different periods: 2006-2011, 2011-2016, and 2016-2022.
Based on the characteristics of the land classes in Zoucheng City, this study analyzes the quantitative relationship between the conversion of bare land and forest grassland during the study period. As shown in the table, the area of bare land first increases and then decreases from 2006 to 2022. Between 2006 and 2011, the area of bare land in Zoucheng City increased from 663.6600 km2 to 717.0840 km2, then decreased to 611.6526 km2 by 2022. In contrast, the area of forest grassland experienced a situation of first decreasing and then increasing. It decreased from 360.7416 km2 to 324.6804 km2 from 2006 to 2016, then increased to 398.0755 km2 in 2022. This shows that after 2011, bare land became the main output land type, while forest grassland became the main input land type, and the ecological environment quality of Zoucheng City gradually improved.
Table 3.
Land transition matrix for the study area from 2006 to 2022 (Unit: km2).
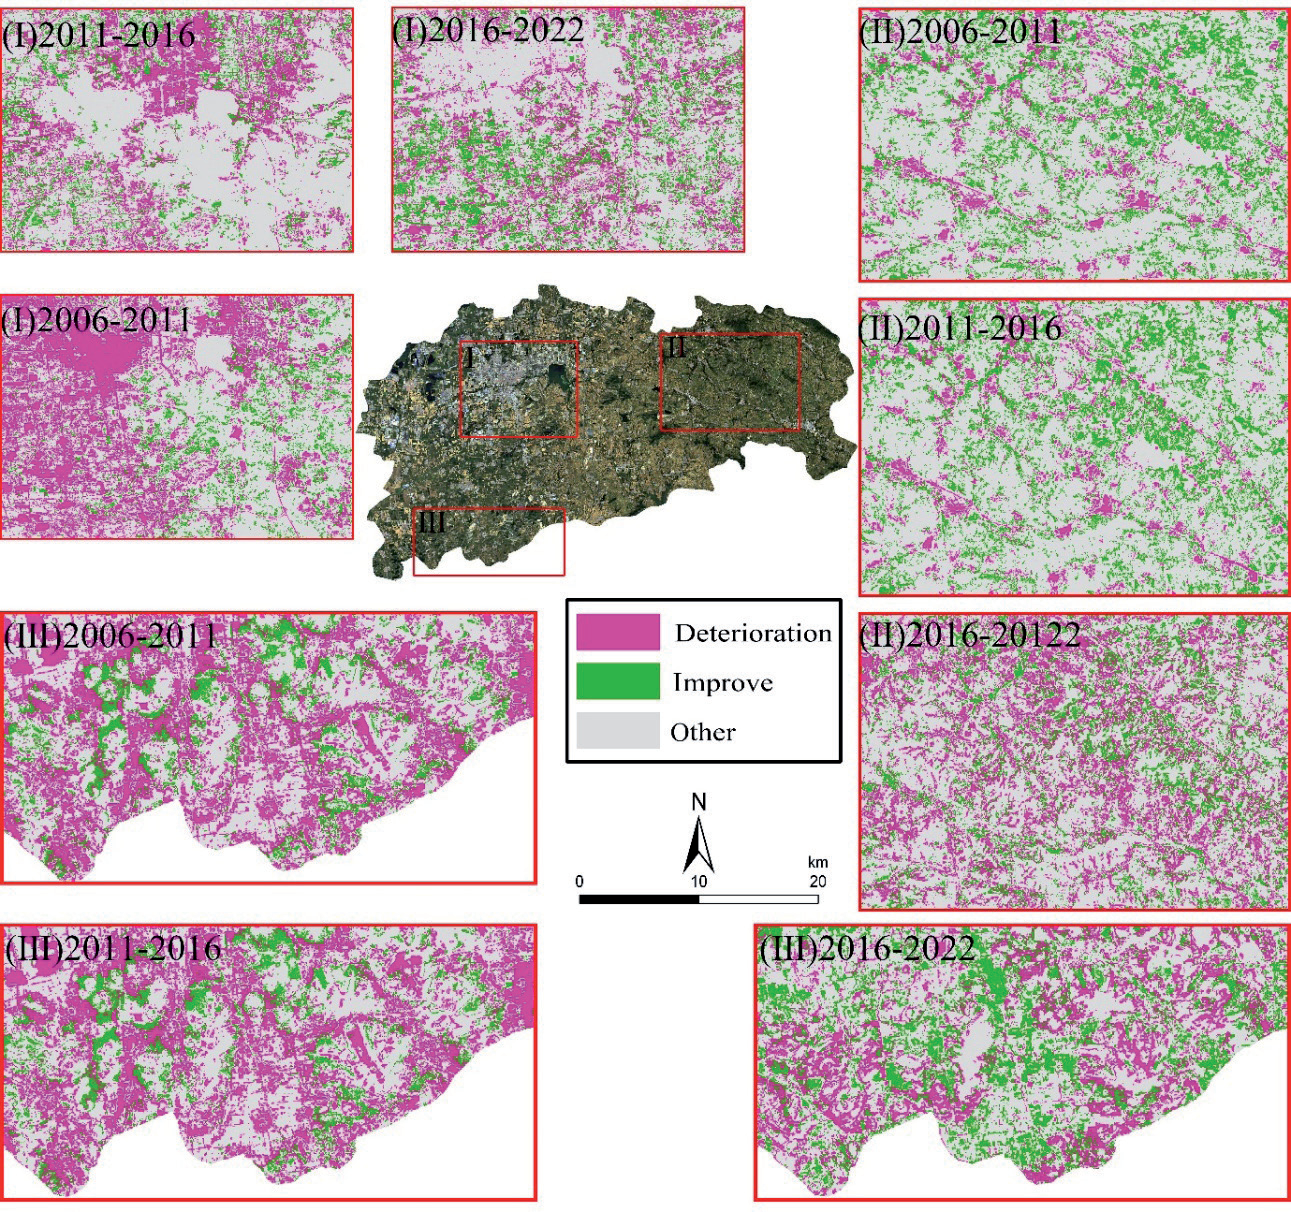
To further study the impact of LULC transformations on the ecological environment quality in Zoucheng City, we reclassified it into three categories: Improvement, Deterioration, and Other. We focused our research on three typical representative areas: (I) urban areas, (II) natural areas, and (III) main mining areas. As illustrated in the Fig. 3, the three typical areas show similar development characteristics: the area occupied by deterioration grew from 2006 to 2016. In contrast, the area occupied by improvements was larger from 2016 to 2022. In the urban areas (I) and main mining areas (III), land transitions were relatively concentrated, characterized by expansion from the center outwards. In contrast, the natural areas (II) experienced more dispersed changes, with a messy spatial distribution.
Spatial Autocorrelation Analysis
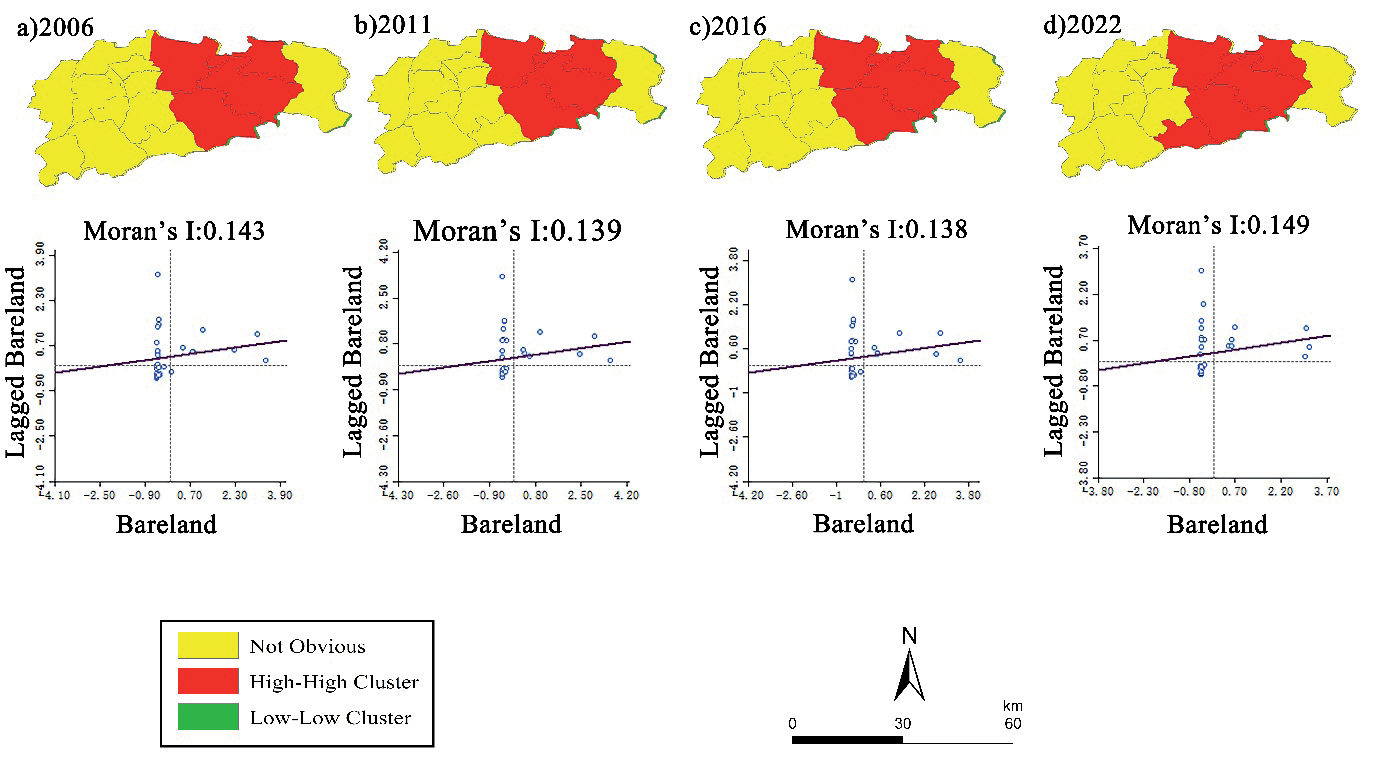
Considering the negative impact of bare land on the ecological environment, spatial autocorrelation analysis was conducted on its distribution using Geoda in Zoucheng City for 2006, 2011, 2016, and 2022 [24]. The global Moran’s Index and local Moran’s Index were calculated for each period. The global Moran’s Index values for the four periods were 0.143, 0.139, 0.138, and 0.149, respectively, indicating a positive correlation in the distribution of bare land. However, the correlation is insignificant, suggesting a relatively low degree of human intervention. High-high clustering is mainly observed in the eastern towns of the city, with several spatial outliers in the western region (Fig. 4).
Spatio-Temporal Analysis of Remote Sensing Ecological Index
This study utilized principal component transformation to construct the RSEI data and conducted a dynamic assessment of the ecological environment in Zoucheng City [25-27]. Table 4 summarizes the results of the four ecological indicators in Zoucheng City after undergoing principal component transformation. The eigenvalues of the first principal component in 2006, 2011, 2016, and 2022 are 0.2816, 0.2250, 0.2205, and 0.3010, respectively. The eigenvalue contribution rates all exceed 80%, indicating that in the four study periods, the first principal component concentrated most of the key information from the four indicators: greenness, humidity, heat index, and dryness.
Fig. 3.
Land transformation map of the study area for three phases. Note: The output from forest grassland to other land types and the input from other land types to bare land and mining areas are classified as “Deterioration”; the land types of input from other categories to forest grassland are classified as “Improve”; the remaining are classified as “Other”.
Over the four study periods, the indicators of greenness, humidity, dryness, and heat index all contributed to the first principal component, and there was no fluctuation, as seen in PC2-PC4. This indicates that the values displayed in PC1 are much more stable than those in PC2-PC4, and PC1 is better at capturing the characteristics of the indicators. Based on the data obtained from the four study periods in 2006, 2011, 2016, and 2022, the greenness index and humidity index in the first principal component are positive, indicating that vegetation coverage and environmental humidity play a positive and active role in the ecological environment protection of Zoucheng. On the other hand, the dryness index and heat index are negative, suggesting that land surface temperature and the degree of land degradation have a negative and adverse impact on the ecological environment in Zoucheng [28-30].
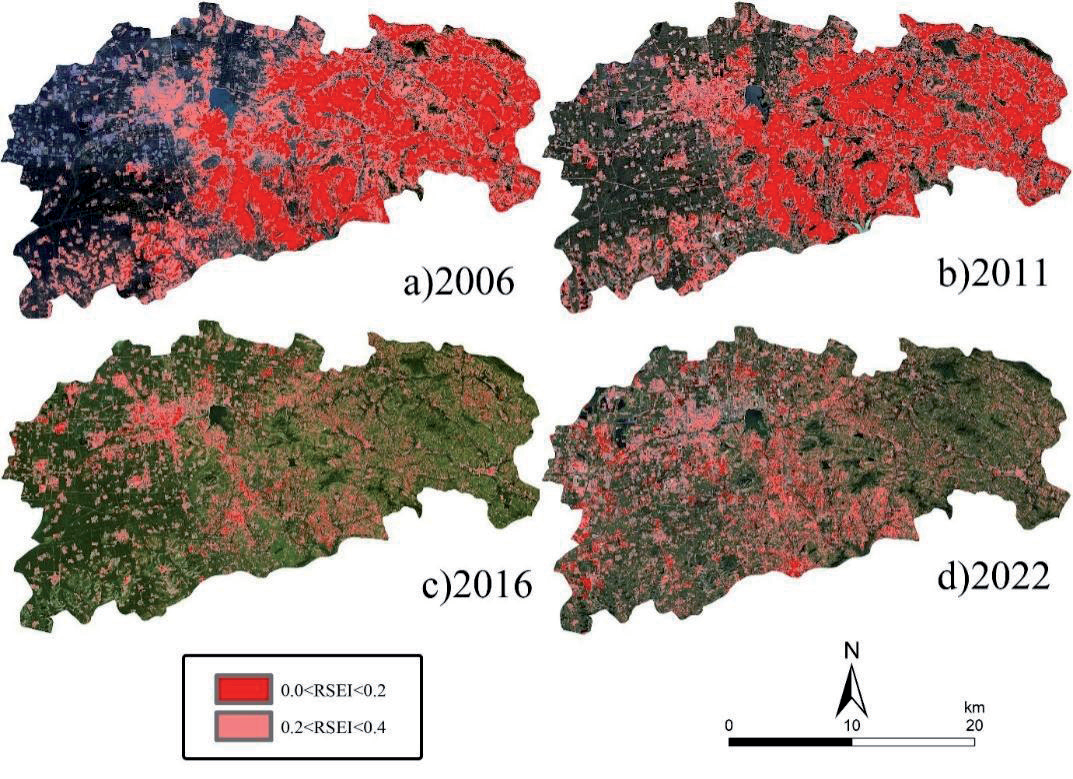
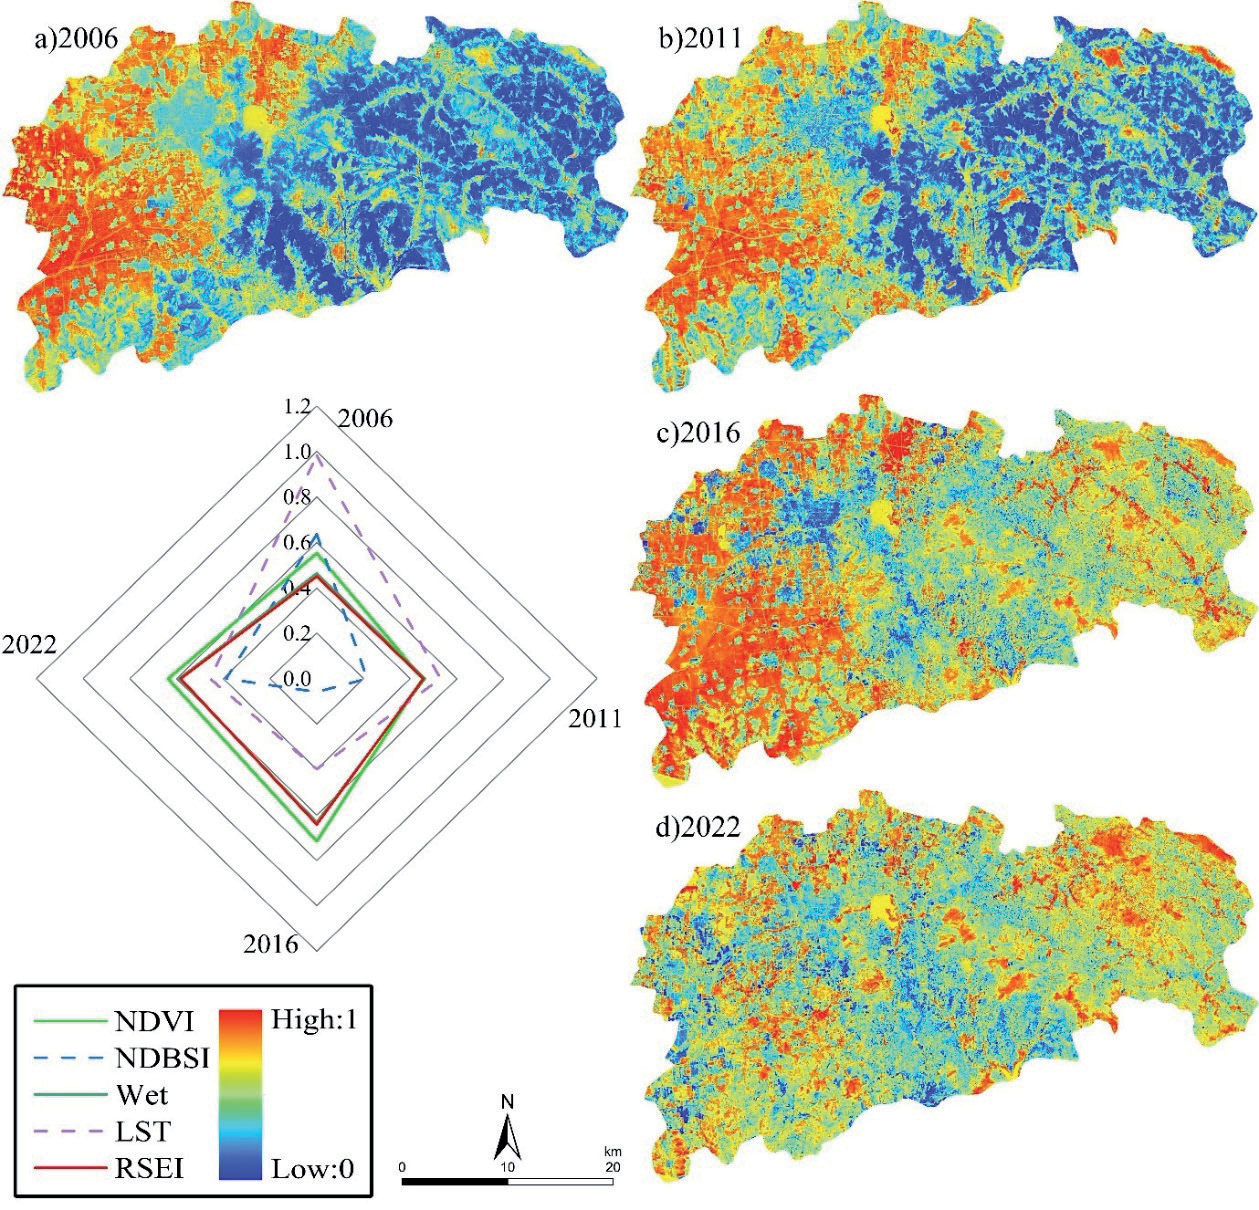
To further study the spatiotemporal changes of the urban ecological environment quality in Zoucheng City during the study period, we depicted areas with relatively poor ecological environment quality based on the constructed time-series remote sensing ecological index data: 0.0<RSEI<0.2, 0.2<RSEI<0.4. This study used an intuitive analysis method. As shown in Fig. 5, in 2006 and 2011, areas with lower RSEI values were distributed in the western part of Zoucheng City, occupying a larger proportion of the area. This was due to the predominance of bare land in the western areas, which could not support complex ecosystems. Before 2016, areas with lower RSEI values were mainly distributed in the primary urban areas of the east, with scattered low-value areas in the west, indicating a significant improvement in the ecological environment quality in the western regions. The number of areas with low RSEI values increased from 2016 to 2022. This is due to the increase in negative factors such as NDBSI and LST caused by urban development. NDVI and Wet represent vegetation coverage and surface moisture, respectively, and are indicators for analyzing urban ecological quality [31]. ST and NDBSI are influenced by various factors, such as exhaust emissions and the respiration of animals and plants [32-35]. Although not directly related to ecological environment quality, their impact on the RSEI ecological index should not be overlooked [36-40].
As shown in Fig. 6, the average RSEI values of Zoucheng City for the four periods (2006, 2011, 2016, and 2022) are 0.4501, 0.4562, 0.6417, and 0.5822, respectively, showing significant fluctuations that can be roughly divided into three stages. The ecological environment quality was relatively stable, with lower RSEI mean values and a larger area of low values from 2006 to 2011, reflecting poorer ecological environment quality. The mean RSEI value of Zoucheng City increased by 40.66% from 2011 to 2016, indicating a significant improvement in ecological environment quality. From 2016 to 2022, the average RSEI value of the study area decreased again. The RSEI value of Zoucheng City shows an ecological degradation gradient that gradually decreases from west to east from 2006 to 2011, meaning that the ecological environment quality in the west is significantly higher than in the east. This ecological pattern was significantly improved by 2016, with urban expansion and development becoming the main factors for the decrease in the ecological environment quality of Zoucheng City.
Table 4.
Principal component analysis of indicators.
Conclusions
The excessive exploitation of coal had negative impacts on the stability of ecosystems. Therefore, protecting and restoring the ecological environment has become an urgent task. This study developed an RSEI based on four ecological indicators extracted from Landsat images and assessed the ecological environmental quality in Zoucheng City (a coal resource-based city) from 2006 to 2022 by integrating the LULC data produced from Landsat satellite images using the random forest algorithm. The main conclusions are as follows:
(i) The average RSEI value of the study area changed from 0.4501 to 0.5822 during the study period, experiencing an upward trend followed by a decline. NDVI increased by 15.31%, indicating a significant enhancement in vegetation coverage. The impact of surface bareness on environmental quality gradually diminished, and urban expansion became a major factor affecting the region’s ecological environment quality.
(ii) From 2006 to 2011, the western region of Zoucheng City was predominantly composed of cropland and forest grassland, while the eastern region was characterized by bare land and mining. This created a distinct ecological gradient, with the western region having better ecological quality than the eastern region, indicating relatively chaotic land use and minimal human intervention. Significant improvements were observed until 2016.
(iii) The area of bare land decreased from 717.0840 km² to 611.6526 km² during the study period, indicating a significant improvement in the ecological environment. However, bare land still accounts for 37.92% of the total area. Reducing the area of bare land and increasing vegetation coverage remain the primary methods for improving the ecological environment quality in the Zoucheng City region.
The ecological environment quality evaluation method explored in this study can provide certain references for the sustainable development of Zoucheng. However, due to limitations in data quality, the experiment was based only on data from four years (2006, 2011, 2016, and 2022), overlooking finer temporal dynamics. Therefore, we will consider using data with higher temporal resolution in future research. Additionally, this study only considered four indicators (NDVI, Wet, NDBSI, and LST), and the ecological environmental assessment result may be questionable for some local regions of the study area. In future studies, we will draw on the research of many scholars in the field of environmental assessment and further explore more influencing factors when designing RSEI.

